Trading plan for S&P500 - Short Strategy – ES1Zone Sell : 3004
Target : 2970
Zone Sell : 2954.75
Target : 2935
And don't forget to take your profits...
Sp500future

SPX (SP 500) may test 3135-3130 levels soonS&P 500 (SPX) has shown a splendid (but unnatural) rally in couple of months. However, before having a sustainable direction, I would expect the prices to retract towards 3135-3130 levels.

SP500 IN RISING WEDGE THE SP500 future contract is trading in a rsing wedge and the volumes are quite low, I think that in next days we will see a strong breakout and a fall of the price, this V-shaped recovery will not last long because Covid risks are still high all over the world.
Use a correct money management and check audusd because in this time they are correlated, if you look at my analysis on audsd (bearish view in mid-term) you could understand better the bearish view in Standard and Poor 500.
Enjoy your trading!!!
watch this level SP500BFI sell level... or is it a trap? Time will tell but with the current political and civil tensions building its easy to say, this price level can possibly predict a dramatic event quickly approaching. Will coronavirus, black lives matter and global political tensions cause the big sell off? Or, will this be another big fake-out and breakout to the upside? Time will tell. Just don't sleep on this zone.

S&P 500 : Even the most blind prophets will soon speak outS&P 500 : Even the most blind prophets will soon speak out.
And that only makes things worse... That's all I can say at this point.
Stay safe, stay healthy!
ReallyMe

Trading Plan #SP500 (LONG)Hey Guys! Like and comment if you like the content. 👍 Subscribe will be a lot of interesting 👌
Suppose correction to the area 2.936 and from this price I will buy for the purpose of 3.390
DISCLAIMER:
The opinion of the author may not coincide with yours! Keep this in mind and consider in your trading transactions before making a trading decision.

S&P 500 LOW VOLATILITY (SP500VOL) DailyDates in the future with the greatest probability for a price high or price low.
The Djinn Predictive Indicators are simple mathematical equations. Once an equation is given to Siri the algorithm provides the future price swing date. Djinn Indicators work on all charts, for any asset category and in all time frames. Occasionally a Djinn Predictive Indicator will miss its prediction date by one candlestick. If multiple Djinn prediction dates are missed and are plowed through by same color Henikin Ashi candles the asset is being "reset". The "reset" is complete when Henikin Ashi candles are back in sync with Djinn price high or low prediction dates.
One way the Djinn Indicator is used to enter and exit trades:
For best results trade in the direction of the trend.
The Linear Regression channel is used to determine trend direction. The Linear Regression is set at 2 -2 30.
When a green Henikin Ashi candle intersects with the linear regression upper deviation line (green line) and both indicators intersect with a Djinn prediction date a sell is triggered.
When a red Henikin Ashi candle intersects with the linear regression lower deviation line (red line) and both indicators intersect with a Djinn prediction date a buy is triggered.
This trading strategy works on daily, weekly and Monthly Djinn Predictive charts.
This is not trading advice. Trade at your own risk.

SPX double gap just above 0.618 retracement support of impulse!!Will SPX 0.618 bounce after filling the huge double gap?!
That is a trade that I would make!
Clear 12345 impulse just happened, way too many people are currently longing 0.618 resistance, be smarter than the crowd, wait for the retrace!...

Signals For 22/05/2020Signals 22.05
Hello my friends, today we will be looking at signals for the nearest trading session. I am once again going to be sharing my top seven trading ideas with you.
First let’s see how yesterday’s ideas worked out.
We started with EURUSD, I recommended that is the price holds above 1.096, you should buy, my first target was around 1.10, and if it held below 1.095, that’s a sell. The second scenario occurred and the price hit my first goal at 1.090.
Next was GBPUSD, unfortunately, the idea didn’t work out, I recommended you long after a false breakout and pullback. The price did break out, but then didn’t continue upwards by much. It did hit my first target, but then just meandered downwards and hit my stop loss. Luckily, we’re smart and use the safe rule, so we broke even.
USDCAD – I recommended you look at it long distance, since the price is flirting with an important support level around 1.39 and as you can see the price formed a false breakout and broke through the dynamic resistance, which is an entry for a long position. My first target was around 1.40, which the price hit. The breakout had a large volume spike, which is a very bullish signal.
Next, we have aussie-usd. Here I said that if the price holds above 0.6550, that’s a long entry point, with the first target being around 0.6640. Unfortunately, the price missed my target by a few pips and then impulsed down, away from a reversal level, so I’d say the idea was solid, we just got a little unlucky. After the bounce the price actually went below the previous level and held below it, which was my second scenario and my first target will be around 6470
Gold – I recommended you long yesterday, and right now, this is still sound advice, so relax, and wait it out. You should be fine
Oil – I recommended you short this instrument. For the opening the position I recommended you look to the level around 34.50 – as you can see, the price got a bounce from there yesterday and fell down to 31.50. My first target will be around 28/contract, so if you’re in a short position right now, just stay there for now.
And lastly we’ll look at S&P 500. Here I advised you short if the price held below 2950, first target being around 2910 and the second around 2870, and the price hit our first target.
Right! That’s if for yesterday’s signal, let’s look what we have here today.
Seemingly, as tradition, let’s start with EURUSD. We tried to get a bounce from an important support level around 1.088. If a bounce does happen, and an entry pattern forms, we can place our first goal at 1.092 and the second around 1.095. I the price breaks through the level and forms a pattern we can enter with a sell with our first goal being 1.084
Next is GBPUSD. It’s looking pretty bearish once again, everything depends on how the price will react to the important level around 1.2180. If it holds below, the price will go further down, and your first target should be around 1.2080, there’s also a 20% chance that the price will go back up, if that does happen look for a pullback and enter a long, with your first target at 1.2240
USDCAD, as I’ve said, looks pretty bullish. The price tried to get a bounce from an important level at 1.40 and if it holds below, go in for a sell with a goal at 1.3960. If it breaks it and holds above, that’s a good opportunity for a long position with the first goal being 1.4060
Next is AUDUSD, you can see, we’ve stayed in a big range for a long time, the price formed a false breakout, so I think it’s looking pretty bearish. If the price pulls back and fractals into the level at 0.6550, that’s an entry for a short, with goals at 0.6480 and 0.64
Gold – I’m still feeling bullish, but it’s interesting how it’ll react to the level at 1730, if it holds above, that’s a bullish scenario, and my targets will be 1750 and 1765.
Oil – right now we’re in a support level at 31.50, if we get a bounce, I’d put the target at 33.50, and then I think a reversal pattern might form and we’ll enter a short with the first goal at 28.50. If we do break the support, we can short straight away and our goal will also be 28.50.
Last but not least, we have S&P 500. We can see that the price is in a big consolidation, we got a bounce from the support at 2910 and this is pretty bullish, if the price forms a pattern, I’m thinking long with the first target being around 2970. There’s like a 30 % chance that the price breaks the support and stays below for a bit, in that case we can short with our goal at 2870.
Well, that’s about it, thank you very much for reading, and best of luck in the market.

US 30 Short at 32 with SL 34.50We are doing Analysis of US30 on 1 Hour Timeframe.
The projected target from the breakout is usually the vertical distance from the high to the bottom .
Note: This is only for Educational Purpose this is not an Investment advice.
Please support the setup with your likes, comments and by following on Trading View.
Thankyou
Ankur Verma
Twitter : Ankurverma3838


Near-term target for sp500: $2500Don't have much time, just wanted to point out that sell volume + inability to establish higher lows = confirming the turn

SPX / S&P 500 - DROPWait until price breaks out of consolidation and sell to blue area.. potential to go to orange area but risky

SP500 (Y20.P3.Video).Recent price action explained.Hi All,
*** Note: This video is a followup on my previous posting on the SP500 forecast, with measured success. ***
The following video post is my take on the SP500 price action in terms of technical analysis.
If you were to look at my previous posting on this, it gives a background to this video.
But I also recap some of the points in this video.
This video recording is my attempt to explain what I take from the charts, historically and how its applied to the past few months and the next phase of the market.
Please give me a like or a tick for making this effort.
Regards,
S.Sari
My reference: A.Charts
Reference materials:
Bump and Run Chart Pattern Strategy>
tradingstrategyguides.com
Previous post and a background reference to this video

My analysis for S&P 500 E-mini Futures After that pullback, we can wait for a bearish trend next week so be ready to sell

SP500- V shape recovery? Yeah, sure...More and more people are calling for a V shape recovery and for certain the chart looks like this.
And if you ignore the economical and fundamental facts we can all be happy, drink margaritas and sing Kumbaya, for sure most of us will be out of a job and have time to spare...
Leaving the joke aside what's happening on Wall Street looks like desperation and distribution on higher prices, not at all like a V shape recovery.
From a technical point of view, SP500 is in 3000 zone resistance and it can easily pass this to "make the news", it will last, for sure, NO!
In my opinion spikes above 3000 should be sold for a drop to 2200 zone.

S&P 500 index NEW PARADIGM Shiny, gorgeous stonks looks like they move you straight into heaven.Looks like very bullish. But my feeling about the market is bearish of course. May be this time is different, maybe my bearish broken bias are lying to me. I made this thoughts before, when last bear are completely change his bias to bullish price immediately stop rising and start to reverse
3050-3130 are good levels for sell

$ES lanesOnce $ES retests the top of the blue lane = bottom of the red lane = swing low on daily I anticipate a move through the middle of the channel, testing, and the bottom test. This rally end in 2900-3000 area. 3150 is my invalidation point.

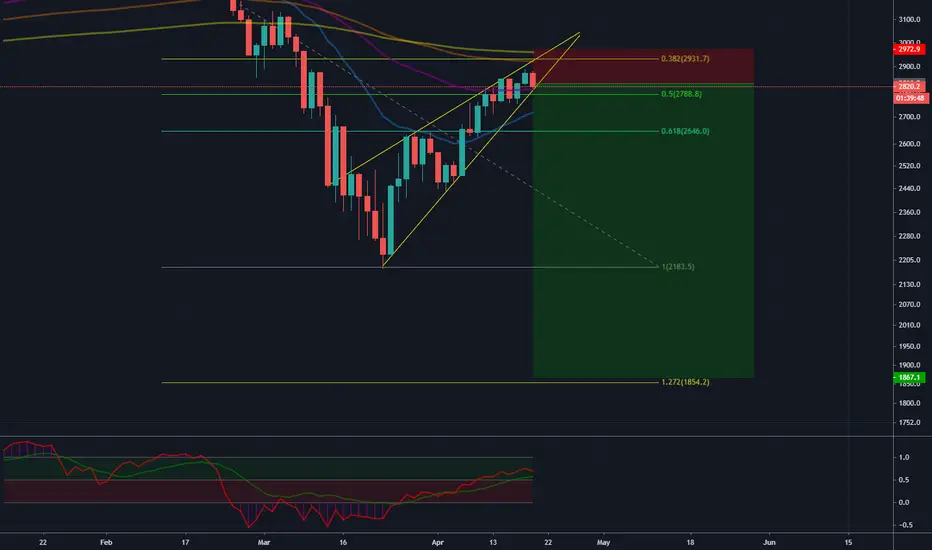
Possible EW ABC pattern on S&P 500 futureI spotted a 5 wave wedge pattern near the near of the previous up trend which tells me there could be a possible Elliott wave ABC pattern forming. The B should not break the start of wave A because wave A is 5 waved. It would be possible to short wave B to wave 5 for a nice risk reward ratio. Aim to short at 50 or 61.8 fib of wave A.

Will S&P500 avoid a selling panic amid coming Q1 reports? HELPThe S&P500 is enduring tense economic times with high money injection.
If next week S&P500 crosses 2690 a critical support level with high volume ==> It will be bad that may trigger a market selling panic with volume stop losses executed downward.
However, if the S&P500 continues its uptrend movement and crosses 2872 with strong volume, the next resistance and TP is at 2977.68 and TP2 at 3200.
Happy trading and stick with smart money attitude

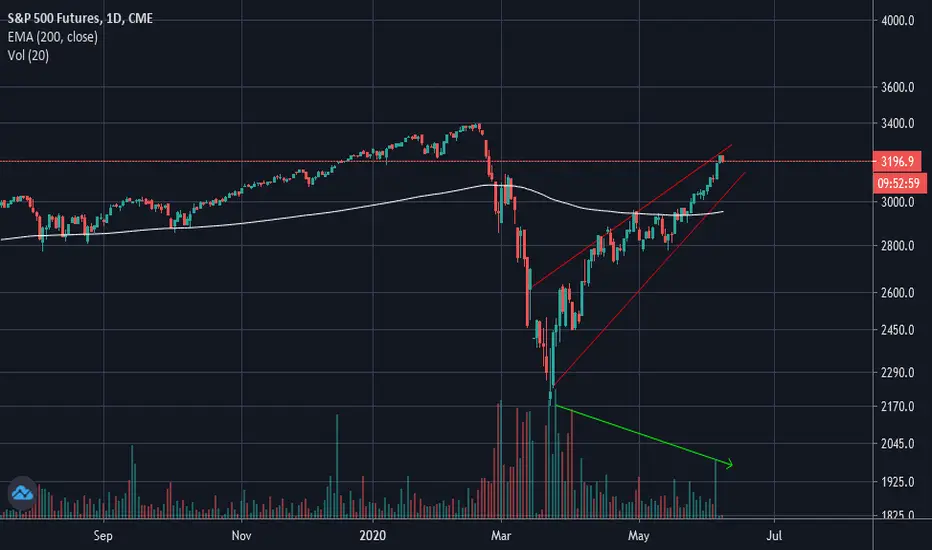
S&P Futures Have Backtested the Rising Bearish Wedge AgainAs noted at the last retest, the S&P e-mini futures have backtested and failed to retake the bottom channel of the rising bearish wedge that developed from the March lows. Some day this century or in the next, we coiuld see a rapid fall in the market.

#SPX - One high came finally #spx500usd #S&P500A high with a break of the 2,830 mark came after all.
61.8er return was not reached so far.
Encircled red A = Encircled red B
RSI is turning down.
EWO also decreases.
CRV = 5.5 to 1 for 36 days is very good.

S&P500 deep dive (Part 2)Very nice rising wedge forming at the daily chart with incredibly high probability to break down this week.