S&P 500 E-mini FuturesWhich of the three scenarios, in the end, will draw the S&P 500 E-mini Futures?
Sp500future

SP500 & Coronavirus - Sell 29/01/2020Friends, please before reading, support this idea with your Like and any Comment, thanks.
You can sell SP 500 AUDNZD from 3290-3300
Stop-loss at 3340
You will find more trading ideas in SAV Finance community.

#S&P500, Time to sell?The S & P500 is on the rise.
At the moment our sell signal is about the price correction and not about a new trend.
The Stochastic Daily Graph is located in the top third which is a great area to sell.
The RSI is in the 70 area which is Overbought and it is a good time to sell.
Target: $ 3260

SP 500 - Big Sale 13.01.2020Friends, please before reading, support this idea with your Like and any Comment, thanks.
You can take short sale SP 500 from 3275-3300
Stop-loss 3400
You will find more trading ideas in SAV Finance community.
Good luck!

SP500 road to 4500$Most of the expert traders are arguing on the US economy to collapse, however, the charts itself show that the price has always taken a swing after the economy rest.
I may be wrong but as a technical trader, the price is at an important 1.618 level.

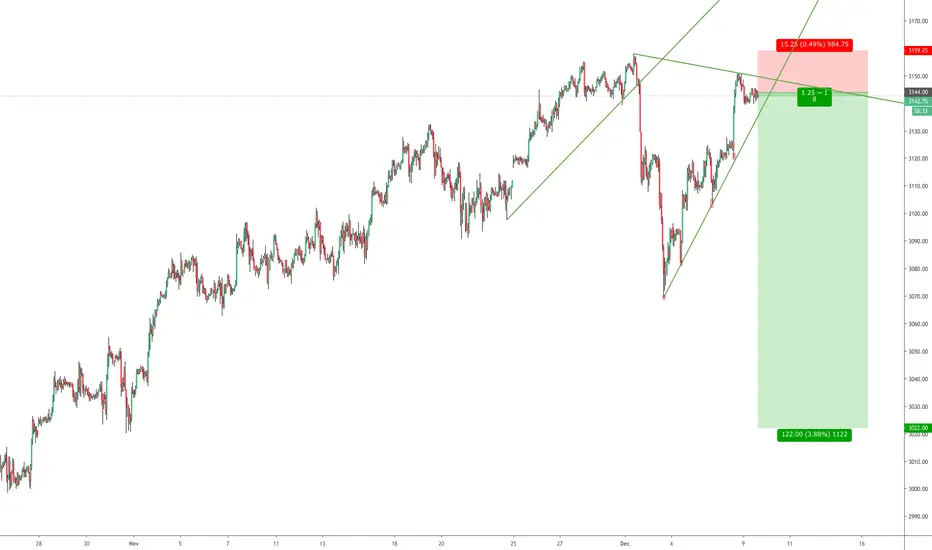
F_ES Short Setup. 1:8 Risk to rewardI know this sounds crazy. 1:8 Risk to reward? Winning probability of this trade is less than 25% maybe less. However x8 sounds crazy and i would like to take this trade. I have shorted 4 micro contracts.i will update this this post accordingly.
Disclaimer: This is not financial or investment advice
Trade safe
Atilla Yurtseven

S&P 500 e-mini futures. Buy opportunities at new demand levelsHow to trade S&P 500 e-mini futures using supply and demand imbalances. S&P 500 e-mini futures? S&P500 futures has broken all time highs ever again and it is offering new buy trade opportunities with long term weekly demand level around 2950 in control.
No shorts are allowed, only longs at new levels of demand. If you are trading other trading strategies or even options, you can use this S&P500 e-mini futures analysis as an extra point to support your longs. We do not use any kind of indicators, we do not need indicators to plan a trade on S&P500 e-mini futures using supply and demand imbalances but if you use them, this longer term technical using supply and demand imbalances can definitely help you.

SP500 has an outstanding gap above the key Resistance level !!Hi, Traders ! Monfex is on the air !
The S&P 500 set a new all-time high of 3,079 as of 4'Nov2019 having opened up with a gap above the key resistance level.
* S&P 500 continues to set records as risk appetite of some traders and the overall confidence in stock market are both rising.
* However, one should become really cautious of going Long at these levels since SP futures may likely hit the reversal point at around 3,100 level.
* Hence, looking at the market setting new records, this could be a relevant time to start reducing allocations to stocks and temporary sit out in cash until we see the correction to the EMA 200.
* Moreover, a gap that appeared on the 4th of November lies above the long-term trend channel and could as well indicate an ultimate phase of the market euphoria that presages the upcoming correction to the area of 2,900.
Pending trade signal
Sell @ 3,100.
Target: 2,920.
Stop-loss: 3,130.
Watch for our Updates to get real-time superior signals!
GOOD LUCK AND LOTS OF PROFITS !!
Disclaimer
This report is for information purposes only and should not be considered a solicitation to buy or sell any cryptocurrency or cryptocurrency product. Monfex accepts no responsibility for any consequences resulting from the use of this material. Any person acting on this trade idea does so entirely at their own risk.

#SP500, Great movement on the way? Serious resistance at $ 3030 that succeeded in 3 attempts.
At the moment in H4, a double top template was created
Stochastic at maximum level with the intersection of lines.
For all of the above reasons, we recommend a sell trade with a target of 2940 and a target can grow as the SP progress.

S&P 500 1D E-MINI FUTURES ASCENDING TRIANGLE LONG TRADEAscending Triangle is a repeatable trading chart patterns.
Ascending chart pattern will have a directional bias depending on the previous incoming trend.
Each chart pattern will have defining trendlines of the support/resistance levels creating the pattern.
What ever time frame you are trading this chart pattern, wait for a candle close outside of the trendline in the direction of the breakout candle. (Our time frame preference is the Daily chart).
Add volume indicator - Volume is the amount of $ that went into a particular candle or in Forex the # of trades that took place.
Add ATR indicator - Volatility is the amount of price movement that occurred. Use the ATR to measure the price movement.
When you see descending Volume bars and descending ATR line (which indicates volatility) this shows
a dis-interest in traders to invest in this pair creating consolidation which creates the chart pattern.
Trade Management after there is a breakout candle close.
1 - Position size (compare volume bar to volume ma line).
a - Breakout candle must be 100% of average volume for a full position size.
b - If 75% of average volume then ½ position size. (To find 75% of Volume
look at the charts volume settings – divide smaller # into larger # = 75%+)
2 - Enter two trades.
3 - SL for both trades will be 1.5 x ATR.
4 - 1st trade TP will be 1 x ATR.
5 - No TP on 2nd trade – letting profit run and adjusting SL to follow price.
6 - When 1st TP hit – move 2nd trade SL to breakeven.
7 - Adjust the 2nd trade SL to follow price.
*8 – After Breakout candle – if price closes back into chart pattern close trade
*9 - When breakout candle is more than 1 ATR from breakout candle open.
a - Enter 1st trade at candle close with ½ position size.
b - Enter 2nd trade with a pending limit order that is 1 ATR of breakout candle open.
c – Price should pullback to that pending limit order for 2nd trade.
d – If Price returns back into chart pattern close trade before SL is hit.


Possible upside target for S&P 500We broke above balance - and if we double the range we can get to around 3050 and still hold the upper range ot the megaphone

SP 500, best entry place, Risk/Reward 1 to 6.In this video, you will learn where is better to open accurate entry with potential profit in 6 times bigger than a risk.

S&P 500 E-mini Futures Weekly Closing ProbabilitiesHere's the results from my statistical analysis for S&P 500 E-mini Futures on the weekly chart.
S&P 500 E-MINI STATISTICAL RESULTS
DATES:
02 Sep 19 / 06 Sep 19
CLOSING BETWEEN (at 06 Sep 19):
2877 - 2933: 75% Probability
2849 - 2960: 93% Probability
2821 - 2989: 98% Probability
P.S. This indicator is not for sale and will not be published.
DISCLAIMER: This is not financial advice
Trade safe,
Atilla

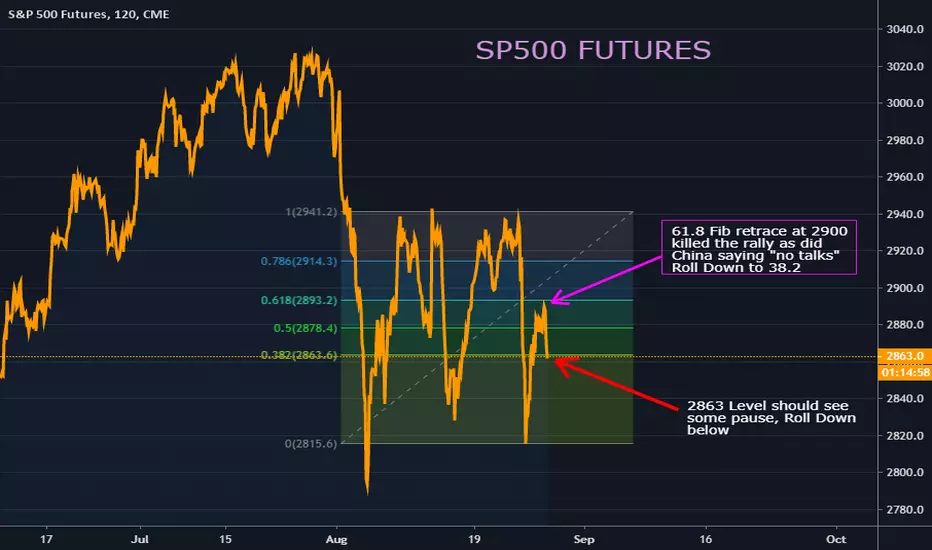
SP500 Trades between fibsSP500 attacked the 2900 level in Sep Futures to only be thwarted by the 61.8% retrace as well as China saying "no talks"
Expect 2863 to be big bear hurdle here and roll down below, if hold risk is back to 2900
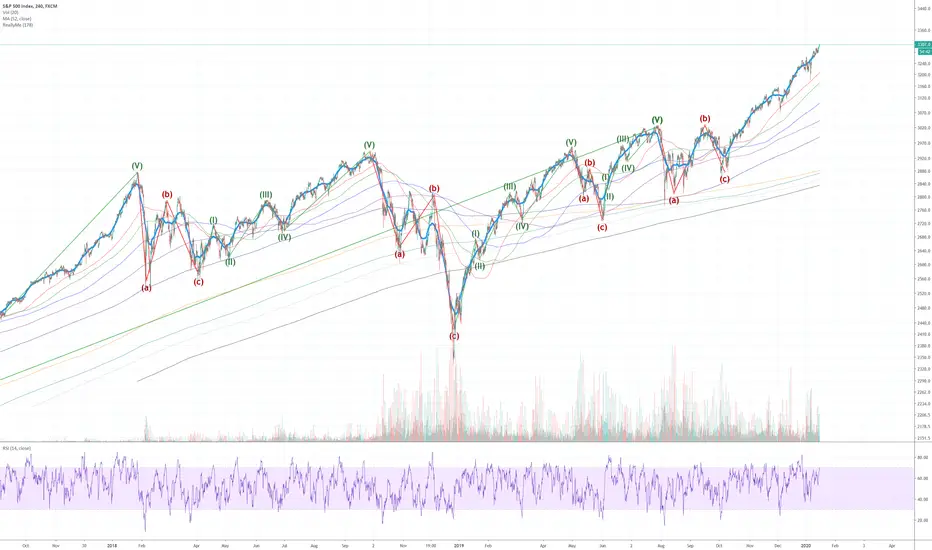
Bear Trap. SP500 to new high's! Because we all have a historical pullback to study this pullback against- I feel the majority bias is short. The majority cant trade in the correct direction 100% of the time. That would mean the majority of traders would be profitable. Instead it is a minority that is profitable. The flip side to what everyones thinks is the downside is what follows. This is by no means financial advice- just what we could see come Monday. We will have some brief turbulence, than feel the euphoria of a wave 5, that could be overextended if It wants to really break through the clouds. Everybody is short- I am long. Simple as that.

S&P 500: Don't Be Fooled By the BounceWhile earlier this week we all saw quite the large sell-off, only to be in an equal amount of awe regarding the rebound.
In my opinion this is a rebound pushed further by algo's and robo traders. Do we go higher? We could but it doesn't matter. The market will sell-off very hard sometime in late 2019 or early 2020.
Why?
Quantitative easing around the world is going back to 0.
Yields are going negative around the world.
Canadian/American Yields will be near 0 before 2021.
Economic numbers are dwindling.
Manufacturing has tumbled.
Record level of governmental and consumer debit/deficits.
Federal Reserve and ECB will panic with respect to the sell-off coming and will drop rates too quickly, resulting in an inflationary recession.
Monstrous currency devaluation all across the world.
Fiat currency will decrease in value significantly through 2020-2021 and beyond, years.
You must also ask yourself ..if the market and economy was as good as people on TV (including Trump and Kudlow) say, why is Gold and Silver on the verge of a epic and historic run? The answer: the market is being manipulated to trick people and a bear market is coming soon and fast. People have been buying to swing trade and short - NOT to go long.
I am targeting December lows again, ironically, by near December or January.
BE CAUTIOUS WHEN TRADING.
- zSplit

S&P500 Short Trade *TL BREAK AND RETEST*SP500 Short Trade
TL Break and Retest
Lower High
Daily Bearish Candle Closure

ES1! S&P 500 Futures 15m Long Play SPY15 Minute:
5-3 Elliot Cycle completion completing within a horizontal channel.
Start of Wave 1?
RSI > 50
Entry on a clean break above resistance line. Target the height of channel.
SL zone shown
*Not Financial Advice*

SPX500 // Outlook // June 2019$SP500
Mid // Longterm Outlook
Bearish Momemtum continues within the stock market // Indices.
We are looking for the scenario below to occur within the Mid to Longterm for the SP500.
Confluence within this area being //
- 0.5 Fib retracement via our entire Rally
- Daily Demand
- 200 EMA Support
I will be a short term bull once we enter the 2635 range. Short term bull via stocks and indices // Until then we will be looking shorts next week.

SPX has gone to far on fake.SPX has gone to far on fake in decreasing economy outlook 2019
1) No rate cut FED
2) Economic war ongoing China/Iran
3) Overbounght D1-H4
5) Asian markets and Europe are still not following
6) Goldprise rising.
I expect sonn a hard 3-4 day drop.
Targets are first to erase the huge raise in the last weeks since June 2019.
