Big Short On SPX500 According to the US30 analysis, the price of spx500 can also have a down trend in the long term
Sp500future

SP500 - SHORT SETUPOn daily timeframe, we have a last pump wich show us the level of distribution area, nothing bullish undeer 4200.
If the daily candle will close under 4.160, i will enter short

ES Overnight Breakdown Continuation?Will ES continue to break down the main channel support? If we do not hold 4150, I believe we will see a much needed cool off and a main channel retest around ~4120.
I played a short overnight for 20 points for a measured move of yesterdays leg. I believe we will see a small bounce to retest the uptrend, then see continuation down to the main channel as we have lost a bit of steam.

S&P 500 Futures Set-UpPut Option' Premiums are cheap compared to the chance of having a pullback.
RSI in overbought ranges.
Volume has been decreasing for the last weeks.
Entry Level: 4130
Stop Loss set at 4220 .
First Take Profit at 4050 . Second Take Profit at 3980 .
*Important to pay attention to the price action at the level of 4050. If it is recovered quickly, it will be bullish.
Consider moving the stop loss closer to the breakeven point if that happens.
Priority Number One: Survive in the market.

S&P 500 Index Analyze !!!S&P 500 has been moving on Ascending Channel for about 12 years😱. S&P 500 had an Impulse wave with an Extended 3rd Wave . When wave 3 is extended , we can use from Elliott Wave Fibonacci Retracement and Extension Guidelines of extended waves :
🔅 If wave 3 is extended , waves 1 and 5 are often nearly equal in magnitude and duration.= This guideline is running correctly on my chart✅ = The end of the main wave 5 (Zone): 4505 until 4182
🔅If wave 3 is extended , then wave 4 often ends at the level of sub-wave 4 of 3 and is quite shallow (retraces 23.6% – 38.2% of wave 3). This guideline is running correctly on my chart✅
🔴 Heavy Resistance Zone : 5817 until 5348 .
S&P 500 Index Analyze Timeframe 2 Weeks ( Log Scale )
❗️ Note ❗️: I expect that S&P 500 would go down at least until the middle line of ascending Channel .
Do not forget to put Stop loss for your positions (For every position you want to open).
Please follow your strategy , this is just my idea, and I will be glad to see your ideas in this post.
Please do not forget the ✅' like '✅ button 🙏😊 & Share it with your friends; thanks, and Trade safe.

My today's view on SP500 - FutureHi Traders,
This is my view for today on ES
Micro and Macro structure are both aligned. There’re few zone I’ll wait for the price to test:
- 4025 for a short
- 4080/90 for a short, as well
- 3960 for a long (but I need a strong confirmation)
Pit, Trading Kitchen
DISCLAIMER:
Trading activity is very dangerous. All the contents, suggestions, strategies, videos, images, trade setups and forecast, everything you see on this website and are the result of my personal evaluations and was created for educational purposes only and not as an incentive to invest. Do not consider them as financial advice.


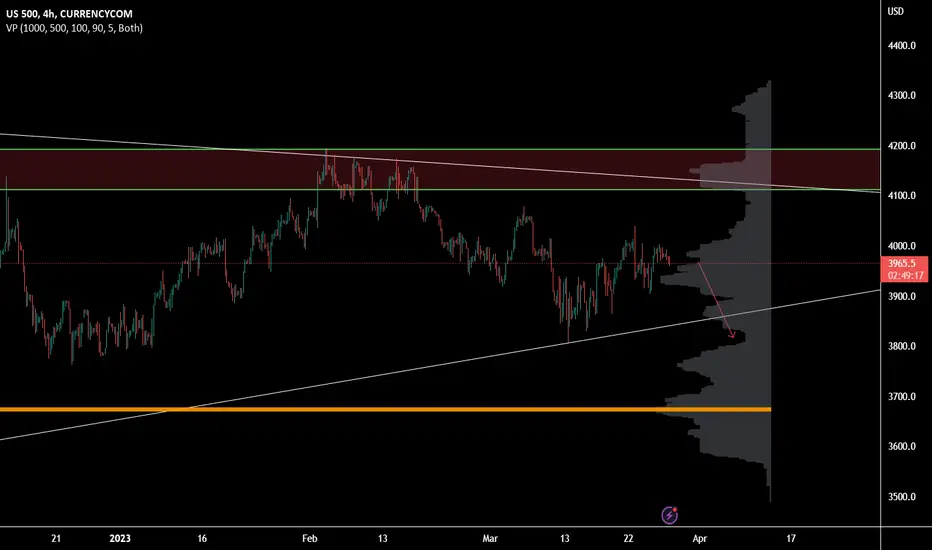
US500 Trading in a triangleHello Traders,
on higher timeframes CURRENCYCOM:US500 is trading on a triangle. For the moment we don't know where will be a breakout so we're trading inside of it.
Next target probably the 3850 level.
BOOK of SAMUEL: DAVID V GOLIATHWow! This is a first for me, in such a large timeframe. Looking at both patterns forming. The larger head & shoulders pattern may take precedence, as it is generally considered to be a more significant pattern. If the H&S pattern is confirmed, it would suggest that the uptrend is ending and that a downtrend may be beginning. However, if the Inverted H&S pattern is also confirmed, it could indicate that the trend is changing and that an uptrend is beginning.

My today's view on SPX500 FutureHi Traders,
This is my view for today on ES
Ok, the micro-structure. Is aligned to the macro one from are 4050. There is one more GAP to fill around 4080 area.
Today’s target is 4090 and could be reached directly during London Session or (better to me) by a liquidity grab from 4057 or Asian Session High Level.
Pit, Trading Kitchen
DISCLAIMER:
Trading activity is very dangerous. All the contents, suggestions, strategies, videos, images, trade setups and forecast, everything you see on this website and are the result of my personal evaluations and was created for educational purposes only and not as an incentive to invest. Do not consider them as financial advice.
———————————

TRADE UPDATE: TARGET REACHED - SP500Our short term trade paid off nicely even though it took 5 days.
The price headed to our target price of 4,008.
We now need to bank our profits and move on to the next trade.
Now we have a gap that is still to fill and we have orders to still fill on the daily (Fair Value Gap).
But I'll let you know!

My today's view on SP500 FutureHi Traders,
This is my view for today on ES
In terms of Structures and Technical Analysis, everything is BEARISH, next target is 3838, honestly I don’t think will be touched directly during today’s session. A possible manipulation around 4000 level key zone during US opening could bring market to the target.
Pit, Trading Kitchen
DISCLAIMER:
Trading activity is very dangerous. All the contents, suggestions, strategies, videos, images, trade setups and forecast, everything you see on this website and are the result of my personal evaluations and was created for educational purposes only and not as an incentive to invest. Do not consider them as financial advice.
———————————

SMC SPX500 Price might go up but I'm looking for shorts onlyWe are looking at the SP500 on 15 minute time frame.
we see two Dotted lines -
Green - Daily High of the previous day
Red - Daily LOW of the previous day
The daily trend is DOWN - so Daily Bias is look for shorts.
The first hour, the market came down and formed a new low before we had a break of structure to the upside. This forms what's known as Sell Side LIquidity - Order Block.
WHy? Because Smart Money goes down and sweeps liquidity where they buy into the market for the day.
Next we can expect the prices to move up then retrace BACK into the LIquidity zone. Once this happens EITHER the market will move up for the rest of the day where intraday traders will go long.
Or it will break below and form lower lows forming Buy side Liquidity (stopping buyers out).
We ONLY will short the market because Daily Bias is bearish... So even if the market goes up, there will be no trade.
If Buy Side Liquidity Order Block Forms we will have a trade to go short.
I'll be waiting - what are your thoughts?

My Today's view on SPX500 FutureHi Traders,
This is my view for today on ES
Macro and Micro strutture are both BEARISH and aligned. 3902 recent structure has been broken, which is why we must continue to believe that the recent low at 3880 is the next target.
There is too much liquidity above Friday's high, which I think can be touched before we go towards target.
Personally the most likely scenario is a manipulation at 4020.
Pit, Trading Kitchen
DISCLAIMER:
Trading activity is very dangerous. All the contents, suggestions, strategies, videos, images, trade setups and forecast, everything you see on this website and are the result of my personal evaluations and was created for educational purposes only and not as an incentive to invest. Do not consider them as financial advice.
———————————

SP500 BREAKDOWN ANALYSISdear traders
sp500 in this case trying to correct the big move i see if he break above 3877.9 you should take a long trade target will be at 40.11.00
trade safe

My todays' view on SPX500 futureHi Traders,
This is my view for today on ES
Micro and macro structure are aligned. Next target will be 3900 and can be reached immediately after a manipulation around Asian Session High or with a retest on 4000 level on a strong SUPPLY zone. (I’ll personally wait for this retest to go short).
Pit, Trading Kitchen
DISCLAIMER:
Trading activity is very dangerous. All the contents, suggestions, strategies, videos, images, trade setups and forecast, everything you see on this website and are the result of my personal evaluations and was created for educational purposes only and not as an incentive to invest. Do not consider them as financial advice.
———————————

My today's view on SP500 futureHi Traders,
This is my view for today on ES
Strong bearish impulse started from 4080 level let me think price will retest 4060 level which is 75%… This is the micro structure.
The higher one’s had been broken at 4026. Fair Value Gap ate 3955 which is today’s target. We’re ranging, No short below 3920, no longs above 4100.
Pit, Trading Kitchen
DISCLAIMER:
Trading activity is very dangerous. All the contents, suggestions, strategies, videos, images, trade setups and forecast, everything you see on this website and are the result of my personal evaluations and was created for educational purposes only and not as an incentive to invest. Do not consider them as financial advice.
———————————

SP500 SELLeace, mercy and blessings of God be upon you. The triangle has been successfully broken, and the uptrend, the market is in a downtrend.

A Leading Indicator for US EconomyCME: E-Mini S&P Retail Select Industry Futures ( CME:SXR1! )
Last Friday, the U.S. Bureau of Economic Analysis (BEA) released the latest Personal Income and Outlays Report. Personal income gained $131.1 billion (0.6%). Disposable personal income (DPI) added $387.4 billion (2.0%) and personal consumption expenditures (PCE) grew $312.5 billion (1.8%) for the month of January.
Data shows that U.S consumer is resilient. Wage gains and inflation pushed spending growth to a two-year high. In the past decade, PCE gained 60% to $18 trillion. More recently, it surged 50% in the three years since the start of the COVID pandemic.
The hotter-than-expected data indicated that US economy was nowhere near a recession. Additional data from the Bureau of Labor Statistics showed robust job growth in January and the lowest unemployment rate in half a century.
Wary of bigger and longer-lasting Fed rate hikes on the way, all major US stock indexes turned negative in the month of February. As of last Friday, Dow Jones Industrial Average was down 3.8% month-to-date, while S&P 500, Nasdaq 100 and Russell 2000 recorded -2.6%, -0.8%, and -2.4%, respectively.
Consumer Spending Outlook
Consumer spending accounts for over two-thirds of U.S. economic activity. While PCE shot up more than expected last month, it is a lagging indicator and only confirms what happened in the past. Could U.S. consumers spend out of the peril of a recession?
Retailer stock prices are forward-looking and reflect collective market consensus of how much free cash flow the retailers could earn, discounted by their cost of capital. There are indications that the shopping spree may be ending soon.
Last week, Walmart said its U.S. consumer spending started the year strong, but that it expects households to back off through the year, producing weak fiscal-year U.S. sales growth of 2% to 2.5%. Home Depot said consumer spending is holding up, but that it expects a flat sales-growth year overall, with declining profits.
This is a troubling signal. Retailers are supposed to benefit the most from growing consumer spending, but their stock prices have been losing steam in February. As of Friday, Home Depot ( NYSE:HD ) has a year-to-date return of -6.1%, while Walmart ( NYSE:WMT ) is mostly flat (-0.8%). Other retailers with declining stock prices include Dollar General ( NYSE:DG ), -13.2%; Walgreens Boots Alliance ( NASDAQ:WBA ), -3.7%, and Casey’s General Stores ( NASDAQ:CASY ), -3.8%.
Walmart reported Q4 and FY2023 (ending January) revenue growth of 7.3% and 6.7%, respectively. Its operating income fell 5.5% and 21.9%, for the same periods. Digging deeper into Walmart’s earnings release, I find that it keeps sales growing by expanding its grocery business, but those sales are less profitable than general merchandise categories, where consumer spending is leveling off or shrinking.
In theory, the growth of the biggest US retailer could be attributed to one of the following:
• General growth of consumer spending (economic expansion);
• Good business strategy and market share growth (economic trend unknown);
• Consumer downgrades spending from department stores (economic downturn);
• Price increases (inflation).
My interpretation:
1. Consumers tend to keep up with the same living standards. When inflation hits, they maintain the same purchasing habit. Higher price drives spending growth.
2. As inflation deepens, consumers get fewer merchandises with the same budget.
3. Consumers downgrade purchases from department stores to discount stores, and switch to generic products from brand-named products.
4. In a downturn, higher-ended stores get hit first, and discount stores get hit last.
While Walmart manages to grow revenue by doubling down on grocery and online businesses, the weakness in general merchandizes uncovers the real trend of consumer spending leveling off. We may disagree on whether a recession will be coming, however, data from Walmart and Home Depot indicates that the U.S. retail sector is in trouble.
S&P Retail Select Industry Index
S&P Retail Select Industry Index may be a better benchmark for the U.S. retail sector, comparing to the lagging government data and company specified performance metrics.
The index comprises of stocks in the S&P Total Market Index that are classified in the GICS retail sub-industry. Total-10 constituents by index weight are:
• Carvana (CVNA)
• Wayfair (W)
• Sally Beauty (SBH)
• Stitch Fix (SFIX)
• Boot Barn (BARN)
• Children’s Place (PLCE)
• Qurate Retail (QRTEA)
• Leslie (LESL)
• EVgo (EV)
• Abercrombie & Fitch (ANF)
One-year chart above shows that CME E-Mini S&P Retail Select Industry (SXR) Futures tracks the trend of S&P 500 but illustrates higher volatility in the first two months of 2023.
Each SXR contract is notional at $10 times the index. At Friday settlement price of 7004, one March contract (SXRH3) is valued at $70,040. Each futures contract (long and short) requires an initial margin of $5,700. When the underlying index moves 1 point, trader’s futures account would gain or lose $10.
At present, I do not foresee a decisive trend of the S&P 500. It could trend up, go down or move sideways depending on how the Fed rate hikes, inflation, unemployment and geopolitical crises play out.
However, this does not prevent me from expressing a bearish view on the US retail sector. Establishing a SXR short futures position would be appropriate in the negative outlook.
Happy Trading.
Disclaimers
*Trade ideas cited above are for illustration only, as an integral part of a case study to demonstrate the fundamental concepts in risk management under the market scenarios being discussed. They shall not be construed as investment recommendations or advice. Nor are they used to promote any specific products, or services.
CME Real-time Market Data help identify trade set-ups and express my market views. If you have futures in your trading portfolio, check out on CME Group data plans in TradingView that suit your trading needs www.tradingview.com

Painful scenario sp500 spy spx What if this move is just setting up for a run to 4323 range?
If we could end up in that range somewhere between late March on the early side to end of May on the late side.
Then increase the negative narratives with inflation/interest rates/further housing market crash/war etc. to send us into market crash by Q3 we could then see this thing ran all the way back down to 3323 within 12-18 months.
IF you get something like that. AND you're BUYING at that point and not beaten up /exhausted/liquidated etc. i TRULY think you'll be buying a generational bottom.
ALWAYS have more powder. You never know what these markets might do.

SPX500USD YASSINEIØS M15 GOOD LUCK 🩸Please respect the analysis. Today is a beautiful day, a golden opportunity. Just a little patience and diligence, we will be the best Happy holiday Any questions about the transaction are welcome YASSINEIØS&

SP500A wonderful investment opportunity to buy the SP500 with the breach of the side channel shown in the analysis, as well as the breach of the bearish trend and a positive candle indicating that buyers entered the market in a positive way. Please be patient with the deal. Good profits. My friends, traders.

S&P 500: Two Pattern to Trade in short termHi everyone!
The trend is bullish on S&P 500 (Futures), and if we try to follow US Index on intraday chart, we have two important levels: 4,189.75 and 4,098.50. Potential resistance breakout should develop a harmonic structure with Target around 4,238.50, conversely, 4,098.50 failure should trigger bearish consolidation around 4,048.00 area. Technically, both setups are high risk, so using a small size should be a good choice.
...trade with care! 👍
If you think that my analysis is useful, please...
"Like, Share and Comment" ...thank you! 💖
Cheers!
