SP500: Is This the 2025 Correction? Or Just Another Bounce?Looking at the weekly chart of the S&P 500 with RSI and key support trendlines, it’s clear we’ve entered a historically important level.
🔍 Context:
2020 → COVID Crash, RSI bottomed 💥
2022 → Bear Market, RSI again flagged a major drop 📉
2023 → Healthy correction, price respected trendline support
2025? → RSI flashing oversold, price testing the long-term trendline again.
📊 RSI is approaching the same low levels as the previous two macro shocks — is this a signal of another reversal opportunity? Or could this time be different?
🚨 If we break below this trendline convincingly, it could open the door for a deeper bear leg. But if we hold, we might just see another bounce-back rally like in 2020 and 2022.
📈 Watch for confirmation:
A strong bounce with bullish RSI divergence = potential long
Breakdown + volume spike = more downside ahead
Let’s see if the trendline holds up — it has for 5 years… 👀
#SP500 #Correction #BearMarket #RSI #TechnicalAnalysis #MarketUpdate #2025Outlook #StockMarketIdeas
Sp500index

WHY EVERYTHING IS GOING DOWN? ANSWER IS HERE!Understanding the Simultaneous Decline in EVERYTHING!
1. The Influence of U.S. Treasury Yields and Interest Rates
The U.S. 10-year Treasury bond yield is a major benchmark in global finance. When yields rise, it signifies that bonds are becoming more attractive relative to riskier assets. Rising yields typically occur when:
Investor Demand Shifts: Investors move from risky assets (like equities or crypto) to safer, higher-yielding government bonds.
Inflation Expectations: Higher inflation expectations often lead investors to demand higher yields, which in turn increases borrowing costs.
Cause and Effect:
When Treasury yields increase, the opportunity cost of holding lower-yielding assets rises. This makes stocks, precious metals like gold, and speculative assets like cryptocurrencies less attractive. Even gold, typically seen as a safe haven, can lose its charm if fixed-income assets provide competitive returns with significantly lower risk.
2. M2 Money Supply Dynamics
The M2 money supply measures the total liquidity available in the economy, including cash, checking deposits, and easily convertible near-money assets. Changes in M2 can impact asset prices in several ways:
Expanding M2: More liquidity in the market initially can boost asset prices. However, if this expansion leads to rising inflation, it may eventually trigger higher interest rates and bond yields.
Contraction or Slowing Growth in M2: A tightening in liquidity can reduce the flow of money into various asset classes. This dampens overall market sentiment and makes riskier assets less attractive.
Cause and Effect:
If M2 growth slows or contracts, there is less capital to chase after higher returns in equities and crypto. At the same time, if there is an expectation of tightening monetary policy, investors recalibrate risk expectations, which leads to a broader sell-off across multiple asset classes.
3. Investor Sentiment and Risk-Off Behavior
In periods where both Treasury yields are rising and the money supply signals less liquidity, the overall investor sentiment often shifts toward a "risk-off" stance. This means:
Safe-Haven Demand: Investors move into safe assets like government bonds, which drives up bond prices and yields while pulling money out of riskier assets such as stocks, gold, and cryptocurrencies.
Correlation Effect: As riskier assets are sold off, their prices fall in tandem. Therefore, even if gold typically acts as a counterweight to stocks, in a severe risk-off environment, all asset classes might decline.
Cause and Effect:
With a risk-off sentiment dominating the market, traditional safe havens (like gold) and growth-oriented assets (stocks and crypto) can experience simultaneous declines. Rising yields encourage a rotation away from these riskier positions, which reinforces the downward trend across multiple markets.
4. Historical Context: The Trump Era and Beyond
During the Trump administration, we observed episodes where Treasury bond prices surged significantly (e.g., a 10% surge) as investors sought refuge during periods of political and economic uncertainty. Eventually, as market sentiment shifted, yields rose, and this led to higher borrowing costs. The resulting effect was a broad-based retreat in many asset classes.
Example: In those periods, as yields climbed to around 4%, investor appetite for risk diminished. The market corrected across equities, precious metals, and cryptocurrencies, with all asset classes experiencing pressure concurrently.
Cause and Effect:
In the current climate, if similar dynamics are at work—namely, rising yields accompanied by tightening M2 growth—then we might see a similar pattern: gold, the S&P 500, and crypto all experience declines together because investor risk appetite is sharply reduced.
Conclusion
The simultaneous decline in gold, the S&P 500, and cryptocurrencies can primarily be attributed to rising U.S. Treasury yields and tightening M2 money supply. As yields rise:
The relative attractiveness of low-risk government bonds improves, encouraging a shift in investment away from riskier assets.
Increased yields raise borrowing costs, which in turn dampens economic growth and investor sentiment.
Slowing liquidity (as measured by M2) further restricts the available capital chasing after higher returns.
This confluence of factors leads to a widespread "risk-off" environment where even traditional safe havens like gold may fall as the entire market adjusts to a higher interest rate and lower liquidity backdrop. Investors thus move across asset classes in a coordinated fashion, leading to declines in gold, equities, and crypto alike.
Understanding this cause-and-effect relationship is crucial for professional traders who rely on disciplined strategies. With a clear view of the broader economic signals, you can navigate these shifts with precision—helping you not only to avoid costly mistakes but also to capitalize on high-probability opportunities that emerge during these market transitions.

The S&P 500 Has Officially Entered a Bear MarketThe technical definition is simple:
✅ A decline of 20% or more from recent all-time highs.
That’s exactly where we are.
🔻 The S&P 500 has been free-falling and just hit that 20% mark.
🔴 The index is on pace to close the day deep in red — confirming what many feared:
We are in a bear market.
👀 What does this mean?
Expect continued volatility, emotional markets, and high sensitivity to macroeconomic news.
Historically, bear markets can last from a few months to over a year, depending on policy response and investor sentiment.
While painful, bear markets often plant the seeds of the next bull run 🌱 — but that doesn’t mean we’re there yet.
🧠 Time to zoom out, stay informed, and trade with caution. Capital preservation becomes just as important as returns.
What’s your strategy during bear markets? Averaging down? Hedging? Sitting in cash?
#SP500 #BearMarket #StockMarketCrash #TradingStrategy #MarketUpdate #InvestSmart

Is This a Bear Market or a Golden Opportunity?The indices have plummeted sharply, and whether you believe this is due to Trump’s tariffs or would have happened anyway, regardless of the trigger, the reality remains the same.
Both the S&P 500 and Nasdaq 100 are officially in bear market territory— defined by a decline of more than 20% from their peaks . Meanwhile, the Dow Jones Industrial Average is down approximately 15%.
Given these facts, the big question is: Are we in a bear market, or is this a fantastic buying opportunity? 📉📈
Now, let's break down the key levels, potential scenarios, and how to approach the current market environment. 🚀
Dow Jones 30 (DJI): Navigating Key Support and Resistance Levels
On the weekly chart, DJI has been in an uptrend since the pandemic lows of 2020. The double top formation from 45k measured target has already been exceeded, and the index is now approaching a critical confluence support zone between 37k and 37,700.
📌 My Outlook:
• I believe this support will hold in the near future, presenting a buying opportunity.
• Resistances: 40k and 41,600 are important technical levels and potential targets for bulls.
💡 Alternative Scenario:
• If DJI starts rising without testing the long-term confluence support, I will focus on selling opportunities, particularly around the 41,500 zone, as we have 2 unfilled gaps from last week.
________________________________________
S&P 500 (SPX): Bear Market Territory, But Still Holding Uptrend (posted main chart)
According to classical theory, SPX is now officially in bear market territory. However, we are still above the ascending trend line established from the 2020 pandemic low, and approaching a confluence support zone around 4,820 - 4,900.
📌 My Outlook:
• I will be looking for buying opportunities if the index continues its decline towards the 4,820 - 4,900 zone next week.
• Target: Filling the first gap at 5,400.
💡 Alternative Scenario:
• If the week begins positively, and SPX doesn’t reach the 4,900 support zone, I will focus on shorting opportunities on gap filling, aiming for a return to 5,000.
________________________________________
Nasdaq 100 (Nas100): Hovering Above Key Support
Unlike DJI and SPX, Nas100 is still well above the ascending trend line from the 2020 pandemic low. However, it is nearing an important horizontal support defined by the 2021 ATH and the 2024 lows.
📌 My Outlook:
• Drops towards 17k or slightly lower could present good buying opportunities, anticipating a potential rise to fill the gaps.
💡 Alternative Scenario:
• If the price rises above 18.500k zone without dipping under 17k I will look for selling opportunities.
Disclosure: I am part of Trade Nation's Influencer program and receive a monthly fee for using their TradingView charts in my analyses and educational articles.

SP500- Don't be fooled by yesterday's pumpThe markets reacted strongly to Jerome Powell's latest commentary, sparking a notable rally. However, traders should be cautious before assuming this marks the beginning of a new uptrend. While there has been a slight shift in market structure, the broader trend remains intact. Overlooking the strength of the next resistance level could prove to be a costly mistake.
The Big Picture: S&P 500 Daily Chart Analysis
Examining the TRADENATION:US500 posted daily chart, the key question is: has the trend truly reversed? While a green-bodied candle signals some bullish momentum, SP500 remains below critical resistance levels. Notably, it closed beneath what I call the "Do or Die" zone—an area that aligns with prior lows and, more importantly, the daily 200 SMA. This suggests that what we’re seeing could be a lower high forming within the broader downtrend.
Hourly Outlook:
On the hourly chart, we see a strong reversal from 5500, but the move appears corrective rather than impulsive. It seems to be forming an ABC-style correction, with the market currently in wave C. Calculating the potential top of wave C, we find it aligns perfectly with a key resistance level and the 200-day SMA.
Conclusion:
While we may see some upside heading into the end of the week, I believe this rally will be short-lived. Once SP retests the broken support—now acting as resistance—I expect the downward trend to resume, with my target remaining at 5200 (as previously discussed).
Disclosure: I am part of Trade Nation's Influencer program and receive a monthly fee for using their TradingView charts in my analyses and educational articles.

SP500 Plunges 8% in a day!! Oversold or more pain ahead?The SP500 has suffered a massive 8% drop, currently trading around 5158 at the moment, after market turmoil triggered by Trump's new tariff war. Panic selling has pushed the 30-minute RSIto an extreme oversold level of around 28, signaling potential short-term exhaustion.
Possible Scenarios:
🔹 Short-Term Bounce? The RSI suggests a possible technical rebound, with key resistance around 5200-5250 if buyers step in. Watch for volume confirmation.
🔹 Further Downside? If panic continues, the next major support lies at 5100, followed by 5000 psychological level, where institutional buyers might defend price.
⚠️ Caution: Markets remain highly volatile! A dead-cat bounce is possible, but uncertainty surrounding tariffs could fuel more downside pressure. Stay sharp!
📊 What’s Your Take? Will SP500 recover or break lower? Drop your thoughts below! 🚀🔥
#SP500 #StockMarketCrash #Tariffs #Trading #TechnicalAnalysis #RSI

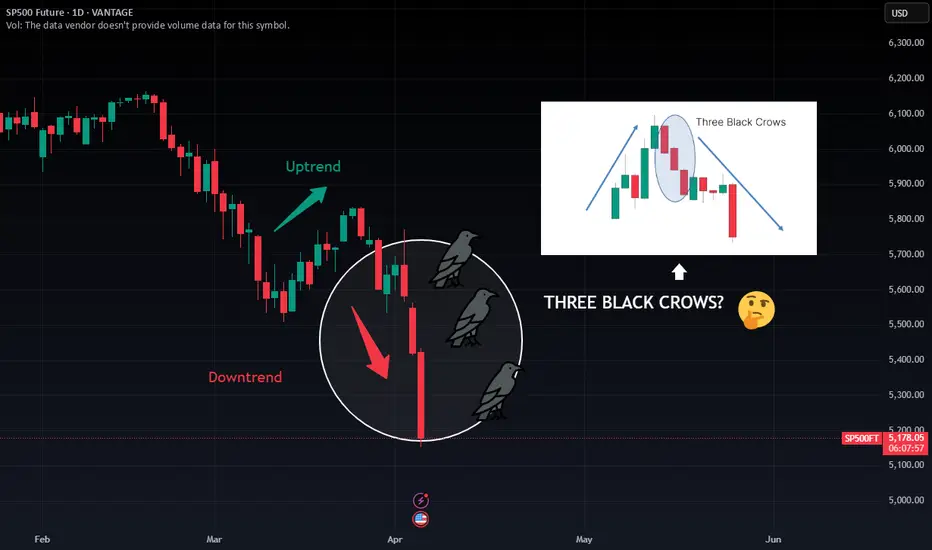
Are These the Three Black Crows Signaling More Pain Ahead? The S&P 500 has just printed three consecutive long-bodied red candles following a brief uptrend. This classic "Three Black Crows" formation could be a powerful bearish reversal signal—one that historically hints at a deeper correction on the horizon.
📊 What does this pattern mean?
Appears after an uptrend or rally.
Consists of 3 bearish candles closing near their lows.
Suggests strong seller control and trend reversal potential.
🔍 Current context:
The S&P is already under heavy pressure from macroeconomic and geopolitical concerns.
This pattern adds further bearish sentiment, especially if we see continued follow-through on volume.
🚨 If confirmed, we could be looking at the continuation of a larger downtrend. But remember: confirmation is key. Watch closely how price reacts in the next 1–2 sessions.
🧠 Do you see this as a real warning—or just a pause before the next leg up?
#SP500 #ThreeBlackCrows #CandlestickPatterns #BearishSignal #TechnicalAnalysis
Let's cover the action of some instruments as we get the NFPLet's see what's happening with the market as we get the NFP number live.
Let's dig in!
MARKETSCOM:DOLLARINDEX
TVC:DXY
TVC:GOLD
FRED:SP500
FX_IDC:EURUSD
MARKETSCOM:EURUSD
Let us know what you think in the comments below.
Thank you.
77.3% of retail investor accounts lose money when trading CFDs with this provider. You should consider whether you understand how CFDs work and whether you can afford to take the high risk of losing your money. Past performance is not necessarily indicative of future results. The value of investments may fall as well as rise and the investor may not get back the amount initially invested. This content is not intended for nor applicable to residents of the UK. Cryptocurrency CFDs and spread bets are restricted in the UK for all retail clients.

Bullish Divergence and the Impact of Trump’s TariffsOn the daily chart of the S&P 500, I’m currently spotting a clear bullish divergence. This type of divergence is a technical pattern that suggests that, despite recent price drops, the downtrend is losing momentum and a potential upward move could be on the horizon. It shows that the index has underlying strength, which the price hasn’t fully reflected yet — making a bullish reversal very likely in the short to mid-term.
In this context, the recent drop in the S&P 500 has been largely driven by Donald Trump’s tariff announcements, especially targeting China and other countries. However, based on my analysis, I believe that these tariffs were more of a negotiation tactic than a long-term economic strategy. And now that things are clearly not going as expected, I’m convinced that Trump will be forced to scale back the tariffs or start accepting less favorable trade agreements just to stop the bleeding — because I highly doubt he will allow this sharp market decline to continue unchecked.
Why tariffs aren’t coherent or beneficial for the global economy
Tariffs are additional taxes on imports. Although they’re often marketed as a way to protect local industries, in reality, they increase prices for consumers and destabilize global supply chains. The result is damaging for both the countries imposing the tariffs and those receiving them. In the case of the U.S., despite Trump’s promises, these tariffs are actually hurting American companies that rely on imported materials and products, leading to higher internal costs and squeezing consumers.
Worse yet, this ongoing trade war has created a climate of global economic uncertainty, which is driving down investment and confidence. That uncertainty has translated into market selloffs around the world, and the S&P 500’s current decline is a direct reflection of that. Importantly, it’s U.S. businesses — not foreign governments — who are absorbing the cost of these tariffs.
What to expect going forward
Despite the pressure from tariffs, I believe that Trump — seeing the damage already being done to the markets — will have no choice but to start dialing things back. My take is that to avoid a deeper economic hit and restore investor confidence, the U.S. will likely pursue more balanced deals, even if it means compromising a bit.
If this scenario plays out, I expect the S&P 500 to begin recovering, especially as investor uncertainty fades. The bullish divergence on the chart further reinforces the idea that once these external political and economic pressures ease, the market could see a strong and sharp rebound.
Conclusion
Trump’s tariffs were intended as leverage — but they’re clearly backfiring and doing more harm than good. The current S&P 500 correction, in my opinion, is actually a buying opportunity for those with a long-term view. With potential tariff reductions and fairer trade deals on the horizon, the market is likely to rebound strongly, especially with the bullish divergence we’re seeing on the charts.
Markets may have already priced in the worst, and now we’re seeing the first technical signals of a potential turnaround. If confirmed, the price could begin to rally significantly in the coming days or weeks.

S&P500: Persistent SupportThe S&P 500 continued its recovery following its reaction to the support at 5509 points. However, in our primary scenario, we expect the index to fall below this mark to ultimately complete wave in green within our color-matched Target Zone (coordinates: 4988 points – 4763 points). Within this range, there are entry opportunities for long positions, which could be hedged with a stop 1% below the Zone’s lower boundary. Once the corrective movement has reached its low, the final upward movement of the green wave structure should commence. In the process, the index should gain significantly and reach the high of wave above the resistance at 6166 points. If this mark is surpassed prematurely, our alternative scenario with a 30% probability will come into play.

VISA:Respecting the 61.8% Fibonacci Level and Going for New HighWho doesn't know VISA? Almost everyone has or has had a VISA card. VISA stock has an unbeatable bullish outlook, which, like all stocks on the stock market, has retraced its rise.
---> What is its current situation?
If we look at the chart, its appearance is CLEARLY BULLISH (Bull), having gone through a retracement phase. The retracement it has made is EXACTLY THE 61.8% Fibonacci, AND IT HAS RESPECTED IT. Since reaching that retracement on March 14, the price has not stopped rising. It is currently BREAKING KEY ZONES to initiate an attack on NEW HIGHS IN VALUE. If it surpasses the 352 zone, it will go directly to the highs, and will most likely break them to explore new prices for the stock.
--------------------------------------
Strategy to follow:
ENTRY: We will open two long positions if the H4 candle closes above 352.
POSITION 1 (TP1): We close the first position in the 366 zone (+4%) (highs zone).
--> Stop Loss at 336 (-4.2%).
POSITION 2 (TP2): We open a Trailing Stop position.
--> Initial trailing stop loss at (-4.2%) (coinciding with the 336 level of position 1).
--> We modify the trailing stop loss to (-1%) when the price reaches TP1 (366).
-------------------------------------------
SET UP EXPLANATIONS
*** How do I know which two long positions to open? Let's take an example: If we want to invest €2,000 in the stock, we divide that amount by 2, and instead of opening one position of €2,000, we'll open two positions of €1,000 each.
*** What is a Trailing Stop? A Trailing Stop allows a trade to continue gaining value when the market price moves in a favorable direction, but it automatically closes the trade if the market price suddenly moves in an unfavorable direction by a specified distance. This specified distance is the trailing Stop Loss.
--> Example: If the trailing Stop Loss is at -1%, it means that if the price drops by -1%, the position will be closed. If the price rises, the Stop Loss also rises to maintain that -1% during increases. Therefore, the risk decreases until the position enters a profit. This way, you can take advantage of very strong and stable price trends, maximizing profits.

The Stock Market Decline Appears to be only in the US as of nowLast week on one of my member live videos I pointed out to the attendees that European markets were currently at, or very close to their All-Time highs...whereas in the US, we've entered the technical definition of a stock market correction...(down 10%). If you're so inclined to Google an economic calendar, it also appears the economic metrics like CPI, unemployment, etc... appear much better as well. There's an old adage in the markets.... "When the US sneezes, the global economy catches a cold" . However, at this very moment in time, the only thing that appears sick is the US. Maybe that changes with time. I suspect that will be the case...but in any event, one thing that is clear is that our stock market indices are signaling that whatever economic sickness is to be contracted, it will have originated here...in the United States.
That is certainly a new phenomenon.
For the past couple years I have been warning my members (and followers here on Trading View) of a long-term top in the stock markets. Week after week in my trading room, I have commented that I believe I have all constituent waves accounted for, to the best of my ability, to say with a high degree of confidence that a super-cycle wave (III) has topped .
What we have lacked is the price action to confirm that statement. This morning, I cannot tell you we have confirmation. That confirming probability only comes when price declines below the area of the wave 4 of one lesser degree. That area is outlined in the SPX daily chart entitled the "Must Hold Region". We are not there yet, nor do I think price makes a bee-line there in one shot. Therefore, I am NOT in panic mode this morning because I do believe we need a retrace higher and only that retracement's structure will inform us the higher probability of future price subdivisions....(higher or lower).
Panic is the necessary trader behavior needed to decline in such fashion as I believe a super cycle wave (IV) will start out. However personally, I do not think it's today. Futures are red this morning and closer to the recent lows than last week...the headlines surrounding the stock market appear very negative...but as of this morning, the MACD indicator on intraday charts is saying this type of sentiment is getting slightly weaker and NOT making new lows.
Therefore, I continue to maintain the price and technical indications tell me a minor B is either currently underway, or will be confirmed in the short term. Until those parameters get flipped, I'll reserve my panic (so to speak) for the c of (c) of intermediate (A) into the must hold region later this year... where it will probably be justified at that time.
Best to all,
Chris

How low will it go? The S&P Bear MarketI don't believe the market has bottomed yet. There is more to come.
Trump's tariffs will continue to cause uncertainty and as economic figures confirm a US slowdown, stock markets could fall further.
From a technical perspective, I will be looking to buy between 4700 and 5200. This is based on evident weekly horizontal levels, bullish channel support, and 100 and 200 SMA's.
VANTAGE:SP500 PEPPERSTONE:US500 ICMARKETS:US500 OANDA:SPX500USD

US500US500 Price Action Analysis and Trade Setups (March 28, 2025)
Price Action Summary:
Weekly Chart: Long-term uptrend intact, but recent rejection near 6,200 signals a medium-term correction.
Daily Chart: Price is consolidating near 5,600 after a sharp drop from highs. Bearish momentum persists.
4H Chart: Lower highs and lower lows confirm short-term bearish bias. Resistance at 5,750 is holding.
1H Chart: Intraday range between 5,550 and 5,750. Price struggling to break higher.
Trade of the Day (Day Trading Setup)
Short Setup:
Entry: 5,700 after rejection at resistance
Stop Loss: 5,770
Take Profit:
TP1: 5,620
TP2: 5,550
Reason: Short-term bearish structure with resistance holding at 5,750.
Swing Trading Setup
Short Setup:
Entry: Below 5,550 after daily close confirmation
Stop Loss: 5,650
Take Profit:
TP1: 5,300
TP2: 5,100

Bear Flag Broken on the $SPYBear Flag Broken on the AMEX:SPY ‼️🙀
- Rejection off the 200DMA
- 25DMA Bearish Cross of the 200DMA
Look Left 🎯 is $549.68
⛳️Measured Move 📏 is $538.73
Not financial advice

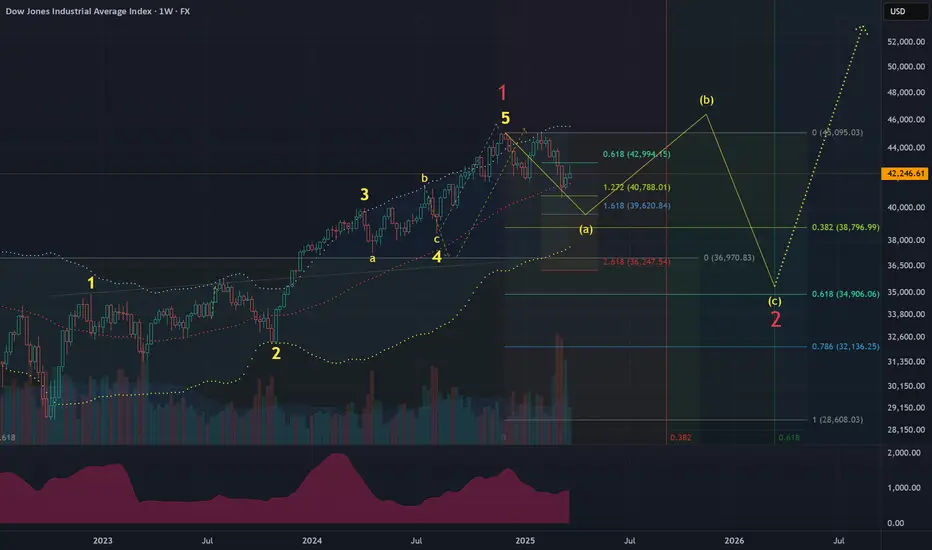
DJI US stock market forecast 2025-2026Assumption:
oct-22 — nov-24 (1-2-3-4-5) wave is over.
correction (a)-(b)-(c) is expected.
likely structure is a 3 wave regular flat.
Time:
the correction is expected to last until at least sep-25.
Price:
it's too early to predict final price for wave (c).
anticipated range is 35000-39000.
wave (a) shall reach 39600.
Long term waves:
Major uptrend lasts 25 years.
Major correcting downtrend lasts 9 years.
Next major downtrend is expected to start in 2033-2034.
SP500US Markets has pulled back nicely, It now provides a wonderful opportunity to get back into the market, I expect another drop to take the previous low set couple of days ago. April tends to be a good month for indices as the first quarter closer and rebalancing occured.
my plan would be to buy the SP500 and ride the trend

$SP500 $SPX Is the bull run over?#SP500 SP:SPX S&P500
Is this just a bull-run retracement or the beginning of a bigger crash?
Is the bull run over?
Every major crash started with an “innocent” 10–15% pullback. 🧐
It’s difficult to draw any conclusions right now, but once the current bounce is over, the next retracement will give us more clues. ⏳👀
Are you bullish or bearish? 🐂 🐻

$DXY 10% Declines along with $SPX declines from 1987-1995In case you are wondering if the drop in the $USDOL TVC:DXY US Dollar of 10% from a high is a sign of something major going on in the stock market, it reminded me of research I did right when I got out of college in 1987.
Here's a quick overview of that pattern of TVC:DXY declines of 10% against the backdrop of SP:SPX or S&P500 Index declines at that time. The 1987 stock market crash is on the far left of this graph and gets the chart started for you to review.
The 10% drops from highs in the TVC:DXY index are labeled with yellow arrows and there were 9 of them across this time series from 1987-1995.
We can imagine how a Non-US investor would handle both a drop in the TVC:DXY and a drop in the SP:SPX , but a drop of both the TVC:DXY and SP:SPX of 10% together would mean a loss of 20% for the non-US investor. That is a painful loss and perhaps more than investors wanted to risk.
Historically, it was a good time to look for a stock market bottom AFTER a drop in the TVC:DXY index and the green boxes at the top show the risk of a deeper decline in the SP:SPX was minimal after this scenario.
So the end result of this analysis is that the Dollar can be viewed as a contrarian indicator after a meaningful decline, as in 10% in this time frame. Look for other signs of a market bottom, especially using my TVC:VIX signals (5 point spike indicator and VIX75% retracement) to help define a bottom. The VIX75 signal triggered on Monday, March 24th, indicating that the panic from the selloff had moderated to a point enough to signal that the panic was over.
Do some more research for yourself and see if the TVC:DXY drop was an "asset allocation" shift as US investors bailed out of US stocks to invest in non-US stocks or was it another wave of non-US investors dumping US stocks to cut risk.
Either way, know what you are investing in and question everything. These days, it is more important to be educated and use TradingView to chart and research the past will help you be a more educated investor.
Cheers,
Tim

SP500 - Long Strategy with FED effectI think that FED can give a pump to SP500, probably we will go directly to first 2 target than we can have a retest of support area. In any case there is a volume pressure under this price level so is aspected a long wave.

I wouldn't be surprised for a capitulatory type of drop tomorrowAs we can see the trend line have held the US500/SPX/SPY price for so many times, we still couldn't break above it. In other word, it's acting as current overhead resistance ever since we broke down from this white line. We tried three times so far this week, 17th, 19th and the 20th, still couldn't manage to break above it. So if anything happens tomorrow, it would be a big red candle to tomorrow with gigantic volume since it is going to be the "Quad Witching" Day.
When will the "True Bounce" be happening? I would say, the bounce back window should starts as early as next week if we see capitulation tomorrow.

Is the history goign to repeat? SP500Checking the seasonality and the history, looks like SP500 is going to reverse soon (for a short term). I placed my long limit order (but i also entered now) targeting 5900 level.
Good luck

Possible rise from the bottom of the long-term ascending channelGiven the recent emotional decline in the Dow Jones and S&P500 due to Trump's tariff policy, the S&P500 is expected to make an upward correction from the bottom of its confirmed ascending channel. The stop loss is equivalent to the closing of the 4-hour candle below today's last low, with a target of 5900 in the final step.
