ES1! S&P500 Might Lose Momentum As Tariffs Deal Not Set...price could probably be testing all time highs. Before plunging....
if the volumes comes with it and reaches the all times high levels, that could be a nice short entry point for potential profits.
Otherwise, it could probably just fill the gap on week open and keep going down in a regular pattern until August as Trumps Tariffs Deals deadline is around that time possiblily...
Sp500short

SHORT SP500fundamental : negative dollar
Techniq: respecting 15M BEARISH GAP
OB = BB
SSL still not taken

A crash in the horizonAs I have been suspecting for a long time. Markets are getting closer to a crash. On the weekly the 2 years bond market confirmed the change in the trend to the downside. Once we dip bellow the blue ema we might be entering in a doomed phase. Cheers

S&P 500 – Projection to the SouthLooking at the market's behavior using the orange median line/fork, one can clearly see how the market reacts when it touches one of the lines.
Median lines/forks are not an oracle. They simply project the highest probable path of the price based on a mathematical calculation inherent to the tool.
If you follow the rule set, money management, and risk management, you have a wonderful framework that offers a significant advantage in trading the markets.
Let’s take a look at the current situation:
The orange fork:
– Price closes outside the fork (1)
– Multiple retests of the L-MLH (textbook behavior) (2)
– Break of the 1/4 line, heading toward the 1st warning line (3)
Next movement pattern according to the median line framework:
– Drop to the white centerline (4)
– Retest of the centerline (5)
– 1/4 line (6)
– Lower median line parallel (7) with a possible retest
– Orange centerline of the pendulum fork (8)
Wishing everyone a wonderful start to the week.

SP500 BEARISH TRADE IDEA Key Observations:
Imbalance Zone Identified (Supply-Demand Gap):
The pink zone is marked as an imbalance — an area where price moved too quickly upward, leaving little trading volume in between.
These imbalances often act like magnets, drawing price back to "fill" them.
Recent Price Action:
Price recently formed a peak and has since started pulling back.
The latest candlesticks show bearish momentum (a series of red Heikin Ashi candles with increasing size).
Projected Price Movement:
A blue arrow projects a further decline into the imbalance zone, suggesting price may retest this level for liquidity or to complete a retracement.
Target Area:
The imbalance zone lies approximately between 5,680 and 5,736, with a midpoint around 5,710.
This is a logical target for a pullback before potentially resuming upward.
📉 Bearish Bias Justification:
Market Structure: A new lower high is forming, possibly signaling a short-term reversal or correction.
Heikin Ashi Candles: Smooth and elongated bearish candles indicate strength in the down move.
Volume Imbalance Theory: Price may need to fill this inefficiency before finding new direction.
✅ Possible Trading Implications:
Short Setup: Traders might look for short positions with targets inside the imbalance zone.
Buy Opportunity: Once the imbalance is filled, if bullish price action confirms, it could become a strong buy zone.
⚠️ What to Watch:
Look for confirmation (e.g., candlestick reversal or support forming) in the imbalance area before assuming reversal.
News/events (such as the economic calendar icons below) might impact price direction sharply.

S&P 500 | Blue Box as Margin of SafetyWhen the index returns to the blue box, it reaches a zone forged by genuine buying interest and technical alignment. In a disciplined, data‑driven approach, this area serves as our first line of defense.
Why It Matters
• Past reactions show price pauses and reversals here, revealing real demand.
• It coincides with key footprint volume clusters where buyers have stepped in.
Entry Criteria
Higher‑Time‑Frame Stability
Confirm price holds within or above the blue box before considering a position.
Lower‑Time‑Frame Confirmation
Wait for clear breakouts or higher‑lows on short‑term charts backed by rising footprint volume.
Strict Risk Control
If price breaks through without retest or volume support, stand aside and seek a clearer setup.
By treating the blue box as our margin of safety and relying on actual volume footprint data, we trade with prudence and let the market’s real signals guide our decisions.
📌I keep my charts clean and simple because I believe clarity leads to better decisions.
📌My approach is built on years of experience and a solid track record. I don’t claim to know it all but I’m confident in my ability to spot high-probability setups.
📌If you would like to learn how to use the heatmap, cumulative volume delta and volume footprint techniques that I use below to determine very accurate demand regions, you can send me a private message. I help anyone who wants it completely free of charge.
🔑I have a long list of my proven technique below:
🎯 ZENUSDT.P: Patience & Profitability | %230 Reaction from the Sniper Entry
🐶 DOGEUSDT.P: Next Move
🎨 RENDERUSDT.P: Opportunity of the Month
💎 ETHUSDT.P: Where to Retrace
🟢 BNBUSDT.P: Potential Surge
📊 BTC Dominance: Reaction Zone
🌊 WAVESUSDT.P: Demand Zone Potential
🟣 UNIUSDT.P: Long-Term Trade
🔵 XRPUSDT.P: Entry Zones
🔗 LINKUSDT.P: Follow The River
📈 BTCUSDT.P: Two Key Demand Zones
🟩 POLUSDT: Bullish Momentum
🌟 PENDLEUSDT.P: Where Opportunity Meets Precision
🔥 BTCUSDT.P: Liquidation of Highly Leveraged Longs
🌊 SOLUSDT.P: SOL's Dip - Your Opportunity
🐸 1000PEPEUSDT.P: Prime Bounce Zone Unlocked
🚀 ETHUSDT.P: Set to Explode - Don't Miss This Game Changer
🤖 IQUSDT: Smart Plan
⚡️ PONDUSDT: A Trade Not Taken Is Better Than a Losing One
💼 STMXUSDT: 2 Buying Areas
🐢 TURBOUSDT: Buy Zones and Buyer Presence
🌍 ICPUSDT.P: Massive Upside Potential | Check the Trade Update For Seeing Results
🟠 IDEXUSDT: Spot Buy Area | %26 Profit if You Trade with MSB
📌 USUALUSDT: Buyers Are Active + %70 Profit in Total
🌟 FORTHUSDT: Sniper Entry +%26 Reaction
🐳 QKCUSDT: Sniper Entry +%57 Reaction
📊 BTC.D: Retest of Key Area Highly Likely
📊 XNOUSDT %80 Reaction with a Simple Blue Box!
📊 BELUSDT Amazing %120 Reaction!
📊 Simple Red Box, Extraordinary Results
I stopped adding to the list because it's kinda tiring to add 5-10 charts in every move but you can check my profile and see that it goes on..

S&P500 2022 into the Bear Market. Same Pattern 2025In 2022, before the bear market began, we saw the same pattern that we're seeing now:
1. Sine wave pattern
2. Fake recovery
3. Break above the sine wave top
4. Sharp decline
Last week, right after the sine wave top was broken, U.S. bonds were downgraded AFTER OFFICIAL MARKET SESSION!
It’s no surprise that rating agencies are losing confidence in the U.S. government's ability to repay its debts.
Just look at the rising interest payments — if that’s not a wake-up call, I don’t know what is. 😕
I don’t live in the U.S., but I’m genuinely concerned that a collapse — which now seems nearly inevitable — will impact the entire world.
Going long in U.S. markets under these technical and fundamental conditions? Putting all your eggs back into that basket? Really?
I hope this gives some perspective.
Trade safely, trade small, and keep your risks minimal.

US500 bearish 12 May - 16 May 2025S&P 500 Bearish Outlook: Targeting $5,100 Amid Rising Uncertainty
As of May 12, 2025, the S&P 500 (US500) stands at 5,661, reflecting a robust recovery from its April lows. However, I anticipate a bearish shift, projecting a decline towards the $5,100 level in the near term. Several converging factors underpin this outlook:
1. Anticipated Weakness in Core CPI Data
The upcoming release of the April Core Consumer Price Index (CPI) on May 13 is poised to be a pivotal event. While the year-over-year Core CPI is forecasted at 2.8%, matching the previous month's figure, the month-over-month increase is expected to rise to 0.3%, up from 0.1% in March. This acceleration suggests persistent inflationary pressures, potentially prompting the Federal Reserve to maintain or even tighten monetary policy, thereby exerting downward pressure on equities.
2. Deteriorating Market Sentiment and Forecasts
A notable shift in market sentiment is evident, with key indicators turning bearish. A prominent S&P 500 model has signaled its first bearish outlook since February 2022, reflecting growing investor apprehension. Additionally, leading financial institutions have revised their S&P 500 targets downward:
Goldman Sachs: Reduced from 6,500 to 5,700
RBC Capital Markets: Lowered from 6,600 to 5,500
Oppenheimer: Cut from 7,100 to 5,950
Yardeni Research: Adjusted from 7,000 to 6,000
These revisions underscore the mounting concerns over economic headwinds and market volatility.
3. Sectoral Divergence: Opportunities Amidst the Downturn
While the broader market faces challenges, certain sectors may exhibit resilience or even bullish tendencies:
Healthcare: Continues to serve as a defensive sector, with companies demonstrating solid quarterly results and reaffirming full-year guidance despite tariff impacts.
Energy Infrastructure: Firms like Enbridge and TC Energy benefit from long-term structural tailwinds, including rising energy demand and global energy security priorities.
Financials and Technology: Sectors represented by ETFs such as XLK and XLF are highlighted for their strong fundamentals and growth prospects.
Conversely, consumer discretionary sectors are showing signs of strain, with negative revenue surprises and companies like Harley-Davidson withdrawing their 2025 outlooks amid tariff uncertainties.
4. Implications of the US-UK Trade Deal
Recent developments in the US-UK trade agreement further contribute to market uncertainty. While the deal includes exemptions for certain British goods, such as aerospace components and a quota of 100,000 UK-made cars annually, it also maintains a baseline 10% tariff on foreign goods. This policy introduces complexity and potential cost pressures for multinational companies operating across borders.
Moreover, the agreement has faced criticism for being one-sided, with concerns that it may not adequately protect domestic industries or address broader trade imbalances. Such apprehensions can dampen investor confidence and contribute to market volatility.
The convergence of persistent inflation, cautious monetary policy, revised market forecasts, and the complexities introduced by recent trade agreements suggest a bearish trajectory for the S&P 500, with a potential decline towards $5,100. Investors should remain vigilant, monitoring sector-specific developments and macroeconomic indicators to navigate the evolving market landscape.
Disclaimer: This analysis is for informational purposes only and does not constitute investment advice. Always conduct your own research before making investment decisions.

Major shift on the S&P 500: Is the bull market really over ?
After three years of almost uninterrupted gains, the U.S. market has finally shifted gears.
In early March, following a sharp escalation in trade tensions between China and the United States, the S&P 500 officially entered a bear market.
The tariff shock acted as a catalyst: buyers failed to defend critical levels, and the bullish momentum broke down.
Today, my scenario is clear:
I believe we are entering a wide range similar to what we saw in 2022, between 4700 and 5500 points.
In this controlled volatility environment, both investing and trading strategies must adapt.
💰 For long-term investing:
I'm staying fully in cash.
I prefer to wait until my personal indicator flashes green again before re-entering the market.
Patience is my best weapon in uncertain environments.
🎯 For swing trading:
The approach here is more active.
Each touch of the lower boundary (around 4700) will be considered a tactical buy, aiming to resell around 5500 points at the top of the range.
No rushing, no chasing moves: I only act at the extremes.

$SPX Monthly MACD Cross – Reset or Breakdown?The monthly MACD for the S&P 500 ( SP:SPX ) just crossed to the downside 📉 — a signal we’ve only seen a few times in the past decade.
Looking at the chart, this indicator also triggered during:
📉 2018 (Quick pullback)
🦠 2020 (COVID crash)
🐻 2022 (Extended bear market)
Now in 2025, we’re facing another sharp decline — but the question is:
👉 Is this just another quick reset like '18 & '20... or are we about to grind lower like 2022?
The MACD histogram is already in negative territory, and the price action is following the same pattern we saw before extended drawdowns.
What do you think: is this the beginning of something deeper? Or are we prepping for a snapback rally?
Drop your thoughts below 👇

DEATH CROSS on the SP500?We just witnessed the 50-day SMA crossing below the 200-day SMA — a technical signal known as the Death Cross.
Historically, this pattern has been associated with:
Trend reversals from bullish to bearish
Extended downside pressure
A loss of investor confidence in the short-to-medium term
🧠 While not always followed by major crashes, the last time this pattern showed up in a similar setup was followed by an accelerated drop — and that’s exactly what we’ve seen again.
The real question now is: 👉 Was this a false signal or is more downside ahead?
🔍 Keep an eye on price action around the 5,400–5,500 zone. If it fails to recover, this death cross might just be the start of a deeper correction...

WHY EVERYTHING IS GOING DOWN? ANSWER IS HERE!Understanding the Simultaneous Decline in EVERYTHING!
1. The Influence of U.S. Treasury Yields and Interest Rates
The U.S. 10-year Treasury bond yield is a major benchmark in global finance. When yields rise, it signifies that bonds are becoming more attractive relative to riskier assets. Rising yields typically occur when:
Investor Demand Shifts: Investors move from risky assets (like equities or crypto) to safer, higher-yielding government bonds.
Inflation Expectations: Higher inflation expectations often lead investors to demand higher yields, which in turn increases borrowing costs.
Cause and Effect:
When Treasury yields increase, the opportunity cost of holding lower-yielding assets rises. This makes stocks, precious metals like gold, and speculative assets like cryptocurrencies less attractive. Even gold, typically seen as a safe haven, can lose its charm if fixed-income assets provide competitive returns with significantly lower risk.
2. M2 Money Supply Dynamics
The M2 money supply measures the total liquidity available in the economy, including cash, checking deposits, and easily convertible near-money assets. Changes in M2 can impact asset prices in several ways:
Expanding M2: More liquidity in the market initially can boost asset prices. However, if this expansion leads to rising inflation, it may eventually trigger higher interest rates and bond yields.
Contraction or Slowing Growth in M2: A tightening in liquidity can reduce the flow of money into various asset classes. This dampens overall market sentiment and makes riskier assets less attractive.
Cause and Effect:
If M2 growth slows or contracts, there is less capital to chase after higher returns in equities and crypto. At the same time, if there is an expectation of tightening monetary policy, investors recalibrate risk expectations, which leads to a broader sell-off across multiple asset classes.
3. Investor Sentiment and Risk-Off Behavior
In periods where both Treasury yields are rising and the money supply signals less liquidity, the overall investor sentiment often shifts toward a "risk-off" stance. This means:
Safe-Haven Demand: Investors move into safe assets like government bonds, which drives up bond prices and yields while pulling money out of riskier assets such as stocks, gold, and cryptocurrencies.
Correlation Effect: As riskier assets are sold off, their prices fall in tandem. Therefore, even if gold typically acts as a counterweight to stocks, in a severe risk-off environment, all asset classes might decline.
Cause and Effect:
With a risk-off sentiment dominating the market, traditional safe havens (like gold) and growth-oriented assets (stocks and crypto) can experience simultaneous declines. Rising yields encourage a rotation away from these riskier positions, which reinforces the downward trend across multiple markets.
4. Historical Context: The Trump Era and Beyond
During the Trump administration, we observed episodes where Treasury bond prices surged significantly (e.g., a 10% surge) as investors sought refuge during periods of political and economic uncertainty. Eventually, as market sentiment shifted, yields rose, and this led to higher borrowing costs. The resulting effect was a broad-based retreat in many asset classes.
Example: In those periods, as yields climbed to around 4%, investor appetite for risk diminished. The market corrected across equities, precious metals, and cryptocurrencies, with all asset classes experiencing pressure concurrently.
Cause and Effect:
In the current climate, if similar dynamics are at work—namely, rising yields accompanied by tightening M2 growth—then we might see a similar pattern: gold, the S&P 500, and crypto all experience declines together because investor risk appetite is sharply reduced.
Conclusion
The simultaneous decline in gold, the S&P 500, and cryptocurrencies can primarily be attributed to rising U.S. Treasury yields and tightening M2 money supply. As yields rise:
The relative attractiveness of low-risk government bonds improves, encouraging a shift in investment away from riskier assets.
Increased yields raise borrowing costs, which in turn dampens economic growth and investor sentiment.
Slowing liquidity (as measured by M2) further restricts the available capital chasing after higher returns.
This confluence of factors leads to a widespread "risk-off" environment where even traditional safe havens like gold may fall as the entire market adjusts to a higher interest rate and lower liquidity backdrop. Investors thus move across asset classes in a coordinated fashion, leading to declines in gold, equities, and crypto alike.
Understanding this cause-and-effect relationship is crucial for professional traders who rely on disciplined strategies. With a clear view of the broader economic signals, you can navigate these shifts with precision—helping you not only to avoid costly mistakes but also to capitalize on high-probability opportunities that emerge during these market transitions.

The weekly US02Y downtrend has started. As I have been expecting months ago, now the downtrend is been printed on the guppy emas. The trend is changing to red like in the past. This indicates that maybe a big correction might follow the SP500 in the coming months.

SP500 In Reverse: Unpacking the latest markets setbackThe SP500 continued its decline on Friday. The downward price action is now very violent and could continue in the coming days as well. No signs of recovery still..

US500US500 Price Action Analysis and Trade Setups (March 28, 2025)
Price Action Summary:
Weekly Chart: Long-term uptrend intact, but recent rejection near 6,200 signals a medium-term correction.
Daily Chart: Price is consolidating near 5,600 after a sharp drop from highs. Bearish momentum persists.
4H Chart: Lower highs and lower lows confirm short-term bearish bias. Resistance at 5,750 is holding.
1H Chart: Intraday range between 5,550 and 5,750. Price struggling to break higher.
Trade of the Day (Day Trading Setup)
Short Setup:
Entry: 5,700 after rejection at resistance
Stop Loss: 5,770
Take Profit:
TP1: 5,620
TP2: 5,550
Reason: Short-term bearish structure with resistance holding at 5,750.
Swing Trading Setup
Short Setup:
Entry: Below 5,550 after daily close confirmation
Stop Loss: 5,650
Take Profit:
TP1: 5,300
TP2: 5,100

S&P 500 – Unstable Ground, Smart Money Seeks Stability🚨 S&P 500 – Unstable Ground, Smart Money Seeks Stability 🚨
“Markets don’t like uncertainty. Money flows where confidence is strong, and right now… that’s NOT here.”
🔥 Key Concerns:
✅ U.S. Policies Creating Instability – A crisis-driven environment shakes investor confidence.
✅ S&P Struggling to Hold Strength – Momentum is weak, smart money is hesitant.
✅ Blue Box = First Resistance Zone – A tough level to break, especially in this macro climate.
💡 The Game Plan:
Short Bias from the Blue Box – Until proven otherwise, this level is resistance.
LTF Breakdowns & CDV Confirmation = High-Probability Shorts – We don’t guess, we react.
No Clean Break Above? The Trend Remains Fragile.
“Markets punish uncertainty. Right now, the S&P is walking on thin ice—be cautious, be tactical.” 🔥📉
I keep my charts clean and simple because I believe clarity leads to better decisions.
My approach is built on years of experience and a solid track record. I don’t claim to know it all, but I’m confident in my ability to spot high-probability setups.
If you would like to learn how to use the heatmap, cumulative volume delta and volume footprint techniques that I use below to determine very accurate demand regions, you can send me a private message. I help anyone who wants it completely free of charge.
I have a long list of my proven technique below:
🎯 ZENUSDT.P: Patience & Profitability | %230 Reaction from the Sniper Entry
🐶 DOGEUSDT.P: Next Move
🎨 RENDERUSDT.P: Opportunity of the Month
💎 ETHUSDT.P: Where to Retrace
🟢 BNBUSDT.P: Potential Surge
📊 BTC Dominance: Reaction Zone
🌊 WAVESUSDT.P: Demand Zone Potential
🟣 UNIUSDT.P: Long-Term Trade
🔵 XRPUSDT.P: Entry Zones
🔗 LINKUSDT.P: Follow The River
📈 BTCUSDT.P: Two Key Demand Zones
🟩 POLUSDT: Bullish Momentum
🌟 PENDLEUSDT.P: Where Opportunity Meets Precision
🔥 BTCUSDT.P: Liquidation of Highly Leveraged Longs
🌊 SOLUSDT.P: SOL's Dip - Your Opportunity
🐸 1000PEPEUSDT.P: Prime Bounce Zone Unlocked
🚀 ETHUSDT.P: Set to Explode - Don't Miss This Game Changer
🤖 IQUSDT: Smart Plan
⚡️ PONDUSDT: A Trade Not Taken Is Better Than a Losing One
💼 STMXUSDT: 2 Buying Areas
🐢 TURBOUSDT: Buy Zones and Buyer Presence
🌍 ICPUSDT.P: Massive Upside Potential | Check the Trade Update For Seeing Results
🟠 IDEXUSDT: Spot Buy Area | %26 Profit if You Trade with MSB
📌 USUALUSDT: Buyers Are Active + %70 Profit in Total
🌟 FORTHUSDT: Sniper Entry +%26 Reaction
🐳 QKCUSDT: Sniper Entry +%57 Reaction
📊 BTC.D: Retest of Key Area Highly Likely
I stopped adding to the list because it's kinda tiring to add 5-10 charts in every move but you can check my profile and see that it goes on..

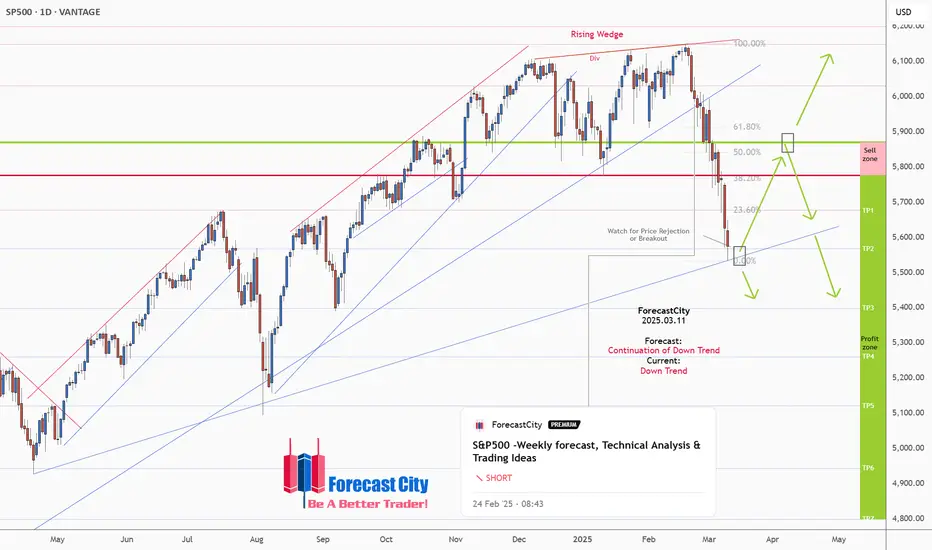
S&P500 -Weekly forecast, Technical Analysis & Trading IdeasMidterm forecast:
5870.56 is a major resistance, while this level is not broken, the Midterm wave will be downtrend.
$S&P500
Technical analysis:
A peak is formed in daily chart at 6150.05 on 02/19/2025, so more losses to support(s) 5568.78, 5398.95, 5261.00 and more depths is expected.
Take Profits:
5677.80
5568.78
5398.95
5261.00
5122.47
4944.41
4800.00
__________________________________________________________________
❤️ If you find this helpful and want more FREE forecasts in TradingView,
. . . . . . . . Hit the 'BOOST' button 👍
. . . . . . . . . . . Drop some feedback in the comments below! (e.g., What did you find most useful? How can we improve?)
🙏 Your support is appreciated!
Now, it's your turn!
Be sure to leave a comment; let us know how you see this opportunity and forecast.
Have a successful week,
ForecastCity Support Team
S&P500 -Weekly forecast, Technical Analysis & Trading IdeasMidterm forecast:
5677.80 is a major support, while this level is not broken, the Midterm wave will be uptrend.
Technical analysis:
There is a divergence in RSI and price between the peak at 6107.47 on 2024-12-06 and the peak at 6150.07 on 2025-02-19, the probability of uptrend continuation is decreased and the probability of beginning of downtrend is increased.
While the RSI downtrend #1 is not broken, bearish wave in price would continue.
A peak is formed in daily chart at 6150.05 on 02/19/2025, so more losses to support(s) 6031.27, 5875.31, 5777.28 and minimum to Major Support (5677.80) is expected.
Relative strength index (RSI) is 49.
Supports and Resistances:
5568.78
5398.95
5194.10
5039.36
4944.41
4843.23
4662.99
4544.26
__________________________________________________________________
❤️ If you find this helpful and want more FREE forecasts in TradingView,
. . . . . . . . Hit the 'BOOST' button 👍
. . . . . . . . . . . Drop some feedback in the comments below! (e.g., What did you find most useful? How can we improve?)
🙏 Your support is appreciated!
Now, it's your turn!
Be sure to leave a comment; let us know how you see this opportunity and forecast.
Have a successful week,
ForecastCity Support Team

M.A.G.A's STORYTAIL (SP500)If I can reach the stars, pull one down for you
Shine it on my heart so you could see the truth
That this love I have inside is everything it seems
But for now I find, it's only in my dreams
And I can change the world
I will be the sunlight in your universe
You would think my love was really something good
Baby, if I could change the world
If I could be king, even for a day
I'd take you as my queen, I'd have it no other way
And our love would rule in this kingdom we have made
'Till then, I'd be a fool wishing for the day
And I can change the world
I would be the sunlight in your universe
You would think my love was really something good
Baby, if I could change the world
Baby, if I could change the world
I could change the world
I would be the sunlight in your universe
You would think my love was really something good
Baby, if I could change the world
Baby, if I could change the world
Baby, if I could change the world
Eric Clapton

MES: Ice and Fire Could Blow the U.S. Economy Off its CourseCME: Micro E-Mini S&P 500 Futures ( CME_MINI:MES1! ) #Microfutures
In “A Song of Ice and Fire”, American author George Martin painted a mystical land where dragons spit out flame to destroy a whole city and a winter that last one hundred years. Game of Thrones, the popular HBO TV series, was adapted from Martin’s book.
In 2025, we seem to be reliving these moments. California wildfires have claimed dozens of lives, burnt down thousands of homes, and caused an estimated $250 billion in damage.
Meanwhile, Winter Storm Blair raged coast-to-coast, bringing heavy snow across the Great Plain to Mid-Atlantic. The storms shut down interstate highways, caused thousands of airport delays and racked up 350,000 power outages. At the time of this writing, Polar Vortex is bringing freezing temperature back to the lower 48 states.
These weather perils are very destructive. In my opinion, the forces of nature could cause real damage to the entire U.S. economy.
Firstly, we could see a rebound in inflation
The Bureau of Statistics (BLS) reported that US CPI increased 0.4% in December and went up 2.9% year-over-year (YoY). Of which, the energy index decreased 0.5% YoY with energy commodities gasoline and fuel oil falling 3.4% and 13.1%, respectively. In contrast, energy services such as electricity increased 2.8% and natural gas (piped) rose 4.9% YoY.
The chart shows a correlation between CPI and natural gas prices. The underlying logic is the U.S. economic reliance on natural gas. According to the Energy Information Administration (EIA), about 43.1% of the electricity in the country was generated by natural gas.
In “Nat Gas: Trading the Weather”, I explained how cold temperatures increase natural gas demand for generating electricity and heating up homes.
Higher natural gas prices affect not just the storm-hit regions, the entire country also bears a higher cost for energy services. Larger utility bills raise the cost of producing and distributing all goods and services.
A leading indicator: When natural gas prices rise, inflation will likely go up.
Conclusion: As natural gas went up sharply, we could expect a higher CPI for January.
Secondly, we could see economic slowdown and higher unemployment
Many businesses in the passage of winter storms suffered loss of sales. People in parts of Los Angles were evacuated. The total cost for insurance payout, loss of revenue, debris cleanup and rebuilding amounts to hundreds of billions of dollars. Total US GDP was $28 trillion last year, or about $2.3 trillion per month. A quick calculation shows that the weather perils could shave off 1/10th of the US national output for the month of January!
Many S&P 500 companies are based in California or in the storm-hit regions. The actual damage to them will be revealed when they report quarterly earnings in April and May. The Bureau of Economic Analysis will report Q1 GDP on April 30th.
US unemployment has been on the rise since mid-2023. In my opinion, the A.I. driven technological revolution is responsible for many High-Tech layoffs. On January 10th, the BLS released its nonfarm payroll report and showed that unemployment in the Information sector was 98,000 in December 2024, up from 86,000 a year ago.
December is the busiest month for the Retail sector. However, retailers report total unemployment of 897,000 for the month, up 87,000 or 11% from December 2023.
When the BLS updates its payroll report in January, I expect to see higher unemployment data. The month-to-month data could be even worse, as January is usually a slow month after the December holiday season. In addition, winter storms and wildfires would push more businesses to shut down and lay off employees.
Finally, the uncertainty around economic policies under the new administration
I expect President Trump to raise “ice and fire” on his own. If his first term is any guide, we would see plenty of drastic policy changes impacting various industries. Uncertainties are not well embraced in the world of investment. Any new policy initiative could bring the market to chaos when the news breaks, regardless of its long-term effect.
During the first term, important policies (such as new tariff) were usually announced from Twitter tweets. This time around, they would likely come out of Truth Social tweets.
Trading with Micro E-Mini S&P 500 Futures
In my opinion, the U.S. stock market will face more volatility in the coming months. Key economic data could be disappointing for investors.
• When the January nonfarm payroll report is released on February 7th, monthly employment data could trend lower, while unemployment rate ticks up. Signals of economic weakness could send the stock market lower.
• When the January CPI data is released on February 12th, the headline inflation could move higher. If this is the case, the Fed is less likely to lower interest rates. The stock market will face downward pressure.
• The Fed will meet on January 29th. According to CME Group FedWatch Tool, the futures market prices a Fed decision of no-change at 97.9%. However, the market consensus shows that Fed Funds rates could drop to 3.25-4.00% by December, indicating 1-4 rate cuts in 2025. The Fed has not committed to any further rate cut.
www.cmegroup.com
Given these scenarios, a trader could explore short-term opportunities by shorting the S&P 500 prior to the Big Report Dates.
The CFTC Commitment of Traders report provides further support to this thinking. The latest data shows that, as of January 14th, Leverage Funds hold 151,543 long positions and 448,908 short positions for E-Mini S&P 500 futures.
Despite the S&P nearing its all-time high, “Smart Money” already turns bearish. Shorts outweigh longs by a 3-to-1 ratio.
• They are also bearish on Nasdaq 100, by a 1:2 long-short ratio (43,254 vs. 82,724)
• This contrasts with the Dow contracts sharply. Leverage funds own Micro Dow by a 3:2 long-short ratio (17,591 vs. 10,051) during the same period.
The MES contracts offer smaller-sized versions of CME Group’s benchmark S&P 500 futures (ES) contracts. Micro futures have a contract size of $5 times the S&P 500 index, which is 1/10th of the E-Mini contract.
Micro contracts are very liquid. CME Group data shows that 1,095,979 contracts were traded on Thursday, January 16th. Open Interest at the end of the day was 129,228.
Buying or selling 1 MES contract requires an initial margin of $1,525. With Friday closing price of 6,040, each March contract (MESH5) has a notional value of $30,200. Compared with investing in stocks, the futures contracts offer a built-in leverage of about 20 times (=30200/1525).
Hypothetically, if S&P futures price falls 10% to 5,436, the price change of 604 points (6,040-5,436) will translate into $3,020 in profit for a short position, given each index point equal to $5 for the Micro contract. Using the initial margin of $1,525 as a cost base, the trade would produce a theoretical return of 198% (=3020/1525).
The risk to short Micro S&P is that the US stock market continues its spectacular rally. To limit the downside risk, a trader could set up a stop-loss when entering a short position.
For illustration, a short trade executed at 6,040 could be combined with a 6,200 stop. If the S&P goes up to 6,500, the trader’s position would be liquidated well before that. The maximum loss would be $800 (= (6200-6040) * $5).
Happy Trading.
Disclaimers
*Trade ideas cited above are for illustration only, as an integral part of a case study to demonstrate the fundamental concepts in risk management under the market scenarios being discussed. They shall not be construed as investment recommendations or advice. Nor are they used to promote any specific products, or services.
CME Real-time Market Data help identify trading set-ups and express my market views. If you have futures in your trading portfolio, you can check out on CME Group data plans available that suit your trading needs www.tradingview.com

Rising bond yields hurting the S&P 500 indexThe rising bond yields is one of the top reasons why the S&P 500 index has pulled back in the past few months. Data shows that the 30-year yield surged to 5% for the first time since 2022. The 5-year and 10-year yields have also continued rising in the past few months.
These yields rose after the US published strong nonfarm payrollsdata on Friday. According to the Bureau of Labor Statistics (BLS), the economy added over 264k jobs data, higher than the median estimate of 112k. The unemployment rate dropped to 4.1%, the lowest level in three months.
Therefore, these numbers confirmed the Federal Reserve’s view that the labor market was doing well. Officials are now focusing on the steady inflation and have hinted that the bank will only deliver two cuts this year.
Last year, we wrote about the bond vigilantes and warned that they may impact the stock market. These vigilantes are investors who typically push bond yields significantly higher when government spending is rising.

SP500 - detailed wave countReports indicate President-elect Donald Trump may declare a national economic emergency to enact controversial tariff policies under the International Economic Emergency Powers Act (IEEPA). Despite criticisms, Trump remains committed to his proposed economic measures.
Yahoo Finance reporter Alexandra Canal examines how the US dollar (DX=F, DX-Y.NYB) might respond to Trump's tariff plans and overall economic agenda, inversely causing a reaction in S&P 500 (^GSPC) earnings growth.

SP500 - Waves' Final Fantasy 15000S&P 500 looks increasingly vulnerable to a correction this year, according to Goldman Sachs
The stock market looks increasingly vulnerable to a sharp pullback, according to Goldman Sachs.
In a note, the bank highlighted three things that could challenge the bull case for stocks in 2025.
Strategists pointed to high valuations, market concentration, and the rapid increase in stock prices.
