US500 1D: Possible SHORTUS500 1D: Possible SHORT
As we look at S&P500, we can see a possible fall from 4500 to 3400 in the coming months
Sp500short

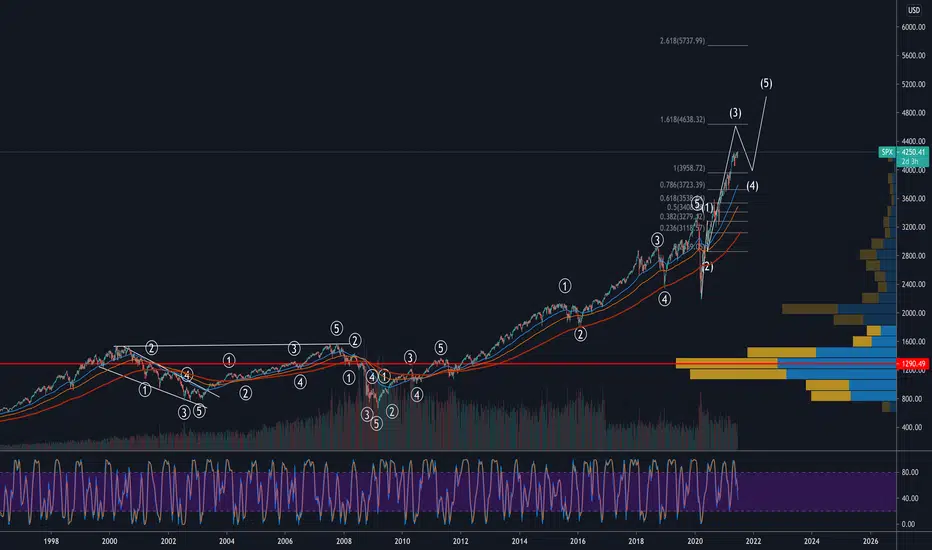
S&P still promising A lot of people have been calling for a stock market crash for a long time. However, I'm afraid I have to disagree. From a technical point of view, there is no doubt the S&P is losing momentum as it can be appreciated in the momentum indicators. The price is making new higher highs, but the momentum is doing lower highs. However, the Elliott wave technicals are saying otherwise. I have drawn here the secular cycle and primary cycle aligned. S&P is in the middle of a 3rd impulsive wave with a minimum target of 5200. That's where I believe the S&P (if confirmed by technical) will have a retracement or cool off down to 4200. People will turn really bearish, but the S&P will turn bullish for the last 5th leg up to 6200. That is where the bear market will start, and I expect the market to collapse at least 30%, with my real target standing at 50% around 3200.
The end of wave 3 would be the best time to start slowly rotate your profit and capital into assets such as commodities to edge against the crush. At the end of wave 5, you should aim to be 85% - 90% out of the stock market.
I am happy to hear your opinions; please leave a comment below.

S&P 500 (US500) : 4H TF AnalysisWell, considering that the price has lost its dynamic support and had previously reached its highest level in history, it seems that the price intends to make a correction, our first correction target is 4477 and if this support is lost , The next static support is 4418 . Of course, now the price has reacted to its first static support, which is 4500 ... CURRENCYCOM:US500
⚠️ This Analysis will be updated ...
👤 Arman Shaban : @Ar_M_An_4
📅 09.Sep.2021
⚠️(DYOR)

SP500 BIG CRASH & RECESSION - STAGFLATION - CLOCK CHARTAfter correctly predicting today's crypto crash, I would like to share an idea of how I believe the American market might go up in flames based on overvalued tech stocks and wages not holding up with inflation. Cash is king, after crash, gold will be. But right now, hold paper.

S&P500: Cooling Off Period! 🥶🥶🥶It is almost over with the S&P’s great run. Our expectation centers around the view that there will be a corrective movement coming it at around 4558 points. Once the course drops to around 4452 points, there will be new opportunities to enter the market.
Happy weekend!

SP500 hit major fib level from 2008SP500 just hit major fib level from last top of 2008.
As you can see it hit 4545 which is 4,236 extension.
What happens from here?
My bet is down and finally and end of 13 years long bull market.

sell #NASDAQ at 15380 and take profit at 15190sell #NASDAQ at 15380 and take profit at 15190 in next 72h max 190pts profit guarantee.(no stop loss in that case,at least if he up 100 pips more u add 1 lot in sell.if you can assume this trade do it and you will pass a better week end #dowjones #xauusd #eurusd #sp500 #USDJPY
euphoraia so much
need to pullback
overbought
Jackson hole in nest 48h ....
free money
if he dare to up back 70-100 pips from now ,add 1 loy but no stop loss.believe me

INDEX - Nikkei 225 - Model ForecastModel Forecast for NI225:
- Line of Least Resistance EW Corrective Wave found.
- Wolfe Wave at Top Distribution Level.
- Weakening rally rejected at top of channel.
- This time the support will break.
- US Markets to follow.
Soon the V's will stop. Easy come easy go.
GLHF
- DPT

Is your money worth reading "maybe´s"Hello Trenders,
Been thinking a lot to or to not publish this signal. Many of you expect a deep on global level, therefore I here show you some mathematic forecast.
This may not be the end of the world, yet it is far worse than the most downbeat forecasts. The evidence to support this outlook is in plain
sight. Some sixth-grade math is a good place to begin the analysis. Make 2019 economic output 100 (the actual figure is $22 trillion; “100” is
100 percent of that number; a convenient way to measure ups and downs). Assume output drops 20 percent over the second and third
quarters of 2020 (many estimates project larger drops; 20 percent is a plausible if conservative estimate). A 20 percent drop for six months
equals a 10 percent drop for the full year, assuming the first and fourth quarters are flat on net. A 10 percent drop from 100 = 90 (or $2.2
trillion of lost output).
Since 1948, U.S. annual real growth in GDP has never exceeded 10 percent. Since 1984, real growth has never exceeded 5 percent. The
highest-growth years since the end of World War II were 8.7 percent in 1950, 8 percent in 1951, and 7.2 percent in 1984. An assumption
that real growth will occur in 2021 at a 6 percent annual rate is a generous if unrealistic assumption. Such growth would qualify as a Vshaped recovery.
If our new base is 90 (compared with 100 in 2019) and we increase output by 6 percent in 2021, this brings total output to 95.4. If we
enter 2022 with the new base of 95.4 and increase that base by 4 percent (so, 95.4 × 1.04), we come to 99.2 in total output by the end of
2022. Here’s the problem. Using 100 as a baseline for 2019 output, and assuming 6 percent real growth in 2021 and 4 percent in 2022 (rates
of growth that have not happened on an annual basis since 1984), the economy does not get back to 2019 output levels. The hard truth is
that 99.2 < 100.
Source : The new great depression (2021).
What about if we really have a second wave harder then the first with mutatied covid?
I want to add, is not my intention to spread panic or "maybe´s" but the study got my attention.
Even the legends will have trouble surviving if this happen.
So how can a trader survive in this case condition by trading as only source of income???
Perhaps agricultural commodities will always perform....

Wedge break out and back test or Head and Shoulders S&P500Looks pretty ugly to me. Intraday's don't look that great either. Longed UVXY looking for a quick swing. Following yields, watch TNX. If wrong, will suck, but them's the breaks.

SPX S&P500 Support to holdCoronavirus cases up 37% over the last seven days to 203,082 in the U.S.
The resurgence in Covid-19 cases around the world could slow the economic growth.
My price target for SPX S&P500 is the $4160 support

Uhh oh...BEARS UNITE!!!
Bulls better cash out their chips while there's still money in the casino!
I shall use their tears to sweeten my tea and their pride to butter my biscuit.
(Not financial advice)

SPY traders & investors: BE CAREFUL!This is not investment and financial advice. Please be careful and protect yourselves
Trade safe,
Atilla Yurtseven


S&P500 - Are we too Vertical?Jeremy Grantham recently says a bubble means crazy behavior, Ray Dalio explained in his video we are in difficult, Housing price too high, inflation jumped high and rising of IR fear ticking the clock. Micheal Burry famous in deep digging and in his recent tweets like he going to warn again.
But if we look technical we can say we are too vertical and this pile can slip. How far we can go still a mystery but when market slips it takes very short time and from SP500 entire history we can learn how many time it correct itself 10% to 20% , and if crash it will cross 20%.

HUGE Accumulation of GOLD - Wyckoff Method in Play Hi Guys, as we can see there is some accumulation happening of Gold. Right now Wyckoff Method is playing exactly like the method suggest.
If you look at the Accumulation Schematic #2: Wyckoff Events and Phases, We are continuing the last accumulation Phase of D.

SPX SPX500 it does not get any more precise than this#SPX #SPX500 it does not get any more precise than this

Here's a top, there's a top, everywhere a top top!Upward trendline support was broken last week.
Today we near perfectly retested the bottom of that trendline.
Should proceed lower tomorrow, but if we shoot up above $4250, I'll admit defeat. But just for this battle. Not the war.
(Not financial advice)

SP500Playing around with this count on the LT weekly chart from b4 2000 dot com bubble. SP500 looks like a very clean 5 up & 5 wave down pattern 1 after another. I am sure that if we dial down into the LTF we could find many complex Flat & zig zag corrections but zoomed out everything looks pretty clean.
The W3 that we are currently in lines up with 4600 rough target. I know a W4 is coming but the fib 1.618 lvl is really a better target for W3. So maybe SP500 continues up for now until 4600 and after that W4 will ensue. Hard to tell but I don't see W4 forming as of yet even with all the bearish inflation narratives.

SHIBBUSD - KEY TURNING POINTGood morning, everyone!
Shiba Inu is about to get listed on Coinbase and, as you can see on the daily chart, the price has just found support on top of the first medium average line (on lighter red).
I had previously pointed out that Shiba had found its support around the 00000650/00000700 values, after the big drop that followed its Binance listing, and I also pointed out that we were getting more and more signals of a potential reversal.
On my last post, I pointed out that the price would have to wait for some media attention by getting listed on RobinHood, for example, where there is an online petition that already has 150000 signatures asking for that.
Well, we haven´t seen it listed on RobinHood yet, but yesterday Coinbase announced that it was going to list Shiba Inu, so its probable that we will see a big boost to SHIB in the near future.
All though this is an idea for SHIBBUSD, I have to point out the overall market behaviour in the last couple of days:
- We are living in a very unique period, and after the major shift of the last couple of days, it is highly likely that we are already experiencing a pullback and correction in the world markets.
Yesterday, the SP500 index has just had its first breach on the major upward trend line that had been unbroken since the beginning of its recovery after the Covid19 market crash in March 2020. This index regulates the prices for all the 500 big cap companies that are inside of it, and all of those companies prices depend on the movements of their index.
This being said. I would advise extra caution during the next week in terms of investments because, apart from the eminent Wall Street market crash that I strongly believe that we are about to experience during the next 2 to 4 weeks, with a correction of 10%, to say the least, and the potential start of a harsh bear market due to inflation and rising rates, just to name a few, it is highly likely that its effect will spread to crypto and that any investment right now is of very high risk.
Conclusion: Shiba Inu is about to get listed on Coinbase and the stock market is likely to be crashing hard, so choose your investments wisely and stay safe riding the markets out there.
Have a nice week.

Short SP500? [SPY] & [SPX]AMEX:SPY
I've been checking the fibos and the way USA keep inyecting money to their private sector and... Well SPX is yelling (IM GOING TO FAALLL!!!)
I really have not more to say that this is just the way I feel and you should pick it with a grain of salt~

Swing short SP&500 / Here we come to our goalHere we come to our goal . Now only short . Everything can be seen on the graph. Everything goes according to plan .
