SP500Looks like we are starting the W4 correction which will lead to the final push up to 4700-5000 sp500 EOY TF.
Sp500short
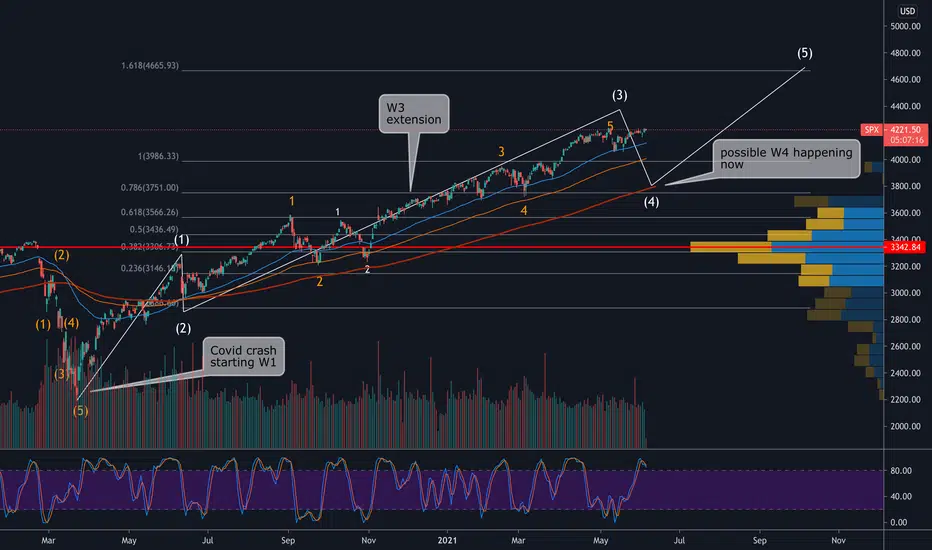
S&P 500 CONSOLIDATION up to 4050 Just a simple 4 th wave FLAT correction, BULLS wanted to take some profits on the table before half year ending,
5 Wave ''C'' will emerge from today with maximun pullbacks(80%), Enjoy trading with known direction until 22ndJune

I'm waiting for such a movement from SP&500 . SHORT . Intraday .Everything can be seen on the graph. We are waiting for the approach to the price to the zone of interest, if it does not interrupt EQL .

SPY Bear MarketBig money doesn't buy weekly options. They tend to think in terms of quarters and years. I believe this February was a peek into their underlying pessimism and just how readily they can dump positions at the first sign of fear. Of course, in a controlled sell-off there would be bear market rallies and selling into strength. Going forward I expect most of the gains in the past 4 years to be wiped away. You can focus on momentum divergences and a bleak economic state or the current polling for the presidential race. Biden has already stated he will completely unwind Trump's tax cut which is arguably the only piece of legislation he's passed in 4 years. There are plenty of economic boons that Biden offers as well, but we can expect the tax cut to be unraveled before the positive impacts of change occur.
As with all technical analysis this is simply reading tea leaves. However, I'm personally going to trust deep selling more than strong buying for the near future. Don't bet the farm on short term index puts, but prepare to hedge and cut losers on any macro level weakness that may arise in the next few months. I will definitely be watching the DIX index and the Repo schedule for any signs of institutional selling or banking weakness and dipping into long vol ETF positions when I feel a hedge is necessary. Good luck out there, a VIX near 30 has the market swinging 2-5% in either direction damn near every week these days.


SP500 - SHORT; Nothing but Shorts (SELL!!) here!A ~25% decline from here should be rather quick and uneventful. However, such a decline is likely to be just the first leg on a long road to a full ~70% decline by the end of this full cycle. - Which would be nothing more than a garden variety return to the Historic Norm ! The same goes for all US Indexes and those who are historically informed (or reviewed the evidence, presented in virtually every single recent post) should not be surprised at all.
The Carry Trade Currencies - and equivalents relative to the VIX post;

SP500 Possible crashI was studying lastest SP500 drops and it is possible to predict a huge crash in AGO-21.
-not a financial advice-

S&P 500 Priced in Euros closed below 50 day moving average......and broke medium term uptrend.
Why does the S&P 500 priced in Euros matter?
Critical to understanding this idea is understanding that due to the nature of cross-border investment flows, debt markets and equity markets in other countries are about to have a massive impact on the United States markets.
Since the markets melted down last March, market valuations have gone sky high along with global debt. In the book Panics, Manias, and Crashes seventh edition, the authors talk about how bubbles as a fundamental feature of human history. But, specific to the last 4 decades since currencies have completely dislocated from gold have, bubbles have accelerated to occur every 10 or so years. The bubbles have occurred every 10 years is an imbalance in the flow so investment capital to countries and the impact on currency. Foreign investment capital flows into a country when its exports rise—which means its companies are growing in sales, which makes these companies attractive investments to foreign investors. When money flows into a country to invest in its companies, the country’s currency appreciates as foreign investors buy the currency of the host country. This presents a dilemma to the country’s exporters companies as a currency increase makes the cost of their exports go up. What ends up happening is the country’s companies and investors, either by choice or by a government mandate, buy foreign assets which has the effect of making their currency and their export prices go down. This is how foreign exchange rates are balanced, however, the imbalance does not go away it simply gets transferred to the debt market. Simply put, the new fortunes of the companies in a country that receives massive and flows of capital cause investors to borrow more than they should. Debt is not a problem until it is. When it becomes a problem, investors need to sell their assets faster than they can find buyers. This causes the price of assets to go down.
We are living in a time of extreme asset valuations and debt. Just look at the rise of bitcoin, Tesla, GameStop, and so many other junk assets in such a short time coinciding with the rise of margin debt and record corporate debt. The reason for such a historic rise in prices is the money printing done by governments around the world during covid. This cannot go on forever in every country. Perhaps the federal reserve in the United States can keep it going till 2023 like they say they’re going to do. But other governments have already stopped their massive eating programs due to inflationary pressures and other pressures. This is likely to cause an in balance in cross-border investment flows. This in balance is likely to cause currencies to rapidly rise and fall against each other, which might result in mispriced debt to assets which could make debt be worth more than its underlying assets triggering margin calls and unexpected interest rate rises. When buyers cannot afford their assets, this triggers a deleveraging.
Much of the world plays the American markets in Euros -- think German savers who are getting negative interest rates on their personal savings, Middle East wealth funds, and European institutions. (Europe is the largest importer of US goods.)
My theory is that international investors are in charge of US markets at this time, and given that the S&P 500 priced in Euros has broken a medium term uptrend and 50-day support, we may be staring down the barrel of a deleveraging event.

SP500Looking strong, if your short please consider some psychological help from a Doctor asap. SP500 looking ready to pump to the moon IMO.

SP500 Final Top??... Only SHORT Entries from here!!Expecting an initial -25% drop, then an additional -60%. (For a total of -70%, minimum - full cycle!)

What Does Biden’s Tax Hike Proposal Mean for SP500Traders are digesting news that Biden plans to double capital gains taxes on the wealthy. As result, SP500 lost $30 in one trading session. However, it recovered the next day. The proposal has not been officially announced but details reported by Bloomberg include raising the top marginal tax rate to 39.6% from 37% while lifting the capital gains rate from 20% currently to 39.6% for people earning $1 million or more.
Fundamental analysis
Democrats planned a tax hike for a long time. So, it wasn’t that big surprise. A big question is when the rate hikes might go into effect, which would likely impact decisions on when or if to book profits from the market. And that’s what we all want to pay attention to. Meaning, if a big tax hike is coming next year, could we see a selloff this year with investors looking to ensure the lower tax rate?
And what if the timing is different? Stock bears have been warning for a while that investors were not pricing in higher taxes ahead. The market reaction last week was relatively mild, with markets down overall but the major indexes all lost less than a full percentage point.
Congress has to approve the tax high. And I believe it will be not that easy. It will likely find no support from Republicans and possibly many Democrat defectors. So the early consensus in Washington seems to be that these tax increases stand little chance of passing at the levels being suggested. It will be interesting to see if Wall Street agrees as more details are revealed.
President Biden is expected to unveil the proposal next Wednesday, April 28. Keep in mind, the White House has already announced a plan to raise corporate taxes to 28%.
Economic reports
Economic data last week was a sort of a mixed bag. Initial jobless claims posted another decline to hit the lowest levels of the pandemic. However, there are some signs of headwinds for the housing market with Existing Home Sales falling for the second straight month but inventory levels are at record lows, so it’s tough to draw a negative conclusion. Housing supply did climb nearly +4% last month but it was still more than -28% lower than 2020 levels.
The Wall Street Journal pointed out that, nationally, there were more real estate agents than there were homes listed for sale in March. At the same time, the median home sale price rose to a new record high of $329,100, marking a +17.2% gain over last year as supply constraints have led to the fastest selling pace on record.
What to look for next week?
Things kick into high gear next week though with announcements from some of America’s largest companies, including Tesla on Monday, followed by tech giants Alphabet and Microsoft on Tuesday, Apple and Facebook on Wednesday, and Amazon on Thursday.
Other big names reporting next week include AbbVie, Agco, Altria, Amgen, AstraZeneca, BASF, Boeing, Boston Scientific, BP, Bristol Myers Squibb, Caterpillar, Charter Communications, Chevron, Chubb, Clorox, CME, Colgate Palmolive, Comcast, Dominos, Ebay, Eli Lilly, Exxon, Ford, General Electric, Gilead Sciences, GlaxoSmithKline, Intercontinental, Keurig Dr. Pepper, Kraft Heinz, Mastercard, McDonalds, Merck, MGM Resorts, Mondelez Int., Moody’s, Nio, Norfolk Southern, Northrop Grumman, Novartis, O’Reilly Automotive, Phillips 66, Qualcomm, Royal Dutch Shell, Shopify, Spotify, Starbucks, Texas Instruments, Thermo Fisher, Twitter, UPS, Visa, Yum Brands, …among many others.
Data to watch
Nearly every sector will get some coverage which will help analysts and investors get a better sense of what to expect from the rest of this earnings season. It will also help shape expectations for the quarters ahead as more companies provide full-year guidance.
Next week also brings the Federal Reserve’s two-day policy meeting on April 27-28, which comes amid a busy economic data schedule that includes Consumer Confidence Tuesday; the first read on first quarter GDP and Pending Home Sales on Thursday; and Consumer Sentiment, Chicago PMI, PCE inflation reads, and Personal Income and Spending on Friday.
SP500 technical analysis
SP500 futures found support near 4100 last week. In the absence of big news, we can expect it to hold. However, Biden’s tax proposal can shake the market. So, I wouldn’t rely on that support much. Advanced Decline Line shows signs of weakness. However, there is no clear divergence. If the price sustains above last week’s high, 4250 is the next magnet. But as I mentioned above we may see big volatility next week. So, I don’t trust those levels much.
The range 3950 – 4000 is technically more important and more reliable. However, with cycles turning to the downside and ADL showing signs of weakness, tax proposals may be catalysts for sell-off. Yet, in the absence of clear signal, I think traders have to stick to Gann levels on an intraday basis.

SP500 correction begins.SP500 correction begins. News today that Biden would raise the capital gains tax on wealthy Americans to 39.6%, double the current rate. In my opinion, it will put a stop to last week's rise. Technically, I expect a correction of nearly 3.5%. In fact, I expect a downward move between two ATR axes. With a target price of : 4016. 1 usd


SPXI think a nice correction back here to the inverted head & shoulders neckline is coming. Would be super bullish and set up for the next parabolic move towards 4600.
We have the Fed buying bonds 20-30yr in order to implement YCC. We have also the fed stating the inflation is not a concern. (Which is B S IMO)
We have a reopening economy, entire world soon to be vaccinated if not already and Trillions of dollars in stimulus money floating around looking for a vacation and some DOGE coin entries.
Don't be a stupid bear and buy the dip like BIG MIKE Fam!
As always BIG MIKE PERMA BULL loves you guys and hopes we all get rich AF. ;)


sell at 4080 with 3tp till 3993maybe a double top formation at a high level
a bearish rsi divergence formation
a legit profit taaking by investor
a pullback on psy level of 4000

SP500This looks Short term toppish to me guys I expect a break thru and a run to 4600 but to expect a quick push to 4600 is a bit naive IMO

SPY To The Downside After that nice little end of day rally on Friday I'm looking at a price target of 385 - 380 by this upcoming Thursday to bring Spy down to the 50 or 618 fib levels. QQQ is ahead of SPY just a little in regard to fib retracement. Recently had a big upswing off of the 50 fib to above 23 fib before having an aggressive sell of > -2% in one day straight down to the 618 fib before another small rally up. EOD spy rally pushed it right above the 23 fib. Intraday charts also suggesting buyer exhaustion. Will be interesting to see if the suez canal crisis will play a "role" in market movements next week. Look forward to your thoughts. Thanks!

SHORT DOWJONES SELL DOW JONESBuyers are now getting weak . Profit booking started by Big Players. Short Sell Dow Jones. Now Bulls traped on each level. April month will in the name of Bears.

You know(!!) you are in a bubble ...... When:
The funding a 36-year stream of expected inflation-adjusted spending requires over 38 years of money up-front;
Every single decile of S&P 500 components is at record valuation extremes; www.hussmanfunds.com
The amount of leverage in the system (U.S. equity markets) is now easily the highest in history, by any measure, not just in absolute terms! (relative to GDP, etc. Margin Debt/GDP = Margin Debt/Market Cap x Market Cap/GDP Showing insane over-valuation across the board!);
In a world where speculators now value the stock of bitcoin at one-fifth the value of the entire U.S. monetary base;
The current SPAC mania is identical to the South Sea Bubble in as much as: "Let them see not what they do!";
In an economy with $11 trillion in corporate debt at $58 trillion in equity market capitalization;
When U.S. Market Capitalization exceeds 263% of U.S. GDP (the norm, not the low, being 78%);
Anyway, this is likely a Double Top here.

SP500 - The Phantom Menace (Episode I)As can be seen in the graph, after the pandemic, it collected rapidly and it seems that it will continue the rising wedge movement to the end.
If the targets for the future will not be 4000+, we can see a very sharp decline as a result of the rising wedge formation from here. In this sense, it would not be wrong to expect the prices to fall back to 3000 levels due to the formation target. However, this 25% decrease would be a disaster for the financial markets.
The place to enter the game is as important as where and when we exit the game. It is useful to be careful, especially in light of these inflationary expectations. TVC:SPX
It contains only personal views and opinions. Does not contain legal investment advice ...

SP500 Lifetime OpportunityHi there,
SP500 at the moment is a clear buy with target above 4000
If we pay attention to the DXY chart, we are starting a uptrend but still on sideways moment, which SP500 due to many retails shorting it, has been making new highs every week, as long as dollar is weak it will keep doing it, but dollar is soon ending this sideways market to start an uptrend.
SP500 then will top at that moment
If we look at the elliot wave theory, we are in the final phase, Blow off, close to a top to begin then a new trend.
This is a long term view, if your looking to sell it, sell only at the mentioned wave 5, near it.
Good luck

SPX500 Short SetupSPX500 Short Setup
🔵 Entry: $3,885.0
🟢 TP & RR: $3,787.4 (1.91)
⛔ Stop Loss: $3,936.1
Trade Reasons:
✔️ Price bounced off the upper trendline
✔️ Price still ranging within the triangle
✔️ Somewhat overbought levels
