Sp500short


SPX SHORT 6R - Is the top in?Last week the SP500 broke MS on the daily timeframe imo. This is my signal to look for shorts instead of longs.
As you can see price has returned to the daily/4h OB and is showing bearish signs on the LTFs.
Invalidation is clear.
1% risk

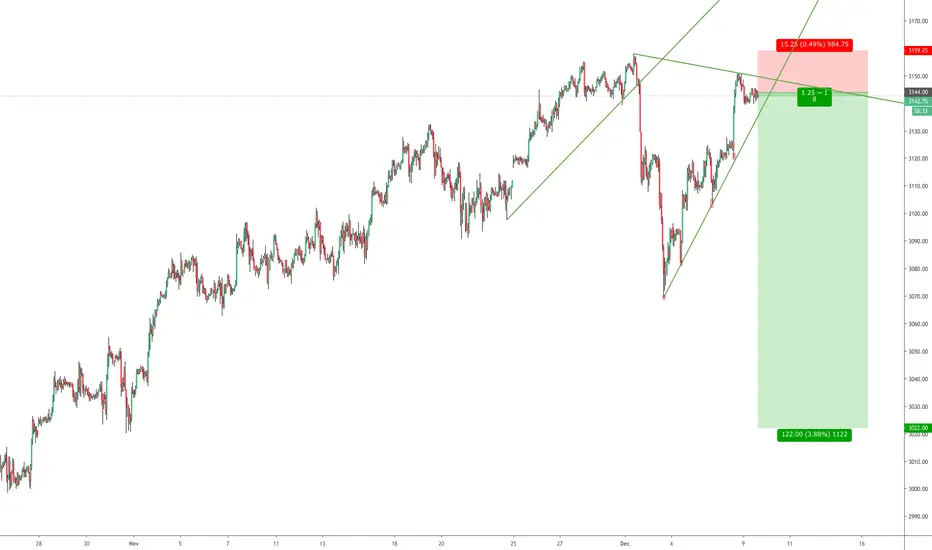
F_ES Short Setup. 1:8 Risk to rewardI know this sounds crazy. 1:8 Risk to reward? Winning probability of this trade is less than 25% maybe less. However x8 sounds crazy and i would like to take this trade. I have shorted 4 micro contracts.i will update this this post accordingly.
Disclaimer: This is not financial or investment advice
Trade safe
Atilla Yurtseven
#SPY $SPX500 Weekly Hanging Man CandleAre the Bears getting their Paycheck finally?
Last week's SP500 candle closed with the shape of what Trader like to call a “hanging Man Candle”
This Candle shape is normally seen as a reversal Candle.
On the TomDeMark Indicator the hanging Man Candle was on a 8 of 9 Count what is just saying that this upmove is coming into an area where the probability of at least a pullback is more likely to happen.
A Weekly Reversal Candle signed with a DeMark 9 Count would be textbook DeMark indicator Trading, but looking into the past the DeMark Count on the SP500 Chart it didn't actually worked that well on this Index. Most of the time the price already pulled back on a 7 of 9 or traded for 1-4 candles after the 9 sideways or up before initiating any sort of direction change.
But regardless of the Count trader that following the DeMark Sequential indicator cant ignore the situation that we are currently in a realy extended Move.
Past Weeks were totally crazy looking into the lower timeframes reacting to every Trump Tweet like a lunatic.
The Weekly Stochastic is at high levels in the Bullish Control Zone and already Crossed to the downside.
RSI is hovering below the Bullish Control Zone (65-80) above the RSI
The MFI is not giving us any clear divergence on Weekly yet but it is retracing while price action is crawling up.
Looking at the Weekly EMA we touched last week the 10 EMA.
If we see this Weeks Price starting to decline I would like to see the Price at least Pull back to the 0.236 Fib level or the Weekly 50 EMA around 2950.
I am currently holding Shorts with an inverse ETF and will probably close them in this Target Vicinity.
Trade Safe!
===============
Koboltrading.com

VIX Indicates a Drop in SP500Every touch of the trend line has been followed by a smaller spike then a much larger one. Most recent touch was a false breakdown and quick rebound just above the trendline... Crude oil typically rises and falls with equities. USOil just fell from $58 per barrel to $55 per barrel on Friday (5%). Expecting equities to be very close to a top and should move down a decent amount...
Thanks for checking out this idea. Open to constructive critiques or questions. Feel free to like and follow!

short #sp500 at 3148 with 3 TP until 3098 so 50 ptsshort #sp500 at 3148 with 3 TP until 3098 so 50 pts a huge profit but will go more deep later for now i talk only pullback UP TO STRAIGHT SO FAST FOR NO REAL REASON

SP500, its time to take a short ;)We are in the top of the channel and have a clear signal to sell SP500
A partial TP is clever in the low part of channel and SL just over the top.
You can keep a part if you are bearish or just reverse you position if your are bullish on it
Cheers

Winter is coming... SP500 #GameofshortsLogic:
Institutions have shown heavy dumping activity, all that's left is to flush the buyers out.
Every time we make new highs we get a drop . This high looks very convincing doesn't it?..
There is no volume currently in the market, we have a Three Drives , and Deep Crab Pattern completing. (Both Bearish)
We have almost completed a full year of institutional trading.
Winter statistically is a bad performing season.
We are heading into elections. A time of uncertainty...
I'm looking short, only after confirmation. If we get an entry it will happen FAST. Definitely expecting volatility.
Disclaimer: I'm not an economist.


Still Caution, Even as Market Has Rallied - S&P 500 analysisAfter U.S. President Donald Trump renewed his tariff threat against China, U.S. futures contracts — including for the NASDAQ, Dow and S&P 500 — retreated from their all-time highs. As well, this morning, exacerbated by the roiling unrest in Hong Kong, global shares are a sea of red. Sentiment itself is fragile and will likely follow prices.
The S&P 500 has initially pulled back during trading on Tuesday but then shot higher to show signs of strength again. By doing so, the market looks likely to try to break out of he current bullish channel that it’s been it for some time, and as a result we could get an explosive move. That being said, there is a certain amount of overextension to what we are doing right now, so don’t be surprised at all to see a pullback in the meantime.
The market could find quite a bit of support near the $3050 level on a significant pullback and will almost certainly find plenty of support at the 3030 and then the 3000 levels.
Looking at this chart, there is an undeniable uptrend going on, so obviously there will be a lot of value hunters underneath to try to take advantage of cheaper pricing. On the upside, the 3100 level decisively is the next resistance (upper line of the channel is around $3137). If we see a clear break there, then the market will make its move towards the targeted $3200 level above, based upon the ascending triangle that we had broken out of at the $3030 level.
Wall Street's main indexes have set new highs this month on the back of a strong corporate earnings season and hopes of a trade deal with Beijing to end the damaging 16-month tariff war. But the main question now is will rally be able to continue without earnings support? What do you think?

SP 500 ShortLooking to go short on the SP500, We will be wrapping up the year of price action, we will be heading into elections, and Fed Powell was very optimistic about America today.
I believe the economy has hidden weaknesses.
I'm not an economist, but I'm taking this short if there is no volume up here. We will also have a three drives pattern completing with bearish deep crab.
We trade for moments like these right? #thebigshort


VIXY - Waiting to POPThe longer VIXY is held down, the stronger it generally pops.
Good hedge against SPY downturn.
Use dollar cost average to pick up a few shares every day or every other day. These turn great profits in short time.
Options are also cheap. I recommend monthly's here which give you time for either a pop or a slow 7-10 day run up (plus extra time).
I am a buyer of Calls here although you could sell Puts and get the stock cheap if your option fails. Good either way :)
When the recession does happen using VIXY with GDX and SPY (shorts or puts) I believe will turn profits even in down market.
FREE Resource for those inexperienced with options -
www.optionseducation.org
Thank you for liking, commenting, throwing up a chart, following, or viewing.
I am not a financial advisor. My comments and reviews are based on what I do with my personal accounts.
Disclosure - I am long MARA, GBTC, BTCUSD, GDX, VIXY.

SHORT S&P 500„Goin‘ against the melt-up trend?“ vs “Profittin‘ from substantial overbought market situation?“


SP500 - SPX - To Move Lower, Recession Awaits Pt 2 As stated as an update on my previous post, we have moved toward the option of tracing highs to 3040. This is now looking like the most likely option, making one last touch before heading down at or before October 11th (projected). This is where several strong lines of support and resistance meet. This option looks likely as we could be setting up for another ascending triangle to reach that new high of 3040.
Another option is to over extend into the 3080 area where a bull trap is set and moving lower from there.
Either way, October is showing many similarities to the Great Recession stock market crash. Treasury 10y-3mo looks to be inverting back positive soon also.
Last option is that we have made a double top and will move lower from here.
Overall, I don't think it will move higher than 3100, the only way this is possible is if trade talks are fully dealt with. I think what will happen is October talks will come around, there will be no deal since both sides are stubborn (one more than the other) and we will move lower by December, possibly replicating what happened last December.
Remember, strongest RSI divergence on ALL graphs - this must end at some point.
Here is my final prediction, will wait for October 11-25th!

S&P 500 Short 90 Index PointsHello Traders,
A rising wedge can be seen in ES1! (S&P 500) and I believe that it needs to make a correction so a breakout to the downside is to be expected. There may be another upside move and for that reason, a 30-point stop loss was set along with a 90-point take profit just around an identified key level. Furthermore, this trade idea supports our XAUUSD (Gold) long trade which stop loss will be updated in a moment.
Cheers!
Riverfront Capital

#SP500, Great movement on the way? Serious resistance at $ 3030 that succeeded in 3 attempts.
At the moment in H4, a double top template was created
Stochastic at maximum level with the intersection of lines.
For all of the above reasons, we recommend a sell trade with a target of 2940 and a target can grow as the SP progress.

SP500 Short the resistance retest. Decent R/R ratio. Daily chartShorting this second resistance touch on SP500.
Reasons:
Second touch on resistance
Bearish RSI
Dropping bullish volume
Decent R/R
Strategy:
R/R = 2.81 or 4.23
Entry: around 3010
Stop: 3054
Target 1: 2888
Target 2: 2819
Please follow and smash the like button to support my work and see even more free TA :)
Trade safe friends!


There is no reason to grow | Short S&P 500The announced program of liquidity support in the market from the Fed was not reflected by the growth of the index.
In advance of trade negotiations, China announced that it would not raise important issues during the discussions and would leave the United States ahead of schedule. This suggests that negotiations are unlikely to succeed. And the negative information on the market may force the index to decline.
The upcoming US rate cut is already in price. Which means that the fact of lowering itself will not give a boost.
Short S & P500 medium-term idea. Goals three.
If the index grows in short zone, you can get the position.
There is no stop-loss, as there are possible shake out/
The position can be modified.
