Home Depot DivergenceHome Depot is a stock that loves bull and bear divergences in technical terms. There have been 3 bullish divergences since 2022, all of which have brought an average return of around 25%. The last divergence is now in place and a potential 25% return would push the stock over $400.
Sp500short

ICT Short setup SPY swing trade, retracement trade👋Hello Traders,
Our 🖥️ AI system detected that there is an H4 or higher timeframe ICT Short setup in SPY for Swing trade.
Of course SPY is in up trend in Daily chart, so this is a retracement trade for reference.
Or you could consider to buy SPY after reaching the demand zone marked on chart.
Please refer to the details Stop loss, FVG(Sell Zone),open for take profit.
For more ideas, you are welcome to visit our profile in tradingview.
Have a good day!
Please give this post a like if you like this kind of simple idea, your feedback will bring our signal to next better level, thanks for support!

sell sp500 at the price u can get with many targetWIth all happens in the world and market are full crazy broking record high after records high and while Fed not cut rate yet.
+ US electrion in November
+ the Summer coming
i think it have to have a legit pullback before US election and even if fed cute rate i think we wil be in buy the rumour "actually happening since month " and sell the news when it happens
there 4-5 target..at each target you just put you stop loss at the last target in case it not go to final target u keep huge gain.
so for the stopp lost..as we not have any resistance you can manage as your own Risk ratio.
Personally i have a good balance and i wontmake any stop lost,but instead each 100 pips up i will aff 1lot in sell,coz this market is so crazy and i will take my cake at the end
if the pullback not happens before us election i will update in comment what to do

Nasdaq, DJ and SP500 selling has startedIn my opinion today the market shifted from buying to selling. The shift was mostly obvious in DJ30 but I think all will fall heavily this week.
Disclaimer: Not a financial advice. Do your own analysis before investing or trading

S&P500 ForecastS&P500 Currently, there is a bearish trend projected to reach 5190 from the pivot point at 5225. However, if it breaks above 5245, confirmed by a 4-hour candle closing above this level, it could potentially target higher levels at 5261 and 5280.
Key Levels:
Pivot Line: 5225
Bullish Lines: 5245, 5261, 5280
Bearish Lines: 5190, 5168, 5150, 5099

SP500 Mid term planOur friend Fibonacci is showing up a possible next move for SPX. Actually is ranging exactly on the 1.618 level of the last leg, and usually this level to a retrace till the level 1. There we could probably see a reversal that could lead the price into the resistance area at 5250, but it's probably too early for that

SP500 in the hammer zoneSP500 reached a strong reversal area where price reacted in the previous week. I was expecting a little pump in my previous ideas, and honestly i wasn't expecting it to rise so much. But i am holding my short trades and i am adding more here, consider i expect a selloff this month. First target the support zone at 4990

SP500 Everything goodSP500 is on track and is following the idea i shared some days ago. I expect a continuation of the drop till the 4800-4900 area, and probably the target will be hit in May/June. Here i will look for longs to hold till Q4 2024. Updates will follow

SP500 Main targetSP500 is looking bearish, and i think we will see a major correction in the next weeks. I have my main target at $4.750, were the price could bounce back up. I will enter short with small size and i will add shorts if the price will go up, invalidation above actual highs at $5.300

SP500 H4 Projection Price is clearly in a bearish trend. Price also has fair value gab and unmitigated order block zone. So initiate short positions near the order block zone after finding a strong bearish price action structure. Analysis trend is invalid if the price breaks and closes above the trendline. Good Luck.

Target hit for SP500My short plan for Sp500 worked out perfectly. I shared my view some days ago and adding shorts while it was going up paid out. Actually i closed all my shorts and i am looking to enter long. I think that a pullback is on the way

What's next for SP500?SP500 has made a nice drop like i predicted in my previous idea. I expect a little continuation of the drop before a pullback that could lead the price to the resistance area at 5250. Here i will look for a new short in the next weeks.

ES1! S&P500 PREPARE NEXT WEEK - IMPORTANT PRICE POINTS - DAILYThanks a lot you the likes, really appreciate! It is not financial advice just recreational trading idea sharing
____________________________________________________________________
- 5332.5: price point identified as potential optimal entry for short direction trade. Depends on the velovity of the market when if hitting that price point again.
- 5168.75 to 5190.75: probable important zone where the price can pullback up or break with strength.
- 4938.25: Possible down important price point as we can only look behind and in prices lower than the actual price. Above the actual price it is not possible to see where the market can go. So market will do what it has to do if evolving above 5332.5 .
- Some other zone down there but it is not to analyze yet has there is too many important price points above it.
Probably observing what the market does from Monday to Wednesday and see which entries can be done on Thursday/Friday for next week.

SP500 Expecting a dropI think SP500 is on the way to perform a great drop. Looking on H4 timeframe we can see a clean break below main trendline and a retest of it. I think today we will see some volatility around the beginning of the NY Session. I expect a fake moves first to the upside to grab some liquity, next we should see a drop till support zone around $5130

S&P 500 June Futures Expecting a large downside to unwind and target 5120 level or below. which is a good liquidity pool resting downward and we have seen a nice market structure shift after taking out the buyside liquidity

Three tracks to the bottom (cont)This is a follow-up to my analysis from the other day. The green track is the one for the 1968 model. It has held pretty close to the entirety of the whole correction so I favor this model for now. The 2018 model is pretty good. It is the yellow track. It was a short duration but had the lowest bottom. This would give us a bottom around 2700 which most of my other models are no longer favoring. It is good to see, but I am not favoring it as much as the 1968 model. The final model is the 2005 model and the magenta solid path. This model has one of the higher tops over the longer period of time. I do not like this model but it is possible. I figure the drop will be quicker and go below the prior low from October 2022. The 2005 correction did not see C go below wave A's bottom.

ES SP500 ShortMonday's price action saw ES/SP500 trade above Fridays highs, but failed to displace above Friday's high.
My bias is for price to trade to Monday's low.
I am looking for H1/H4 bearish levels to be respected, and will then look for m5/m15 entry once I see premium bearish arrays are being respected.

SPY to $460Overview
Utilizing trading patterns and consistencies between several technical indicators, I believe the equity market will begin to unload soon as traders collect their profits from the recent rally and prepare for the next FOMC meeting on 19-20 March.
Trading Patterns
SPY is currently undergoing a rising wedge which is a bearish trading pattern. Within the wedge, I outlined an impulse wave pattern which shows SPY at what may be the peak of the third wave. Rising share price on dwindling volume, in addition to divergences spotted on the RSI, MFI, and MACD, lead me to confidently believe a dip to around $460 is approaching.
Price Target
I used the support and resistance lines of the macro rising wedge to determine the paths of the impulse waves, assuming their troughs and crests will reach the respective lines. Presuming the rules of impulse waves hold true then the fourth wave cannot end pass the crest of wave one, which falls in line with the 50% retracement level of the third wave (blue and red Fibonacci tools). This level rests at a share price near $460.
Utilizing a larger Fibonacci tool to encompass the entire rising wedge and a projected fifth wave crest as 100%, the $460 share price is around the 61.8% Fibonacci level (when used in the uptrend).
Supporting Technical Indicators
The MACD shows a divergence as well as an approaching cross over its signal line from above.
While not as prominent as MACD, the RSI also shows a divergence between the share price and peaks within the RSI oscillator. I've highlighted the divergence by placing a horizontal line at the end of the first peak. It is also reflecting overbought signals.
The MFI shows a sharp negative slope but the SPY share price is still rising. This divergence, aligned with the signals of the other two indicators, suggests the share price may be about to drop.

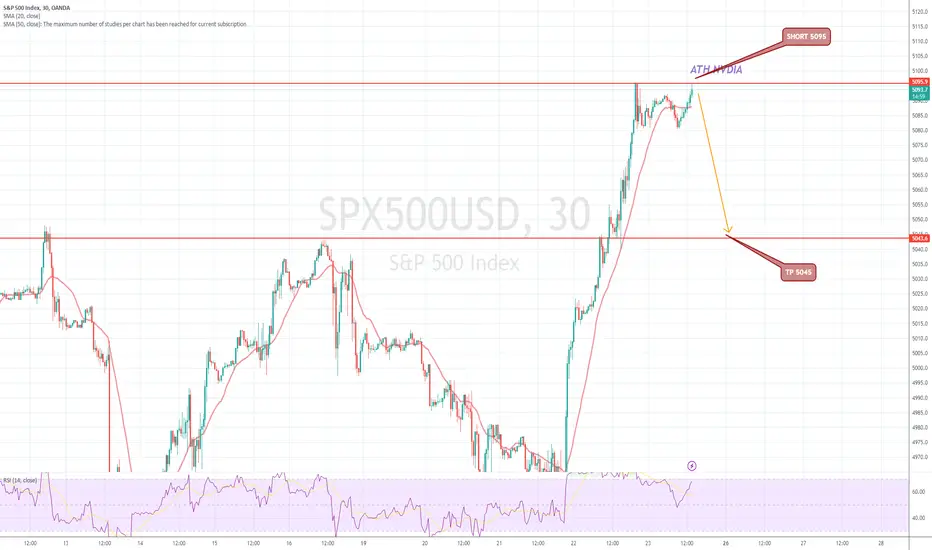
hshort 5095 take profit 4045 foir newt week aheadoverbought in many way
market not care at all the odd of rate cute that noiw are in may-june and
% for march
all tha panic buy for 1 stock nvidia
while we se inflation data backed up
we see job number very good
and market react liek we never up rate since 2 year
its a full bubble that ake los tmany money to retail trader
SPX/S&P 500 FUTURESHello fellow traders, Understanding the current markets are awful as of the this year, price suddenly sky rocket like a balloons on space.
My idea is base on Distribution since the COVID 2020 fall of -35%, the price retrace back for 3 years on the run with almost 45% if price goes to my analysis atleast 4966$.
Then we might see a fall or Down back to the COVID 2020 fall.
This is only my view, Not executing unless price reach 4966, maybe next month or end of the month, We have FED/FOMC in the last day of the month.
Trade at your own risk. position yourself at higher possibility .ofcourse this idea has better odds on making a short positions.
This is not a financial advice.
Follow for more higher context. Swing trades. Stay safe folks.

SPX500 - SHORT STRUCTURE IDEA (TARGET 4725)What's on the chart?
1) An old high that marked a strong year for 2023.
2) A rebound in a weekly FVG that earlier served as a bullish signal for prior trading sessions.
3) In the process of that rebound, a 4H bullish FVG was formed which will serve as our target area + fibs.
4) The 2023 high was broken.
5) IMPORTANT: the new high wasn't taken out. Hmmm.. suspicious. That to me is a sign of weakness from the bulls.
6) On this flop of bullish momentum, a bearish 4H FVG was formed.
7) Market structure shift with a low taken out. Do we expect a rebound? Well I don't know. I'm not here to claim that I predict the future like most twitter gurus will imply. But if it does, this is how I see the rest go down.
8) A rebound in the 4H FVG, this is crucial for a short setup because it would imply a lower high. Super important!! Price doesn't need to go that high though to find a short setup. We could just break our imaginary trendline and that's it.
9) The descent into the abyss of short profits (or liquidations lol).

New Top, Old Resistance: Mixed News Question Bullish SupertrendNew Top, Old Resistance: Mixed News Question Bullish Supertrend
Dear Esteemed Traders,
TECHNICAL ANALYTICS
Zooming out on the chart, ES hit a level that might be a resistance since January 2022, formed by a previous top. Historic tops often act as a resistance. Alone this would be a weak indication, but the price managed to hit that level at the same time when it also met the rising resistance from historic bottoms. See the red line on the chart.
I can observe double bearish signals on a bullish super trend, in which the price seems to have crossed down together with the EMAs in the previous month. I wouldn't call super trend bearish yet, but the so far strong bullishness of it became questionable.
MACD made a bearish cross and made a journey towards the bearish side of the indicator below the price chart.
RSI went extremely negative after an extended period spent in the upper half of the indicator. It means that ES might have been overbought, and the market signals the start of a correction to this overboughtness.
The possible correction move paired with a volume that matches the buy volume candles of the mentioned rally. This volume profile further powers the idea that the people who have been buying ES since October might feel the level to take profit on their investments.
The Money Flow Index (MFI) at the bottom and Bull-Bear Power (BBP) above it share the bearish view. BBP isn't too bearish, but it's been showing a weakening bullish power since December.
Finally, the $4736 support seems to be holding up the market from crashing. If the support breaks, the price can fall to the next support. I observed a support of around $4600.
These are the analytics, I found, but let's consider news trading.
NEWS
The Federal Reserve has signaled its intention to raise interest rates in an effort to combat inflation. This could weigh on stocks, as higher interest rates can make borrowing more expensive for businesses and consumers.
Recent economic data has been mixed, with some indicators showing signs of slowing growth. This could raise concerns about the health of the economy and further dampen investor sentiment.
Earnings season is underway, and some companies have reported disappointing results. This could lead investors to expect lower earnings growth overall, which could put downward pressure on stock prices.
In total, I wouldn't call ES straight bearish, but I claim the bullish trend to weaken and I'm looking for shorts below the $4736 support line.
Greetings,
Ely

If the market finally topped, this is nextSince the recent bull move at the end of October began, we have stayed above the same trendline. Not only did the final hour of trading break below that line, it also closed below it. Is this the first indication we have begun Cycle wave C down?
Based on the historical quartile percentages, it appears Cycle wave C and ultimately Supercycle wave 2 will bottom below 3041. The original call for the bottom in July 2022 was to occur around 2400 in the first quarter of 2025. Those dates initially moved forward when I thought Cycle B ended early and I raised the levels to 2700-2900 as well. A bottom in 2025 looks all but certain due to the elongation of Cycle wave B. It looks like the low should stay above 2474.27 but let's see what the other studies say.
The duration models have the most likely lengths at 2499 and 1365 hours which are the respective lengths of B and A. I will once again discount these lengths due to the macro nature of the forecasted wave. The then longest durations are at 2720-2740 and 1240-1260 followed by 4080-4100. The price models agree the most at a bottom between 2900-3050, with the next pocket of agreement at 2650-2750. Other levels are available as high as 3100-3250 and low as 2350-2400.
My derivative model is unable to produce enough data due to the macro position of the sought wave.
The final study compares specific characteristics of the preceding waves to determine what Cycle wave C could do based on historical similarities. Cycle wave B was longer than Cycle wave A, which while less frequent, wave C's behavior is relatively consistent. Cycle wave B was 2499 trading hours long (assuming it has finally completed) while wave A was 1365. This means A was 0.5462 times that size of B. I looked for waves that had the same ratio between 0.5 and 0.65. I further sought historicals where the price movement of A/B was between 1-1.15. In the current case Cycle wave A moved 1.0316 times that of B. Wave B nearly retraced all of Cycle wave A's movement at 96.94%. The of this query provided realistic goals of what Cycle wave C could look like. Duration models like the window from 2261-3864 with the median at 2842. The price models like the low between 3165.62-3378.02. The low is expected to remain above 2729.944 according to this study.
My preliminary assessment puts the bottom around 2150-2200 trading hours and around 2650-2900 for price. This would put the market bottom around mid-March 2025. This is the green box in the bottom right of the main chart above.
I have figured China taking Taiwan would be a factor in the coming declines, but deflation in the U.S. economy, shipping disruptions in the Red Sea, politics in the U.S. will possibly play factors too. This is the final piece of the ABC correction which is a shorter variation of the 2000-2009 more macro ABC correction. Once we bottom out, the next impulsive cycle should send the S&P 500 index beyond 8000 over the next 15-20 years.
I am also working on my modified wave analysis for DIS, JPM, and KO over the next few months. Follow me for more analysis and happy hunting.
