ES - Finally breached the U-MLHThis is what I was waiting for a long time now.
The breach of the U-MLH ist the first step.
The next will/must be a close within the Fork, and I'l put on my short with target to the centerline.
Looking forward for to a pre- Christmas gift §8-)
P!
Sp500short

Short the S&P 500 for the next two weeks. Risk/Reward ratio 2:1Hi guys! This is my first idea that I'm sharing on this site! :)
Based on support and resistance of the past 10 months, short looks good with 2:1 ratio for the two weeks. Also, the RSI is around 75. Keep an eye Monday morning and decide what to do.
If you have different ideas, please share them with me :)
Thanks!

SPY shortShorting S&P 500, you can participate by buying leveraged ETF's (i.e 2x or 3x).
It's earnings season baby, so be careful. I expect to touch SMA50.

SHORT long term enter at 2555 target 2417 SL 2608 RR 1/2.6This time is Long -swing trade and i am sure it will works my target may even not enough far
The US stock ignore all bearish signal..that can be from FED tapering and hike rates//that can be from Trump Promise..than can be from Geopolical problem or even Storm.
It cannot conitnue to go highter like that without a big correction,is natural,is the Forex,the market,or market cannot exist.
so no one talk about Bubble..appart some Fed member or other people make a link with bubble and highter stock right now but not say it directly but stock not react,,why?
Simply because in the wolrd of personal trader have more seller than buyer so the big player as Hedge fund and bank continue to buy them for blow the small account of seller,thst's it.
But 1 day and i think soon on a big news or great excuse they will take them profit and will be fast contagious and a big correction will appears..can be anything.
A details on tax reform plan from Trump,than market bought it and so buy the rumour and sell the news
or it can be his Visit to the DMZ border between NK and SK next month..annyway i short it with BIG LOT
enter at 2555
Target 2417
SL 2608
RR 1/2.6 (i can do 1/3.5 or 4 easy coz like i said i think stock can go more deep than 2417,and also docn my SL but ok i let like that)

SHort at 2503 for 7 target SL 2525 RR 1/2.5-Short with 7 target step by step for people who wanna take them gain or reduce them lots.
-i enter with 2 separate lot same as all my trade but this time i write it.
-even not geopolital tension the US stocks not done the real legit correction.
-Fed is tighening and will start next month to tapering.
-they hike rate many time and stock continue to go up,is not logical
i do my trade with many target and will cut 1 lot when i feel it
my final Target is 2437 but i think he can go more down.
my SL maybe too short at 2525 if he go there is crazy,but if i see it will go there i will not cut but :
-add 1more lot
-update my SL
-down my target
but i let the SL for people who not have enough Balance

S&P500 Short PositioningTrump policies, profit realization requirement and some technical indicators base this strategy.
It doesn't have SL level, cuz don't need :))
Profit levels are on the graph.
Good luck.

Updated SPX short wave 4Based on EW analysis and most statistical fib ratios combined with existing supports. Wave 4 should be a double zig zag as wave 2 was a flat. ABC-X-ABC or 2 downward impulses, this is the real question.
A few weeks left...

S&P500 - Yellen, Start The Printing Press No liquidity, no volatility, Debt ceiling...
Long Term Short

S&P 500 Futures Short daytrade!Morning Traders.
Let it be known I would NEVER consider shorting the S&P Index unless I had lower lowes.
On the daily I've got lower lows and lower highs. This market should be ready to give us 60 ticks. Which on a single futures contract is $12.50 a tick.
Entry 2240.00 Notice how the gap to the downside will be filled right when we take entry.
Stop loss (SET IN STONE) at 2255.
Target at 2220
Very risky and I dont like the thought of shorting the S&P AT ALL. But the setup is right.
No emotion. Just lower lows.
Cheers!

S&P 500 Look Out Below!The last time the RSI moved down to 38.52, briefly moved up, but returned to 38.52 was near the end of 2015. The index dropped 9.75% from the close on December 18th of that year to the eventual bottom. A 10% correction occurred by the time the bottom was found from the its most recent high.
We are more than aware this bull and rally is due to correct. Is it finally upon us? Today the RSI repeated the movement mentioned above. A similar 9.70% drop from today's close would bring the index to around 2195. The index made its last record high on August 8th. A 10% correction from 2490 would be around 2242. If we repeat the 9.75% drop as previously mentioned, this will clearly be a 10% correction for the index.
Not so fast! Before 2242 or 2195 can be met, there are other stronger levels of support that must be breached first. My first level of focus is at 2401. If the index breaks below this level, we are on our way to the next major support level at 2310. Only when 2310 is breached should we consider continued movement to the aforementioned 2242 and possibly 2195 levels.
In my opinion, valuations are high and overall EPS is meager. I have been a bear for over six months which has kept me away from major gains. However, I have not lost anything as I laid in wait. You only take losses when you close your positions. If you miss out on a rally, but did not enter it, you lost nothing. I have been waiting for shorting signals, which I believe are finally seeing the light of day.
I have puts on SPY and QQQ, while buying calls on the VIX when it was trading sub-8. The VIX could only go one direction when it was below 8. All of this waiting is finally paying off. Will it pay off for you?

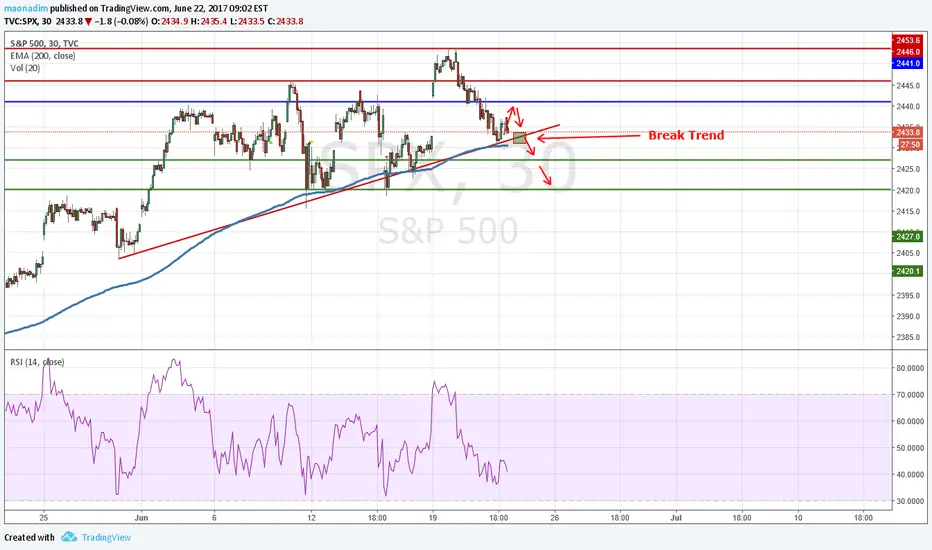
S&P 500Our preference: sales position below 2441,00 with targets at 2427,00 & 2420,00 in extension.
Alternative scenario: in excess of 2441,00, aim for a continuation of the rise with 2446,00 & 2454,00 in line of sight.
Comment: The RSI is bearish and militates for a continuation of the decline.
SPX - a short opportunity?SPX appears to be entering a diamond top on the daily time scale. The pattern formation is average or perhaps slightly below average - I would much prefer to see multiple trendline on both sides of it and a cleaner overall diamond shape. An additional weakness is the strong buying power displayed over the last four days of trading, with prices closing far north of the daily low each time. There is still some significant bullish sentiment reflected there. Price action has tightened up somewhat on the last half of the diamond as should be expected, and a strong downward breakout would confirm the pattern. If you're looking to short it, I personally wouldn't take a short position until the breakout. Because of the weaknesses discussed above I wont be entering at all.
I'm a firm believer that "Its better to see a trade you wish you were in than to be in a trade that you wish you weren't".

S&P 500Our preference: sales position below 2446,00 with targets at 2420,00 & 2412,00 in extension.
Alternative scenario: in excess of 2446,00, aim for a continuation of the rise with 2455,00 & 2470,00 in line of sight.
Comment: The RSI is limited by a bearish trend line.

S&P short to mid term, 2500 in sight.-Ascending triangle, once breaks out of 2400 psychological level, it will go up to 2500.
-Short term wise, long to 2399 level and take profit after that short back to green support level.
-Cover short at green support level and turn into long, TP:2500

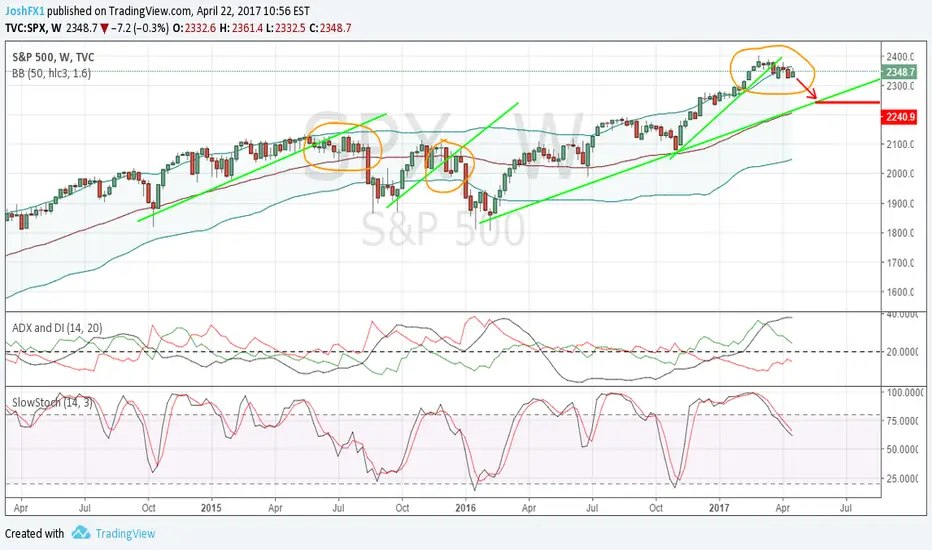
SP500 100-150 point correction in 2 months*Weekly Time Frame*
Setup can take 2 months to show.
Also the Daily Time Frame shows some bullish movement, when the daily time frame also turns bearish its time to short sp500 for 100-150 points, maybe more if the lower range breaks.
When the Daily Time Frame turns bearish I shall also update this idea.
A broke of the range followed by some small side ways trading was always followed by a drop down.
Now its showing the same setup again while also the Stoch Rsi looks bearish and Adx shows the bullish trend gets weaker.
This tells me that in about 2 months the SP500 will show a small correction of aroun 100 points and maybe more if it also breaks the lower range which has remained intact for over a year so far.
When the daily time frame also turns bearish its the perfect timing to short the SP500. I shall update this idea when that happend and also a shall publish a new idea based on the daily time frame.
Breaking 66 could lead us to 60you may trade VIX etf for a short term, a littile adventure is beyond.

short swing trade target 2299due to obamacare reform fail..i think market will be worry for tax reform..the thing that make market goes up

ES S&P500 E-Mini in danger to fall out of exponential pathThis one is a little sloppy, but it meets my criteria to rate as a exponential.
So I expect price to meet the lower A/R line on a drop out of it's exp. path.
...hunt mode on.
P!

SP500 - Hit top of trend canal?It looks like sp500 just hit the top line of the trend canal. Is it gonna break above 2400 or will it fall back?


S&P500 SHORTHi there,
With Trump's protectionist rhetoric, we could see the big guys taking profit out of stocks. S&P500 should then be on a new track lower. Right? Some stocks may still do well, but companies like Apple should certainly see profits declining over the next few years. Won't be a crash though. A steady trip South, stopping off at a few stations a long the way. :-) Opinions welcome brave souls.. :-)

S&P500 (ES) - GLOBAL FORECAST on 2017y.We suggest two variants:
1) if Extension in 3-d wave - short term correction & uptrend! (Inval.lev - 2077.00)
2) if LDT - Correction & uptrend! (Inval.lev - 1810.00)
Excuse us! ) We are so lazy to write some more!!! ))
Sure the Real Pro Trader, should be Laconic & Concrete...)))
«« «« «« «« «« Hold Like! »» »» »» »» »»
(If you have questions, comments, write, reply thoroughly!)
Best regards, Traders Kazakhstan team "Powerful Traders"
