Correction Ahead? SP500 Prints Reversal Signal at Key Resistance📘 This market moves like a textbook chart
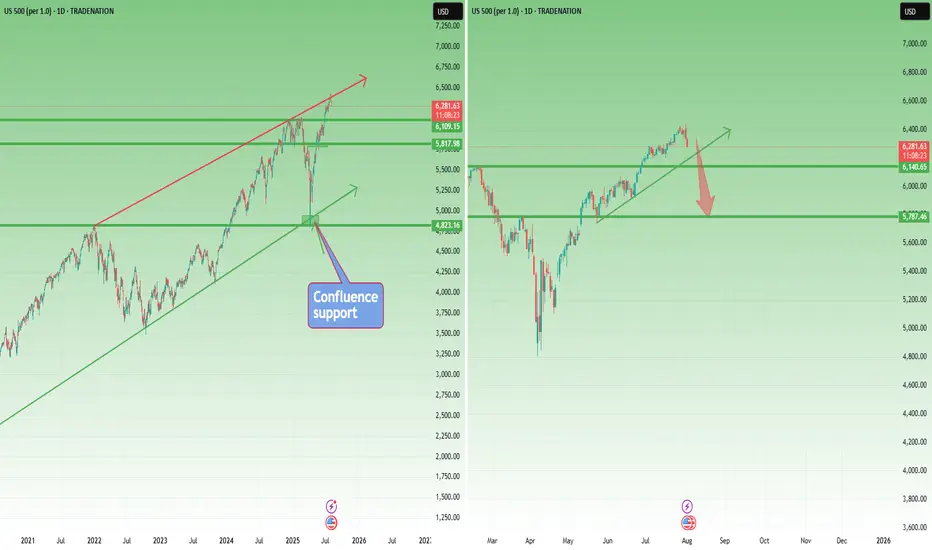
SP500 is acting like a perfect case study from a trading manual. Back in early April, the index dipped just below 5,000, right into a confluence support zone ( I had spoken about this at the time ) – formed by the long-term ascending trendline and the 2022 all-time high. Just like other U.S. indices, the market reversed aggressively from that area.
🚀 A 30% rally in 4 months
From that low, SP500 rallied around 30% in just four months. An incredible move that brought the index straight to the upper boundary of the yearly rising channel.
🕯️ Bearish signal at the top
And just like in NAS100’s case , the index printed a strong Bearish Engulfing candle exactly at that resistance level. This kind of signal, after such a rise, shouldn’t be ignored.
📉 A correction is not only probable – it’s needed
A pullback from here is not just likely, but in my opinion, healthy and necessary . Short-term speculators could look for a move toward the 6,150 zone, which would already offer decent room for profit.
🔍 What if it goes deeper?
I wouldn’t be surprised to see a correction down to 5,750–5,800. That’s about a 10% decline, which wouldn't even classify as a bear market, just a normal reset after a euphoric rally.
🧠 Perspective matters
In a market that gained 30% in four months, a 10% correction is not a crash — it’s discipline being restored.
Disclosure: I am part of TradeNation's Influencer program and receive a monthly fee for using their TradingView charts in my analyses and educational articles.
Sp500signals
SPY (SP-500) - Rising WedgeYesterday we had a breakdown of the rising wedge on SPY. I draw out some important levels to look out for coming days/weeks. The trendline since april has also been broken. ICEUS:DXY is breaking out to which is increasing the risks for a "Risk off" scenario in tech stocks and crypto.
Nothing here should be interpreted as financial advise. Always do your own research and decisions.

SP500 Ready to Continue it's Bullish MoveI just bought SP500 for it's bullish move continuation.
Monthly structure is bullish.
Weekly is bullish.
Daily is also bullish.
I entered for a long buy on the daily time frame retracement.

SP500 BEARISH TRADE IDEA Key Observations:
Imbalance Zone Identified (Supply-Demand Gap):
The pink zone is marked as an imbalance — an area where price moved too quickly upward, leaving little trading volume in between.
These imbalances often act like magnets, drawing price back to "fill" them.
Recent Price Action:
Price recently formed a peak and has since started pulling back.
The latest candlesticks show bearish momentum (a series of red Heikin Ashi candles with increasing size).
Projected Price Movement:
A blue arrow projects a further decline into the imbalance zone, suggesting price may retest this level for liquidity or to complete a retracement.
Target Area:
The imbalance zone lies approximately between 5,680 and 5,736, with a midpoint around 5,710.
This is a logical target for a pullback before potentially resuming upward.
📉 Bearish Bias Justification:
Market Structure: A new lower high is forming, possibly signaling a short-term reversal or correction.
Heikin Ashi Candles: Smooth and elongated bearish candles indicate strength in the down move.
Volume Imbalance Theory: Price may need to fill this inefficiency before finding new direction.
✅ Possible Trading Implications:
Short Setup: Traders might look for short positions with targets inside the imbalance zone.
Buy Opportunity: Once the imbalance is filled, if bullish price action confirms, it could become a strong buy zone.
⚠️ What to Watch:
Look for confirmation (e.g., candlestick reversal or support forming) in the imbalance area before assuming reversal.
News/events (such as the economic calendar icons below) might impact price direction sharply.

S&P 500 | Blue Box as Margin of SafetyWhen the index returns to the blue box, it reaches a zone forged by genuine buying interest and technical alignment. In a disciplined, data‑driven approach, this area serves as our first line of defense.
Why It Matters
• Past reactions show price pauses and reversals here, revealing real demand.
• It coincides with key footprint volume clusters where buyers have stepped in.
Entry Criteria
Higher‑Time‑Frame Stability
Confirm price holds within or above the blue box before considering a position.
Lower‑Time‑Frame Confirmation
Wait for clear breakouts or higher‑lows on short‑term charts backed by rising footprint volume.
Strict Risk Control
If price breaks through without retest or volume support, stand aside and seek a clearer setup.
By treating the blue box as our margin of safety and relying on actual volume footprint data, we trade with prudence and let the market’s real signals guide our decisions.
📌I keep my charts clean and simple because I believe clarity leads to better decisions.
📌My approach is built on years of experience and a solid track record. I don’t claim to know it all but I’m confident in my ability to spot high-probability setups.
📌If you would like to learn how to use the heatmap, cumulative volume delta and volume footprint techniques that I use below to determine very accurate demand regions, you can send me a private message. I help anyone who wants it completely free of charge.
🔑I have a long list of my proven technique below:
🎯 ZENUSDT.P: Patience & Profitability | %230 Reaction from the Sniper Entry
🐶 DOGEUSDT.P: Next Move
🎨 RENDERUSDT.P: Opportunity of the Month
💎 ETHUSDT.P: Where to Retrace
🟢 BNBUSDT.P: Potential Surge
📊 BTC Dominance: Reaction Zone
🌊 WAVESUSDT.P: Demand Zone Potential
🟣 UNIUSDT.P: Long-Term Trade
🔵 XRPUSDT.P: Entry Zones
🔗 LINKUSDT.P: Follow The River
📈 BTCUSDT.P: Two Key Demand Zones
🟩 POLUSDT: Bullish Momentum
🌟 PENDLEUSDT.P: Where Opportunity Meets Precision
🔥 BTCUSDT.P: Liquidation of Highly Leveraged Longs
🌊 SOLUSDT.P: SOL's Dip - Your Opportunity
🐸 1000PEPEUSDT.P: Prime Bounce Zone Unlocked
🚀 ETHUSDT.P: Set to Explode - Don't Miss This Game Changer
🤖 IQUSDT: Smart Plan
⚡️ PONDUSDT: A Trade Not Taken Is Better Than a Losing One
💼 STMXUSDT: 2 Buying Areas
🐢 TURBOUSDT: Buy Zones and Buyer Presence
🌍 ICPUSDT.P: Massive Upside Potential | Check the Trade Update For Seeing Results
🟠 IDEXUSDT: Spot Buy Area | %26 Profit if You Trade with MSB
📌 USUALUSDT: Buyers Are Active + %70 Profit in Total
🌟 FORTHUSDT: Sniper Entry +%26 Reaction
🐳 QKCUSDT: Sniper Entry +%57 Reaction
📊 BTC.D: Retest of Key Area Highly Likely
📊 XNOUSDT %80 Reaction with a Simple Blue Box!
📊 BELUSDT Amazing %120 Reaction!
📊 Simple Red Box, Extraordinary Results
I stopped adding to the list because it's kinda tiring to add 5-10 charts in every move but you can check my profile and see that it goes on..

US500 bearish 12 May - 16 May 2025S&P 500 Bearish Outlook: Targeting $5,100 Amid Rising Uncertainty
As of May 12, 2025, the S&P 500 (US500) stands at 5,661, reflecting a robust recovery from its April lows. However, I anticipate a bearish shift, projecting a decline towards the $5,100 level in the near term. Several converging factors underpin this outlook:
1. Anticipated Weakness in Core CPI Data
The upcoming release of the April Core Consumer Price Index (CPI) on May 13 is poised to be a pivotal event. While the year-over-year Core CPI is forecasted at 2.8%, matching the previous month's figure, the month-over-month increase is expected to rise to 0.3%, up from 0.1% in March. This acceleration suggests persistent inflationary pressures, potentially prompting the Federal Reserve to maintain or even tighten monetary policy, thereby exerting downward pressure on equities.
2. Deteriorating Market Sentiment and Forecasts
A notable shift in market sentiment is evident, with key indicators turning bearish. A prominent S&P 500 model has signaled its first bearish outlook since February 2022, reflecting growing investor apprehension. Additionally, leading financial institutions have revised their S&P 500 targets downward:
Goldman Sachs: Reduced from 6,500 to 5,700
RBC Capital Markets: Lowered from 6,600 to 5,500
Oppenheimer: Cut from 7,100 to 5,950
Yardeni Research: Adjusted from 7,000 to 6,000
These revisions underscore the mounting concerns over economic headwinds and market volatility.
3. Sectoral Divergence: Opportunities Amidst the Downturn
While the broader market faces challenges, certain sectors may exhibit resilience or even bullish tendencies:
Healthcare: Continues to serve as a defensive sector, with companies demonstrating solid quarterly results and reaffirming full-year guidance despite tariff impacts.
Energy Infrastructure: Firms like Enbridge and TC Energy benefit from long-term structural tailwinds, including rising energy demand and global energy security priorities.
Financials and Technology: Sectors represented by ETFs such as XLK and XLF are highlighted for their strong fundamentals and growth prospects.
Conversely, consumer discretionary sectors are showing signs of strain, with negative revenue surprises and companies like Harley-Davidson withdrawing their 2025 outlooks amid tariff uncertainties.
4. Implications of the US-UK Trade Deal
Recent developments in the US-UK trade agreement further contribute to market uncertainty. While the deal includes exemptions for certain British goods, such as aerospace components and a quota of 100,000 UK-made cars annually, it also maintains a baseline 10% tariff on foreign goods. This policy introduces complexity and potential cost pressures for multinational companies operating across borders.
Moreover, the agreement has faced criticism for being one-sided, with concerns that it may not adequately protect domestic industries or address broader trade imbalances. Such apprehensions can dampen investor confidence and contribute to market volatility.
The convergence of persistent inflation, cautious monetary policy, revised market forecasts, and the complexities introduced by recent trade agreements suggest a bearish trajectory for the S&P 500, with a potential decline towards $5,100. Investors should remain vigilant, monitoring sector-specific developments and macroeconomic indicators to navigate the evolving market landscape.
Disclaimer: This analysis is for informational purposes only and does not constitute investment advice. Always conduct your own research before making investment decisions.

#ES1! "E-Mini S&P500" Index Market Bullish Robbery Plan🌟Hi! Hola! Ola! Bonjour! Hallo! Marhaba!🌟
Dear Money Makers & Robbers, 🤑 💰💸✈️
Based on 🔥Thief Trading style technical and fundamental analysis🔥, here is our master plan to heist the #ES1! "E-Mini S&P500" Index Market Heist. Please adhere to the strategy I've outlined in the chart, which emphasizes long entry. Our aim is to escape near the high-risk YELLOW MA Zone. It's a Risky level, overbought market, consolidation, trend reversal, trap at the level where traders and bearish robbers are stronger. 🏆💸"Take profit and treat yourself, traders. You deserve it!💪🏆🎉
Entry 📈 : "The vault is wide open! Swipe the Bullish loot at any price - the heist is on!
however I advise to Place buy limit orders within a 15 or 30 minute timeframe most recent or swing, low or high level. I Highly recommended you to put alert in your chart.
Stop Loss 🛑:
Thief SL placed at the Nearest / Swing low level Using the 3H timeframe (5440) Day/Swing trade basis.
SL is based on your risk of the trade, lot size and how many multiple orders you have to take.
🏴☠️Target 🎯: 5730
💰💵💸#ES1! "E-Mini S&P500" Index Money Heist Plan is currently experiencing a bullishness,., driven by several key factors. .☝☝☝
📰🗞️Get & Read the Fundamental, Macro Economics, COT Report, Geopolitical and News Analysis, Sentimental Outlook, Intermarket Analysis, Index-Specific Analysis, Future trend targets with Overall outlook score... go ahead to check 👉👉👉🔗🔗🌎🌏🗺
⚠️Trading Alert : News Releases and Position Management 📰🗞️🚫🚏
As a reminder, news releases can have a significant impact on market prices and volatility. To minimize potential losses and protect your running positions,
we recommend the following:
Avoid taking new trades during news releases
Use trailing stop-loss orders to protect your running positions and lock in profits
💖Supporting our robbery plan 💥Hit the Boost Button💥 will enable us to effortlessly make and steal money 💰💵. Boost the strength of our robbery team. Every day in this market make money with ease by using the Thief Trading Style.🏆💪🤝❤️🎉🚀
I'll see you soon with another heist plan, so stay tuned 🤑🐱👤🤗🤩

SP500- Don't be fooled by yesterday's pumpThe markets reacted strongly to Jerome Powell's latest commentary, sparking a notable rally. However, traders should be cautious before assuming this marks the beginning of a new uptrend. While there has been a slight shift in market structure, the broader trend remains intact. Overlooking the strength of the next resistance level could prove to be a costly mistake.
The Big Picture: S&P 500 Daily Chart Analysis
Examining the TRADENATION:US500 posted daily chart, the key question is: has the trend truly reversed? While a green-bodied candle signals some bullish momentum, SP500 remains below critical resistance levels. Notably, it closed beneath what I call the "Do or Die" zone—an area that aligns with prior lows and, more importantly, the daily 200 SMA. This suggests that what we’re seeing could be a lower high forming within the broader downtrend.
Hourly Outlook:
On the hourly chart, we see a strong reversal from 5500, but the move appears corrective rather than impulsive. It seems to be forming an ABC-style correction, with the market currently in wave C. Calculating the potential top of wave C, we find it aligns perfectly with a key resistance level and the 200-day SMA.
Conclusion:
While we may see some upside heading into the end of the week, I believe this rally will be short-lived. Once SP retests the broken support—now acting as resistance—I expect the downward trend to resume, with my target remaining at 5200 (as previously discussed).
Disclosure: I am part of Trade Nation's Influencer program and receive a monthly fee for using their TradingView charts in my analyses and educational articles.

Do bulls really want to be long the S&P 500 ahead of a breakout?S&P 500 future are tantalisingly close to a record high. So close in fact, it would be rude not to print one. Yet I am skeptical it will simply hold on to (and extend) any such gains without at least a shakeout first, and bulls may be better to wait for a dip. Comparing the S&P 500 to Dow Jones and Nasdaq 100 futures, I explain why.
MS.

ES - Where to Join into the TrainThese two blue boxes are also very suitable for working with receivers.
Instead of getting lost in the low time interval, transactions can be taken by looking at the reactions when the price reaches these levels.
My Previous Ideas
DOGEUSDT.P | 4 Reward for 1 Risk much more if you hold it.
RENDERUSDT.P | HTF Accuracy
ETHUSDT.P | Accurate Buyer Zone Identification | High Risk Reward if you hold it.
BNBUSDT.P | Accurate Buyer Zone Identification | High Risk Reward if you hold it.
Bitcoin Dominance | Great Characteristic Detection and Accurate Analysis

The S&P 500 just hit me with a 'deja vous' - gains to follow?Once every so often I look at a chart and instantly get struck by a familiar pattern, which is exactly what happened today with the S&P 500 futures chart. And with asset managers firmly backing the ES1! futures market, I'm not on guard for a bounce form support. Just as long as Nvidia earnings allow.
MS.

SP500 double GapCould we see SP500 in the 5800 prices in the upcoming days or this double gap will be closed in months or weeks?
Always do your research

SP500 Double gap analysis ideaWe can see that there are 2 gaps in the SP500, both are at similar distances, which one will close first?
Always do your own research

S&P500 Prediction: is it forming double top??Is S&P500 forming Double top?
A low-volume rise is a telltale sign.
Deep valley below the double top meets criteria.
Beware of large red candles, as they signal confirmation of the reversal.
What's your opinion about it?

S&P 500 ANALIYSIS !!S&P 500 Analysis
The S&P 500 has recently broken out of a "cup and handle" pattern, which is typically a bullish indicator. This breakout suggests a continuation of the upward trend, supported by the 21-day moving average that acts as a dynamic support level.
Cup and Handle Pattern: This pattern is characterized by a "cup" formation followed by a short consolidation period that forms a "handle." The breakout above the handle signals a bullish trend.
21-Day Moving Average: The S&P 500 is currently trading above the 21-day moving average, which acts as a support level and confirms the ongoing bullish momentum
Retest Above Breakout Level: The S&P 500 will likely retest the breakout level. A successful retest would further confirm the bullish trend.
CME Gap Considerations: There is a CME gap above the breakout level. Historically, such gaps tend to get filled, indicating potential short-term downward momentum before the uptrend resumes.
Monitor for a retest of the breakout level. If the price stays above this level, it confirms the bullish trend.
Keep an eye on the S&P 500 staying above the 21-day moving average. This will strengthen the uptrend.
Fill the Gap: Anticipate potential downward momentum to fill the CME gap. If this happens, it could present a buying opportunity if the price stays above key support levels
Breakout Below Support: If the S&P 500 breaks below the 21-day moving average and fails to recover, it could signal a reversal of the current trend.
The S&P 500 is in a strong bullish trend, confirmed by the breakout from the cup and handle pattern and support from the 21-day moving average. A retest of the breakout level and potential gap fill could bring short-term volatility, but as long as the price holds key support levels, the overall outlook remains positive.
Monitor the breakout level and 21-day moving average for potential retests.
Make sure any breakout or retest is accompanied by significant trading volume for confirmation.
Stay aware of macroeconomic news and updates that may impact market sentiment and the performance of the S&P 500.
Remember:-This is not a piece of financial advice. Stay tuned to us for further updates and analysis. Thank you!

S&P 500 Tests 5,300 as Inflation Eases, Fed Policy in FocusThe market remains cautiously optimistic as the S&P 500 tests the 5300 resistance level. The deceleration in inflation is promising, yet the Federal Reserve's future monetary policy remains uncertain. Investors should stay vigilant, monitoring economic data and Fed communications to navigate potential volatility and capitalize on market opportunities.
* S&P 500 at Resistance: The index tests 5,300 amid recent inflation data.
* Inflation Slowdown: Core CPI rose just 0.3% in April, the slowest pace in 3 years. This boosted stocks, with the S&P 500 reaching a new high.
* Fed Policy: The Fed may hold steady on rates in the near term, but a September cut is increasingly likely if inflation continues to moderate.
* Key Upcoming Data: The PCE price index (will released this week) and future inflation reports will be crucial for gauging the Fed's policy stance.
* Market Outlook: Cautious optimism prevails as investors weigh the inflation slowdown and potential Fed actions.

SP500 Mid term planOur friend Fibonacci is showing up a possible next move for SPX. Actually is ranging exactly on the 1.618 level of the last leg, and usually this level to a retrace till the level 1. There we could probably see a reversal that could lead the price into the resistance area at 5250, but it's probably too early for that

SP500 Everything goodSP500 is on track and is following the idea i shared some days ago. I expect a continuation of the drop till the 4800-4900 area, and probably the target will be hit in May/June. Here i will look for longs to hold till Q4 2024. Updates will follow

SP500 Main targetSP500 is looking bearish, and i think we will see a major correction in the next weeks. I have my main target at $4.750, were the price could bounce back up. I will enter short with small size and i will add shorts if the price will go up, invalidation above actual highs at $5.300

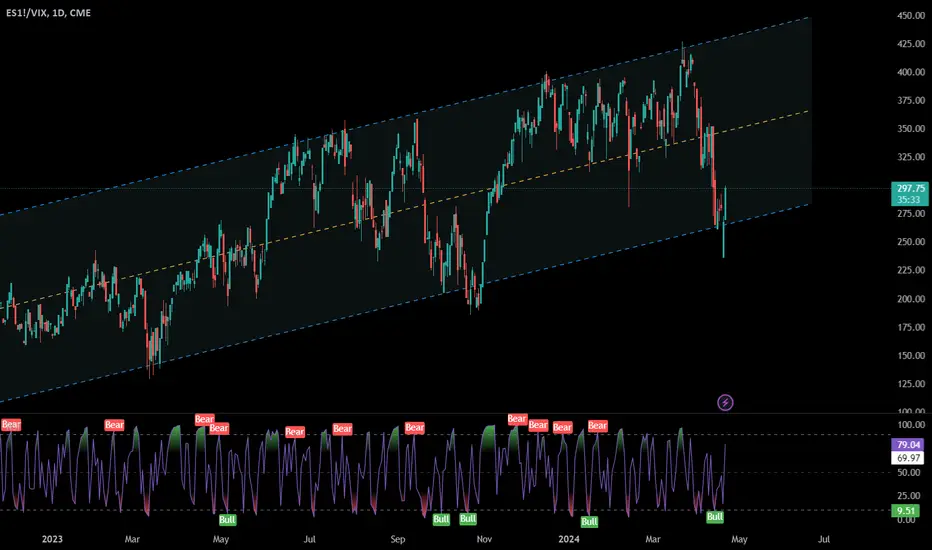
SP500 reversal in progressfrom the sp500/vix ratio it emerges that there is an increase in the relative strength of the stock market compared to the fear index. We could witness a bull market reabsorbing the bearish excess of the month of April
SP500 H4 Projection Price is clearly in a bearish trend. Price also has fair value gab and unmitigated order block zone. So initiate short positions near the order block zone after finding a strong bearish price action structure. Analysis trend is invalid if the price breaks and closes above the trendline. Good Luck.

Target hit for SP500My short plan for Sp500 worked out perfectly. I shared my view some days ago and adding shorts while it was going up paid out. Actually i closed all my shorts and i am looking to enter long. I think that a pullback is on the way

What's next for SP500?SP500 has made a nice drop like i predicted in my previous idea. I expect a little continuation of the drop before a pullback that could lead the price to the resistance area at 5250. Here i will look for a new short in the next weeks.
