S&P 500 Ascending Channel - Short SetupSPX500 Short Trade
Entry: $3,866.6
TP & RR: $3,840.5 (1.13)
Stop Loss: $3,889.7
REASONS FOR THE TRADE
Straight off the bat, you notice two things here - ascending channel and opening a position against the trend with what I consider a bad Risk:Reward Ratio of just over 1. However, I believe that price can form a double top with bearish divergence, retrace back to the lower trendline and then continue up. Of course, we will be looking to open a long order somewhere at the lower trendline.
Stop Loss is set pretty high in case there's a fakeout. However, we will close the position if there's a convincing close above the recent high.
Sp500signals

SP500 - SHORT; SELL it here!With the credit spreads looking like they're about to blow out, equities don't stand much of a chance here, either. Look for at least a >-11% dive here.
.... or ... SELL the Nasdaq100 ...
... as it doesn't look much different, either. A little difference without much distinction.
Here is an other clue;

S&P 500 Exhaustion - Sell OrderSPX500 Short Position
Entry: $3,865.0
TP & RR: $3,828.3 (1.95)
Stop Loss: $3,883.8
REASONS FOR THE TRADE
Clear divergence in the Market Flow indicator and we are reaching a trendline, which I believe will act as resistance. SL is set well above it, so we give the trade some space to breathe and hopefully develop as we expect. Target is set at the previously established resistance, which should now act as support.

SP500 could correct to 3500, I'm waiting for confirmationSince the "election all-time high" just under 3700, SP500 continued its rise, but this is anemic to say the least with the index gaining around 3% in the past 2 months.
The rise is in a tight channel which for me is an indication of an imminent reversal.
A break under this channel's support can be the signal for sellers and 3500 is a very modest target for this trade(I believe it will drop harder)

spx's options total volume, much safer to trade high volume Hey guys,
nothing really solid here, jus a safer zone to trad than another. Both success rate for buy/sell are not that good at all.
--------------------------------------------------------------------------
8 signals low volume:
-------------------------------------
77 days before a crash
63 days before a top
up swing
@ a top
going down
63 days before a top
sideways
286 before a crash
------------------------
- 4 @ months before a
top like months !!!
- 3 false signals
-1 @ a top
***Summary:
50% months before tops
10% @ top
40% false signals
HIGH RISK
HIGH RISK
HIGH RISK
----------------------------------------------------------------------------------------------
------------------------------------------------------------------------------------------------
11 signals high volume:
----------------------
Going down
bottom
going down
going down
up siwng
bottom
up swing
bottom
bottom
bottom
up swing
---------------------------------
3 going down, 5 bottoms, 3 up swings
--------------------------
Summary:
- 45 % @ bottoms.
- 27% up swings
- 27% false signals
-Trade high volume
is safer.
lower risk
lower risk
lower risk
-----------------------------------------
trade above our High volume trigger line is much safer.

S&P500 : The completion of the Diagonal patternIn240 minutes chart of the uptrend from the range of 3511 to 3833 is in the form of 3 waves which confirms the scenario of the formation of the Diagonal pattern.
Currently, to get the the confirmation of the downtrend,the price should not cross the range of 3841,because the 3rd wave should not be shorter than the other waves.
By crossing the price from this range,this scenario will be violated.
Thee confirmation for this pattern will be received by the formation of 5 descending waves,and by crossing the price from the range of 3660.
According to monitored position, personally,I set the short order.
By considering the RSI you can also see the convergence

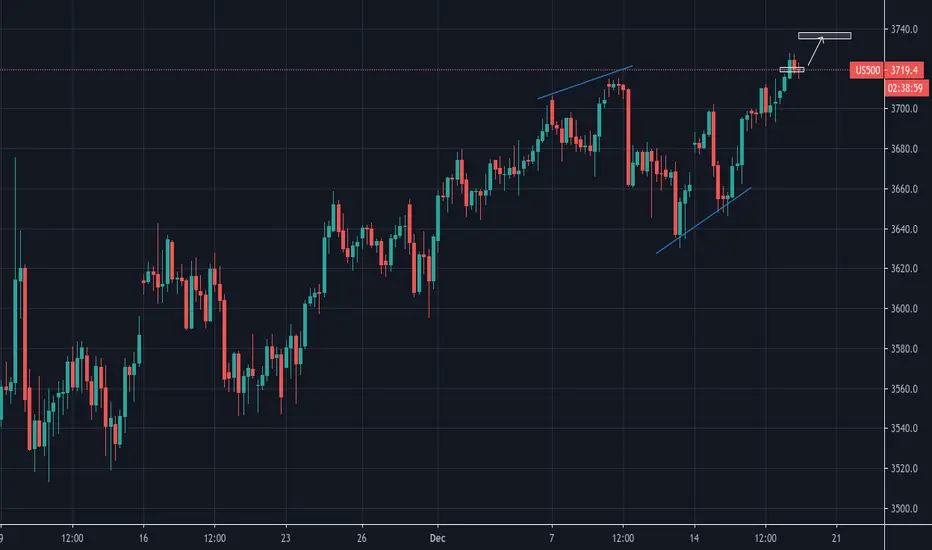
S&P 500 Ascending Channel - Long SetupS&P 500 Ascending Channel - Long Position
Entry: $3,795.3
TP & RR: $3,873.6 (3.26)
Stop Loss: $3,771.3
REASONS FOR THE TRADE
I believe the price will respect the lower trendline in this ascending channel and will continue trending up. Initially, we had the order at a lower level, but it seemed that we wouldn't get a fill, so we trialed it up.
Needless to say, if the price breaks through it, I am expecting a fairly sharp drop and will be looking for a short position. The current entry is at a support level, which while being a bit conservative, gives us a good RR with the SL far enough and with enough room for the trade to breathe. If the price dives down or does something unexpected, we will close the order prematurely.

S&P Since Inception to 2020 weekly Golden Cross #2 Gain#3 length1958-2020. we just behind Mid 70s to the End of 90s .

SPX's RSI structure & divergences are to watch very v.v. closelyBelow 60 reading HIGH ALRET.
wish u alll the best.

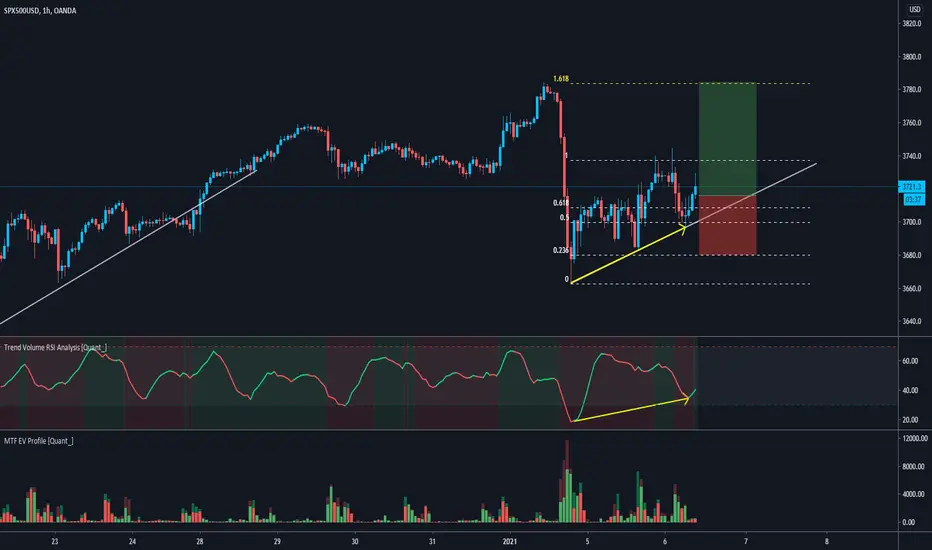
S&P 500 Index Long SetupSPX500 LONG SETUP IDEA
Entry: $3,715.9
Stop Loss: $3,680.5
TP Levels and RR: $3,784.4 (1.94)
REASONS FOR THE TRADE
I know that I am posting this with a bit of hindsight, but by the time I opened my order and came back to do the analysis the price has already gone up. Anyway, I am posting this in case there's a small retracement and you decide to jump on board.
The indicator Trend Volume RSI Analysis shows a clear divergence in the volume and you can also see the buying and selling distribution in the Multi Time Frame Effective Volume Profile below. I have also applied a Fib Retracement to this ascending triangle, which indicates that the take profit should occur somewhere near the potential resistance.
The SL level is put at a level far enough from the trend line. You can be slightly more aggressive here and move the SL up, which would significantly improve your RR Ratio. Generally speaking, breaking down this trendline would invalidate the setup, so if you have taken that particular trade you may close your position before hitting the SL.
SPX's Deviation from 200W MA since inception's day 1957-weeklyHey guys what's up
This is a weekly study VS. daily i did last time.
I am including all the data here so you can copy, share or edit it on Microsoft apps. feel free to reuse or redistribute all
my work to our trading view community or out side it.
March's low is most likely a fresh new cycle to say the least " believe it or not" with out bias you would come to this conclusion
one way or another and you should accept if before time proof that for you. (even if we get big corrections this is how financial markets behave : -) )
Moreover i probably did allot of mistakes here and there, missed allot of important details ... but i did everything with the best to my ability : -)
wish you all the best.
----------------------------------------------------------------------------------------------------------------------------------------------------------------------------------------------------------------------
Summery 11 times : Green count .
Above 50
54% of pullbacks single digits
46 % double digits correction
very close margin to favor one
over the other.
All deviations above 50 :
-----------------------------
Deviation Pullbacks/correction
54.84 13.08
57.25 7.17
61.99 22.39
59.53 13
61.78 7.35
60.42 34.52
54.78 8.77
55 9.83 crash came for less
57 7
58 10.59
56.33 4.62
******************************************************
Summery 11 times : Blue count.
40-40.99
46 % single digits pullbacks
54 % double digits corrections
All Deviation 40-49.99 :
------------------------------------
47.29 49.94 2000 crash
46.11 10.05
48.98 10.29
43.78 5.96
41.79 10.03
46.15 9.12
46.07 5.32
47.50 21.46 crash of 1957
43 3.52
43 6.82
43 5.9
********************************************************
Summery 21 times : Orange count
30-30.99
76 % single digits pullbacks &
24 double digits corrections
- pullback. That’s a huge jump from
the 40s.
All deviation 30-30.99 :
-------------------------------------------
30.38 10.55
32.61 11.84
33.61 5.16
33.27 9.84
34.60 4.35
34.63 6.67
34.73 6.03
30.65 4.82
31.37 4.81
31.37 4.81
32.83 7.52
37.74 10.90
39.74 5.33
33.19 4.11
34.17 5.58
30.23 8.48
37.05 7.53
33.05 14.71
37.21 26.44
33.38 7.79
30.20 6.10
*************************************************************
Summery 47 times : Dark Green count
20.20.99
71 % single digits Pullbacks
29 % double digits corrections
All deviation 20-20.99
27 8.9
20.46 8.27
29.12 35.52 covid crash
21 5.46
22.86 6.80
22.58 7.63
27.76 20.21
24.38 3.56
27.73 6.82
25 Nothing happened
20 2.95
20 2.99
21.16 14.37 within a pullback
29.64 15.09
27.54 8.90
25.59 10.94
24.34 57.72 2007 crash
25.16 11.86
23.05 6.84
21.72 8.08
20.55 9.73
22.43 5.36
21.76 4.80
20.97 3.43
21.08 6.67
27.70 6.83
25.41 6.60
25.29 5.59
25.16 20.33
28.12 11.30
23.19 9.24
27.62 4.03
23.50 8.98
25 49.95 crash of 1973
20.25 37.36 crash of 1969
23.90 23.70 crash of 1966
24.20 4.39
24.97 10.94 N.h
24.35 3.33 N.h
24.17 4.78
25 4.19
23.51 4.47
27.54 29.27 crassh of 1962
25.19 3.90
27.83 14.06
25 3.95
24 4.39
***********************************************************
Summery 25 times : Purple count
10-19.99
72 % signal digits Pullbacks
28 % double digits.
All deviations 10-10.99
19 1.74
18 1.94
16.5 5
14.64 6.08
15.93 4
17.04 21.58
17.39 6.22
15.65 7.30
14.88 4.45
14 7.27
19.93 21
12.85 11.68
14.147 15.12
10 8.10
14.89 20.45
17 5.45
12.33 15.39
16.11 7.60
11.94 11.36
14.29 8.36
13.64 4.76
13.62 8.43
18.89 7.58
15.31 5.19
19 4.6
*********************************************************************
Deviation below 10 % of spx:
Very shocking results
Buy Buy Buy Buy Buy Buy Buy Buy Buy Buy
Long Long Long Long Long Long Long Long
The safest area to go long with every thing
else is being absolute !!!!!!!!!!!!!!!!!!!!!!!!!!!!!!!!!
Deviation pullback
9.60 4.60
**********************************************************************
All acceptable pullbacks happened above 10 % of
SPX's 200W MA !!! very safe zone to be long is
when deviation is 9.99 and under . Most important
discovery of this study of this indicator with every
thing else being absolute !!!
**********************************************************************************
Deviation Below 200W MA:
49-37 Buy Buy Buy Buy Buy Buy
and Hold Hold Hold Hold Hold
All Deviation below 200W MA
-----------------------------------
16.90
7.04
49.44
37.98
10.64
8.03
5.87
4.12
6.15
38.94
5.55
26.75
10.05
13.92
3.35
************************************************
Summery of all summaries :
( Keep this handy close by for your swings : -)
---------------------------------------------
Deviation Singal.D Double.D
50 + 54 46
40-49.99 46 54
30-30.99 76 24
20-29.99 71 29
10-19.99 72 25
Below 10 4.6 Zero
------------------------------------------------
Hope this would be like a Guide Book for this weekly indicator. Keep the summaries close by for your trading .
wish you all the best.


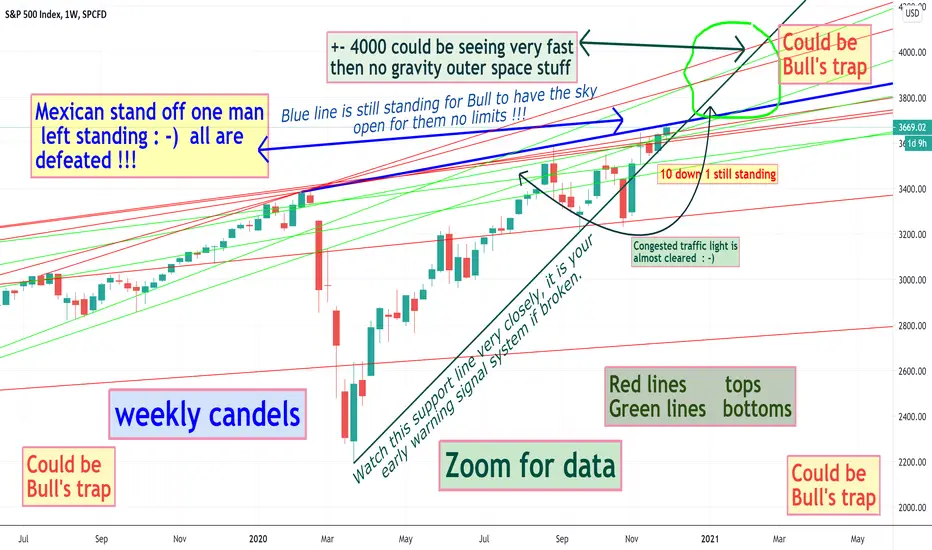
SPX Mexican stand off one man still standing for bull to have the sky limit for them. Or may night and it turns to be a bulls trap !!! time will tell
wish you all the best.
SPX& Dark pool Index (DIX) readings similar to 10.2012 & 1.2018 I now bears will not like this, including myself, but putting our bias a side. It is only suggestion a minor correction.
wish you all the best.

The inescapable Financial Collapse; A 4-Dimensional analysisThis is the SP500 / Gold / the US Dollar / a G10 Composite Currency Index / Time / Price, all of it, all at once! - Lets call it: Universal Value. - Shall we...
This is a 2-Dimensional projection (being on a flat computer screen, after all :-) of a 3-Dimensional "Slice" of a 4-Dimensional space. - So try to visualize it. (Not as difficult as it first may seem.)
Envision a box with only 4 sides - i.e.: a tunnel - which constitutes the entire Universe, in which everything exists, and the only option for interaction with said universe is to twist the walls freely, into any desired configuration, along the tunnel's principal axis - in this case the horizontal, Time axis.
This is a broad-strokes, yet, reasonably accurate depiction of the concept of: Value. - In this case, projected onto the SP500 Index.
"How does one escape such a tunnel where one's options are duly limited (mathematically and physically) to only twist the walls of such a tunnel?" - You ask...
It is literarily impossible, so good luck with that!
Thus, cheer on, trade the hell out of it and take every last fool for everything they got! (Then run. :-)
... and just in case: There is no "Plan B"!
Here is a likely better - not "shifted" - view, ...
... of the "financial Universe" projected onto the SP500.

SP500- Time to sell it?Since the election SP500 had a good run with the price rising around 10%.
The vaccine announcement brought a lot of optimists into the market but the rally was short-lived and failed to maintain gains above resistance.
It is possible for a false break to be in place and in this case SP could drop and retest the lower boundary of the range.
I'm bearish SP as long as the price stays under 3650 zone on the daily close bases and I'm looking for a good point to entry

SP500- Hanging man in resistance, a warning for bullsAfter a nice Pin Bar in support followed by a 4 days uprun is time for the "hanging man" to give us a warning...
Friday's session was dominated by NFP's volatility and I wouldn't have paid much attention to this candle if it hadn't been in resistance.
I expect 3500 zone to be a hard zone to pass by bulls and the index could fall to at least 3200 in the next 2-3 weeks.
I'm looking for selling opportunities.

SP500 - 4hr; Excellent SHORT Entry point, right here. SELL it!!Great SHORT Entry point, right here, right now -> @3360. SELL it hard!!

SP500- I maintain my target of 3kAs I said in my previous SP500 analysis, 3500 should be a great sell zone for bears.
The index reached that zone, has reversed and now is trading just above 3250 support zone.
A small rally should be expected now and bears have a new opportunity for opening trades around 3400
I maintain my target of 3k for this index and only a new all-time high would change my perspective

SPX relation with Stocks above 200D MA,70 selling & 24 Buying I did not like this a bit. I do not no way but it seems it was quite hard to analyse !. Even though, it is the 200d MA it gave tops that are not significant at all
that's maybe one of its draw back. high opportunity cost. Or maybe it is not my day of analyzing :-). i did my best LOL.
further examination of this indicator is needed. Also, do not forget that i might missed allot of tops & bottoms :-)
wish you all the best.

S&P 500 STOCK ABOVE 100 DAY MOVING AVERAGE SECTION#TWO( 2)WEEKL Two sections of this bull cycle, with two extremes reading. Second section we've never reached above 87. First section,
surprisingly , it was quite a buying signals !!! we stayed above 87 for a longer period !!!
CONCLUSION: we have 4-8 weeks to proof this is wrong & if we do not MISS. No warries this time is different :-) we shall see :-)
wish you all the best.

SP500- A new drop to 3k zone is my ideaAfter reaching an all time high at 3600, SP corrected to 3200 zone and now is in a correction of this first leg down.
I expect rallies to be caped at 3.5k zone and a new leg down can start from there.
My target for SP in the medium term is 3k zone but with upcoming elections I would be very careful with shorting US Indice
