Gold idea TRIANGLE
Gold markets have pulled back a bit during the trading week, only to show signs of strength again just above the $1900 level. I do believe that the $1900 level is going to continue to offer a bit of support, but at the end of the day I think you have to be very cautious about getting overly bullish as the US dollar seems to be trying to recover
If we were to break down below the $1900 level. I would recommend buying it $1800 underneath, because it was so structurally important in the past. Beyond that, I think that the market will do everything it can to find buyers, but if we were to break down below the $1800 level then I think we have to kind of rethink the entire situation. Longer-term, I believe that gold goes the 2500 based upon a whole slew of things including the Federal Reserve, global growth stopping, and of course geopolitical issues such as traits bounce between the United States and China. I have no scenario in which I am selling currently.
In short for myself i will short 1937 when market opens to 1917-1920 and then buy at that point and stop loss at 1900-1907.
Spotgold

XAUUSDLooks like a perfect swing trade setup.. in line with the fundamentals too. It actually presents a decent Risk to Reward ratio.
RRR: 1:16
Entry: 1910
SL: 1900 (10 pips)
TP: 2075 (165 pips)

Gold Holds a bounceA falling trend breakout on H1 as the spot clings onto the critical triangle support looking at the retest of 1960.00
💱 BUY LIMIT
📊 Entry: 1935.00
📉 Target: 1960.00 (250 points)
📈 Stop Loss: 1925.00 (100 points)

Gold Long Trade *Inflation Hedge*It is no secret that all central banks are now willingly and actively printing currencies to keep stock markets afloat. The U.S are leading the way and the dollar is weak. Against other currencies that are also seeing money supplies increase, the effects of increased Dollars is diminished but against Gold, which cannot be printed, we are going to see large weakness.
Buying gold against any currency is a good idea in my opinion however i am not one to simply buy at any level. I will always wait for technical analysis and price action to produce an accurate and discounted entry price. That is occurring right now.
"Fundamental analysis tells you what to buy and why. Technical analysis tells you where and when to buy it."
On the spot gold vs USD chart the 50EMA is above the 200EMA (bullish alignment) on all timeframes from the weekly down to the 4hr. Price broke out of a wedge consolidation pattern last week and it is now selling off and pulling back to the structure and price support zone around $1900/$1920 oz which I believe is a great place to buy in to the next rally.
We have the 4hr 200EMA and daily 50EMA residing in the zone and lots of previous buyer support.
Upside targets for me would be $2200 per ounce in the near term (2020) and then $2500 per ounce through the next 12 - 18 months. I know some Wall Street banks analysts from GS and BoA are predicting $2300 and $3000 respectively.

Spot Gold Analysis 10/08/2020Gold has been on a crazy run recently assisted by the coronavirus pandemic and more recently, the USD weakness.
I can see some signs of momentum slowing here but shorting is risky long term with such uncertainty in global markets. That being said, today there is some nice rejection of the daily pivot level and price is breaking below the 1hr 50ema after crossing the lower timeframe EMA's last week.
There could be some short side potential in the near future and price might go back to retest the $1980 support/resistance zone.
From there, price might likely bounce or a break of that level could see more downside. A lot rides on whether USD will continue to weaken from here or whether the US fed will ease up on their stimulus and money supply increases.

SPOT GOLDA LONG PERSPECTIVE ON GOLD. Take a quick careful look at what's happening and what is going to happen.

GOLDEN GOLD OF GOLDSForgive the mess on your screen right now, though take a good look at what is going on.


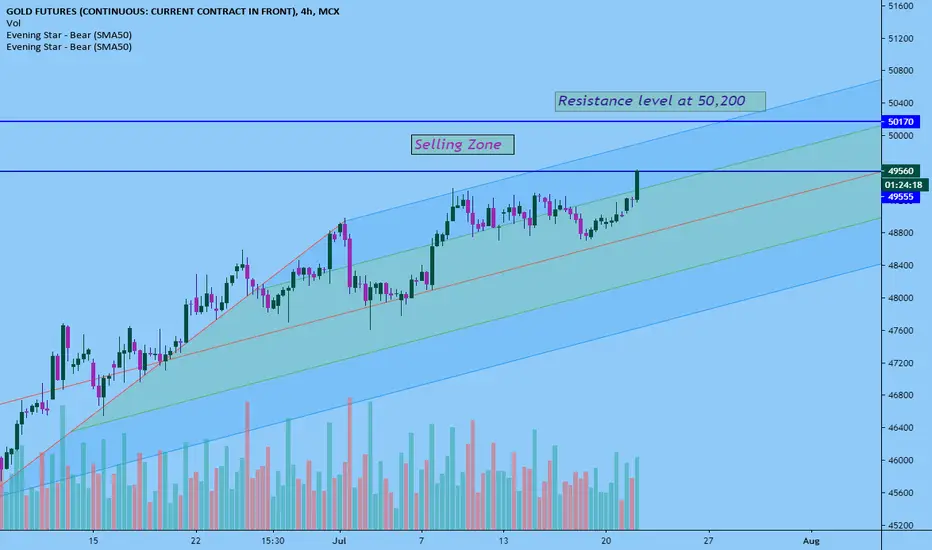
Short Gold for the target of 49,000- 48,000 Short October 2020 contract's lot is safer side for the short term.. Sell.. Maximum expectation to the upper side is 50,200 for this week.
Renko showing clearer higher highs and higher lows on 15minwatch 4hr and day charts for moves to 1730-1767

Longing XAUUSD through US sessionCurrently longing short through the US session. Reflecting back on preview trend following the support and resistance which is very well supported when trading gold. Went long on XAUUSD on wednesday around the 1700 area catching 100 pips each time after consolidating within each zone highlighted on the chart. Can see gold finishing shy of 1740 for the end of May!

Buy setup for gold spot tarde as mentioned on chart, ignore current upseide move there will be a rejection form MM. any second upside move can be taken as confirm long trade setup !!!


Congratulations, XAUUSDCongratulations, we obtained more than 365 pips from this analysis
this analysis
The last expected goal was achieved by us

Gold : Downside break out of range 1670-1730 is likely Spot gold is trading inside the rectangular range 1670-1730 since 5 weeks as the risk appetite escalates and investors were forced to lessen their long positions . Technically, 1670 area is the short term range bottom/the final fib support ,in my opinion a downside break out of the range and to test the 50 day exponential moving average around 1650 is likely. Investors might consider that level for fresh entries followed by 1610 area (EMA 100) if the price failed to hold the 1650 (EMA 50) major support. Hence,scalping inside the short term range is better option as of now , keep in mind stop loss hunts on range top and bottom are also likely (obvious in a range market)
Short term trend : Range Bound
Resistance : 1730
Supports : 1670 (Fib) , 1650 (EMA 50)

xauusdThis technical analysis for this pair
Please be careful because the economic calendar for this week is full of important news for the majority of currencies
Please consider the level of risk in any trade .
Conditions for entering into trading on this pair .
Close the whole body of a candle above the orange area. Entry is a buy for green bullish targets .
Stop-loss order: The closing is in the same area to exit the purchase and execute a sell order For green, bearish targets .
This technical analysis is specific to this pair during this week only .
If you are not satisfied with entering this way, you can tell me about that in the comments section below .

XAUUSD Technical and Fundamental AnalysisA bullish flag pattern seems to be forming in the D1 Timeframe, currently possibly on its THIRD rebound of the bottom of the wedge.
Short Term Opportunities to watch for:
- A STRONG REJECTION AND REBOUND FROM SUPPORT @ 1680 --> possible LONG opportunity to the top of the wedge @ 1710
- A BREAKDOWN below support 1680 --> SHORT opportunity to the nearest support line @ 1637
- A BREAKOUT above 1720 would bring us for LONG to next resistance @ 1735, and beyond that, the historical resistances last touched in 2012-13, @ 1795 and @ 1909
Fundamental Analysis:
However, I would be watching the news closely as Unemployment Rates (8 May), Jobless Claims (7 May) , CORE CPI, and Fed Budget (12 May) are due for release. The US Treasury has also said it would borrow an astonishing $2.999 trillion during the June quarter, five times larger than the previous single-quarter record. (www.investing.com)
These points to impending inflation and therefore BUYING pressure on the ultimate hedge of inflation and risk: GOLD
Just the two cents of a humble beginner trader,
Feel free to leave any comments or feedback :)

XAUUSD Technical AnalysisSo far gold has been continuously retesting the descending wedge top resistance line, more than 3 times, proving to be a major resistance level.
The descending wedge looks to be a bullish flag in the 1D timeframe.
Technical Analysis for short term:
- Breakout above 1710 --> Take profit 1 @ 1720 the first resistance + TP 2 @ 1730 the historical major resistance
- A strong rejection from the top of the descending wedge at 1708 --> Take profit 1 @ 1692 the first support level + TP2 @ 1673 if it breaks below TP1
Stochastic Oscillator displays a descending crossover towards the 40 mark, typical of a bearish pattern.
MACD displays a slightly bullish slope in the green, although it would be noted there's a hidden divergence in the decreasing buy volumes. This possibly precedes a bearish reversal in near future.
Most Techical indicators point to a dying bull pressure, to a possible strong SELL in the short term.
Fundamental Analysis for long term:
Then again, GOLD is heavily sensitive to economic forecasts:
-Highest US household debt in record
Risk adverse investors fearing a possible second wave of pandemic after gradual easing of COVID measures
US- China Tensions and possible trade war
These points to investors turning to the one historic hedge against risk: GOLD , therefore we can look for a LONG TERM BUY opportunity. Things to watch out for is the China reaction to US accusations about the virus, an easing of tension would point to a temporary drop in gold price.

Analysis UpdateFeel free to check my XAU/USD history analysis by clicking the small arrow in the chart
PS: This trade fails if it can break out and close below 1677
Catalyst: Price action, US GDP -4.8%, Jobless claims 3839K, ISM and PMI

XAUUSD Spot gold scalpingXAUUSD in the trading range, need to close and stay above 1730 area to have a bullish notation, else if the latest spring fails , need to seek lower low for demand.

xauusd Hello Traders, here is the full analysis for this pair, short term
After the price has closed below the rising trend line on the 4-hour, we can enter selling at the trend line
let me know in the comment section below if you have any questions,

GOLD LONG UPDATEGold target price of $1566 I posted earlier on the weekend and today has been reached.
I will now be looking for LONG TERM short positions around this zone.

GOLD SHORT - LONG TERMPrice seems to reject my 50% fib level and I think its a good shorting opportunity going long term. Also, price seems to have broken out of the previous bullish wave and has since retested the previous support- now new resistance.
MY ENTRY PRICE IS AT $1572
INVALIDATION LEVEL OF $1600
LONG TERM TARGET AT $1182
i.e. for those who asked if I could post my idea when I make my short entry.
