Spread

SPX500/USOIL: Spread is reaching critical massThis has happened right before the last two crashes, and when the spread closed, a bottom (and a great long opportunity) formed. Watch this closely, the writing is on the wall. I'm holding SPY shorts, as well as oil, for the time being, expecting considerable downside in the short term. I think the catalyst will be on Friday, after NFP solidifies the rate hike fears.
See related ideas for more information. Please leave your comments or inquiries below.
I'll be making a live presentation this Friday, before NFP. Be sure to attend, I'll publish the link in this publication's updates.
Check out my updated track record here: pastebin.com
If interested in my real time whatsapp alerts and swing trading newsletter, or in personal tuition, contact me privately. I'm offering a considerable discount on a packaged course which includes access to my private trading signals list for a year.
Cheers!
Ivan Labrie
Link to Tim West's chatroom: www.tradingview.com
We discuss setups like this often there. Feel free to stop by and subscribe to his indicator pack. If you have any questions ask.
Risk disclaimer: My analysis is provided as general market commentary and does not constitute investment advice. I will not accept liability for any loss or damage including, without limitation, to any loss of profit which may arise directly or indirectly from use of or reliance on such information.

Looking for USDCHF + EURUSD Correlation Breakdown TradeUSDCHF has essentially been trading exactly off Euro news for a bit now and I think it wants to keep this trend going, regardless of strength/weakness of Swiss data coming out this week.
This presents an opportunity.
Look for Swiss data to move USDCHF out of correlation, play the retrace game back to where it "should" be given the price of EURUSD.
This is a pretty dicey trade, be careful and keep an eye on the price action in the ladders and get out if things seem to be breaking down for real. This correlation will exist until it doesn't so don't get caught in the shift.

CENX Broke 8.00 Price target 8.50 based on 1yr trendsIn both March and April of 2016, CENX has hit the 8.00 mark to later jump to 8.50 within 2 week's time. It is my estimate -based on these previous rallies and the upward momentum as of late that it will once again rally to this 8.50 price point. Be aware that I take this to be a short-term trade as within 1-2 week's time I expect it to fall at or below a 7.00 support price by August 31, 2016.

GBPUSD Weak as my grandmother. 1. Supply coming in: up bar wide spread with high-ultra high volume closing off the highs of the bar follow by a down bar that confirms this weakness (2).
3. No demand bar: up bar with average-wide spread closing off the highs with less volume than the previous 3 bars, this signal needs to be confirmed with a down bar.
4. Trap up move: down bar with super wide spread, clossing off the lows with high volume, may some demand enter in this bar, but you will know it if the next bar closes high.
5. Gotcha bar: down bar with ultra wide spread, closing at the lows or near the lows of the bar with ultra high volume, this bar confirms the weakness of the previous bar, and, confirm the weakness of the sequencial of 1 and 3 signals.
6. Stopping volume: up bar closin at the highs or near the highs with high-ultra high volume, this bar confirms that may there is some demand in the previous bar, but you need confirmation.
7. Supply coming in: down bar closing on the lows of the bar, with high volume. This bar says: if there is some demand in the previous bar, why i close at the lows? because the market is weak.
8-9. Test's: down bars with average-narrow spread closing at the lows-near the lows with volume less than the previous 5 bars. The second test is seeing after a gap so if it confirms, may we have some demand in the market. (The next bar is up but with low volume, so, the tests doesnt confirm).
10. Up-thrust. Down bar that is marked up at the beginning of the bar to close down, average-wide spread with average volume, this confirms the weakness of the failed test (9).
11. Up-thrust (my favorite in this chart). Down bar that is marked up at the beginning of the bar to close down, average-wide spread with average volume, this bar confirms that the market even in over-sold state, will not go up because there is weakness. This signal is seen in a zone of previous weakness (signals 5, 8-9, 10) so you can assume that the market will not go up until demand in form of test's or no supply-shake out take place.
12. Bottoms reversal. Down bar, ultra high-volume, wide spread closing at or near the lows followed by a up bar wide spread closing at or near the highs confirms demand in the previous bar (the down bar). This signal need confirmation (up bar with average-high volume) but how can see, the next bar is a narrow spread bar with volume less than the previous 5-6 bars.
13. Test. down bars with average-narrow spread closing at the lows-near the lows with volume less than the previous 2 bars.
14. Potentional climatic action or gotcha bar. Down bar with wide spread closing at the lows with ultra high volume. This bar take place and closes lower than all of the bar seen before it. So you can assume that if the next bar is down, this bar shows that smart money is selling.
To take a short trade: wait until the next bar closes, if this closes down (for the time of now, the bar looks like a up-thrust, that is a signal to go short) and it breaks the support line of the previous bar, you can scalp or trade in this timeframe to the short side.
I prefer to scalp the market when i see a up thrust, no demand, supply coming in after the breakout of the support line.
This methodology is purely VSA. Sorry for my bad english, im'not a native speaker.

Golden heights - XAUUSD The future, predictedAfter the birth into a brand new not so shiny market, I can happily say a vast majority of our active clients listened well and entered into XUAUSD positions with our platform www.STBinary.com
Moving forwards we will see no doubt a large accumalitive growth pattern with GOLD. Uncertainty is king remember. Trade re-negotiation deals are coming. Scottish and Irish referendums are coming. German French and Spanish changes are coming.
A brave new world indeed - If you want to change your life with trading gains, or simply wish to find out more please do get in touch. Sharing opinions and servicing clients is what we do ;)

KC shortUpdate on a upsloping trendline (blue) which acts as resistance
On the 5 hour chart, we should have generated a sell signal.
I still remain short via puyt spread 1x2s, as frost is no longer an issue. It appears the market is still digesting this from last week and should correct lower IMHO as physical supplies out of Brazil remain steady.
Warehouse stocks in EU and US plenty as well.
Dont get me wrong, as shown in the blue channel, even if we have a correction lower, the blue trend channel might indicate a change in trend, however the frost damage is simply not there and in order to rally, this market would need breaking news like that.... without anything of that sort coming out, I see a correction lower before making new highs.
Still, knowing coffee, I remain short with 1x2 calendar spreads, buying the downside 1 leg in one month and selling 2 lower puts in a month further back.

No frost in BrazilSeems like no frost in Brazil. It was a busy weeks last week and throughout the weekend with fears a frost could hit coffee areas. None has been confirmed and worst fears did not play out.
Once all of this is digested I expect some downside opportunities as the market goes back into trading technicals rather than emotions.
Quite oversold and we saw sell signals on RSI and Stochastik a while ago.
Also, the 5 hour chart will provide with a sell signal, which has been a superb indicator of short term price action (5-10 days).
I am short via 1x2 calendar put spreads, long the 135s in Q and short the 125s in U and various other like this. As we move lower, option vega will come in and provide some nice profits.
Also, selling the Sep (U16) contract provides with some good premium as this is considered the frost month.
Looking at futures spreads, they have been weak the past two trading sessions and also foreshadow price action.
Support at 134, then nothing until 125

Rising wedge, but for now running into supportAs we see some support is coming in from our longer term trend channel as well as the lower Bbands.
So far the last three weeks have provided with the expected sideways action once reaching 50.
Selling calls has been the right strategy so far (51, 52 and 53 calls).
At this support I am covering my short calls, but will hold of selling any put spreads to see how the FOMC decision plays out. I would not be surprised to see no rate hike and crude test some downside targets.
For now, neutral, but getting ready to sell some downside put spreads once we breach the support (if we do)

SPY, Short @ $211 w/ Call Credit Spread Still anticipating ranging markets. Opened a couple Bear/Credit Call Spread at $211/$216. I'm using a $5 spread because the R/R is better than $10 spread.
Credit = $2.25 (net $2.14)
Break even = $213.14
August Expiration*
* I likely will not hold on till expiration. I would use a SPY price drop to take profits and remove the risk.

Generated buy/cover signals on RSI StochastikGold bounced off of the support area for now
Light volume during recent bounce indicates this is a retracement in the downtrend
--> I threw in some Fibs to indicate where overhead resistance lies.
Resistance at:
- 7 day MA (currently there); a break would suggest the 20 day MA or the 38% FIb as target (1240ish)
- 23% Fib at 1224, 38% Fib at 1240
Overall: the lack of volume on the bounce indicates the lows might be tested again as the downtrend is still prevailing.
Took advantage of the break the last 5 days, but covering my short puts now
I dont have any sells signals yet, hence I am not doing anything until I see some

Change buy from neutral as strong support was found on trendlinePro Long:
- Trend line provided massive support (dark red line)
- High volume at support and during the rally
- future spreads very strong (N16-U16 turned into backwardation)
- If we close positive today 7 MA will cross 20 MA generating buy signal
Contra Long:
- running into resistance on middle Bollinger Band (20 day MA)
I sold the 2900 puts last week as a sideways prediction was put in place and will keep that position and add once I see a pull back into the lower trend line

Still waiting, beware bulls; risk reward not so greatPro Long (Chart):
- RSI and Stochastik created buy signal
- Orange support line
Pro Long (Physical):
- ICE warehouse stocks new lows
- spreads tightening ever so slightly
Contra (Chart):
- still in middle to upper end of trend channel
- room to go in terms of lower Bollinger band
- long term trend still down
- risk/reward for long position not there
IMHO I start looking into selling put spreads out in August or September. For example the U16 110/100 p spread.
Due to the negative put skew, 1x2s also work great IMHO (selling the one buying the 2s are also an interesting idea).

GBP/USD Time to BUYEvery time we get a new Brexit poll report or see another Euro based calendar event we are seeing large scale negative response on the GBP. HOWEVER, the overall direction on the larger trend is clearly for LONG and right now we are massively oversold.
Go Long, hold and earn big!
Come and check out our trading team today www.STBinary.com

GBP/USD Short Medium and Long termSo with the Uk referendum looming there are many theories on the future direction of the GBP/USD asset.
We are expecting an astronomical price surge and recovery once we skip over the pesky 23/06/16 calendar date.....
Buy large, hold long and get rich :) Come and see how we can apply this and more to our daily binary trading signals. Simple profit, daily results.

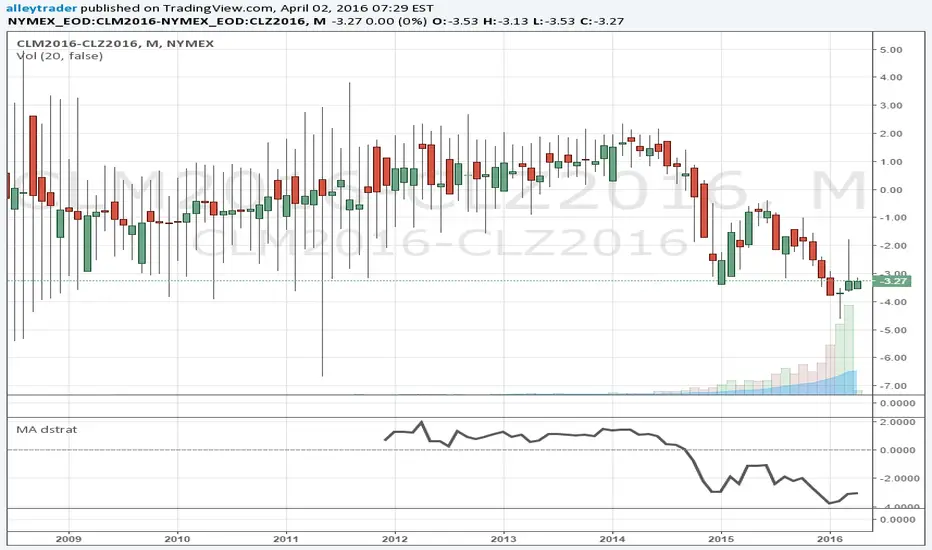
WTI calendar spread looking at chart you can see the spread in the oil front to back contracts displayed is normally closer to 0, currently the spread is around -3. So the idea is to buy the front month CL contract and sell the Z contract.
This also can be done with short options adding a decay component, contact me if you like further details on the option trade
Spread trading DAX - CAC: longUsing our indicators we have set a spread trading on DAX - CAC. It's the time to buy DAX and to sell CAC .

IWM Russel 2000 ETF after Market ReviewFor me this looks like a Bear-Flag in the downtrend. The Volatility Stop at 103.50$ is like a WALL.. If we break through Support at 100$ the next suppport is at abbout 94$. A Bear-Call-Spread above 108$ could be a good Idea.

Pair Trade - Short CNQ and Long XLEThis is a pair trade idea based on CNQ/XLE pair cointegration. My calculations show that these two stocks diverged by more than 2 standard deviation and, based on mean reversion, should come back to mean. This pair's rolling mean is 28.3 over the last 280 trading sessions. The current value is 23.6 and one standard deviation is 1.8. The trad can be done by shorting CNQ and going long XLE in the proportion calculated through beta. Alternatively, it can be entered as two credit spreads - bear call spread on CNQ and bull put spread on XLE. This is how I will be entering this trade on Monday when the market opens - $CNQ $22/$24 Feb 21 bear call spread for $0.5 cr and $XLE $57/$55 Feb 21 bear put spread for $0.6 cr. Will be watching the bear call side and adjust if necessary.

AMZN post earnings pre MarketIm expecting AMZ to Bounce of from 580 and than heading toward 200 SMA. Maybe Bear-Call-Spread for next week?

MSFT after Earnings pre Market Bull-Put-Spread IdeaIt seem like after Earnings yesterday MSFT is going to open between 54$ and 55$. It's going to be a retest gap. So I would wait for a Retest next week an then sell a Bull-Put-Spread in the purple area with a time of 1 to 2 weeks.


Market ExhaustionThe market has ran up this past week after it bounce. Now volume is running dry and it ran into heavy resistance. it also broke the trend line (yellow line) up top. We want to see price CLOSE below the light blue neck line before we enter a short position to fill the gap at 203.85.
