GBPCAD 4H long setupGBPCAD 4H Spring 💡 | Smart Money Accumulation Before Expansion
Watching a textbook Wyckoff spring unfold here on the 4H.
After a multi-day rally, price retraced, and liquidity built up just above 1.8713. What happened next?
🔻 We got a liquidity sweep, tagging below 1.8687 — then a sharp rejection wick back into the range. That’s the spring.
🧠 Why this matters:
Liquidity below the range is now likely cleared.
Smart money triggered stops and may now flip positioning.
Buyer momentum reclaiming the broken zone signals strength returning.
🎯 My Play:
Long entry after reclaim above 1.8713
Stop below 1.8687 wick low
Targeting 1.8828 > 1.8830 as TP1
Extended TP at 1.8928 — aligning with prior supply zone
⚠️ Invalidation if we lose 1.8685 with momentum and no absorption.
This is not a chase trade — it’s a calculated entry after weak hands were shaken out. Let the market prove strength, then ride the reversion.
📈 If this spring holds, I expect continuation toward prior highs.
Spring

US 30 Potential longUS30 – Wyckoff Spring Setup for NY Session | Intraday Execution Play
Price rallied in the London session with rising volume and structure breaks —
Now we’re anticipating a classic Wyckoff spring scenario just ahead of NY open.
📍 Key Expectations:
Sweep of intraday support around 43,482
Strong buyer reaction (spring confirmation)
Expansion into the 43,600+ zone — possible 1.5R+ continuation
⚠️ Volume buildup + stop placement below prior structure make this zone ripe for a fakeout → reversal.
I’m watching for a quick flush below the line → wick rejection → engulfing confirmation to trigger longs.
This is a trap trade — smart money baits shorts, I’m betting they get squeezed.
🔫 Entry: On confirmation after spring
📉 Invalidation: Below the spring low
🎯 Target: 43,610 zone and trailing after break of 43,570
Let them walk into the trap. Then pull the trigger.

BTCUSDT – Spring + S&R Rejection | 15min Power EntryBTCUSDT – Spring + S&R Rejection | 15min Power Entry
📅 June 26, 2025
Price swept support and printed a clean spring pattern on the 15-minute —
Rejection off key structure + volume surge confirms buyers are back in control.
✅ Demand stepped in hard
✅ Strong wick below consolidation
✅ Protected by the rising 200 EMA
✅ Entry aligns with a Fibonacci 1.618 projection target
I’m long to 109,290.56 — nothing less.
Stop is clean, invalidation obvious.
BTC just tapped the spring — I’m in.

EURUSD LONGPrice swept below support around 1.1473, grabbing liquidity and quickly bouncing back — this is a classic Wyckoff spring setup.
📌 Key Levels
Entry: Around 1.1500
Stop Loss: Below 1.1424 (spring low)
Target 1: 1.1567 (range high)
Target 2: 1.1614 (measured move)
🔍 Why I like this setup:
Fake breakdown (spring) and quick recovery
Buyers showed up right after the sweep
Expecting price to return to the top of the range and possibly break higher . This a trade we hold
💡 A spring is where smart money steps in after trapping sellers — I'm following them.
“I always say that you could publish my rules in the newspaper and no one would follow them. The key is consistency and discipline.”

US500 potential buyUS500 is setting up for a classic Wyckoff spring. This is a high probability set up with high risk to reward (5R+)
Here is what needs to happen
For situations 1 and 2,
a. price should break blue support (traps sellers and shakes out weak hands)
b. price should then close above any of the 2 blue supports with high volume
c. enter at the close of that bar or retest of the blue line
d. T.P @ recent high.
What do you think? how would you approach this better?

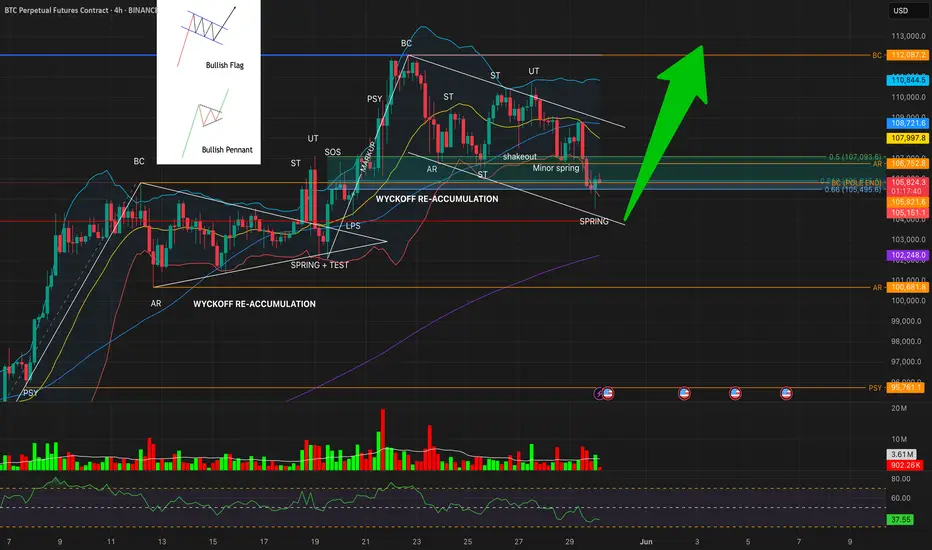
Bitcoin 4H Outlook: Dual Wyckoff Reaccumulation in Play⚙️ Technical Thesis:
We're currently witnessing the unfolding of two back-to-back Wyckoff reaccumulation structures on the 4H timeframe:
📦 Reaccumulation #1 (Left)
Structure: PSY → BC → AR → ST → Spring + Test → LPS → SOS
Bullish pennant formed after Spring, leading to a strong breakout
BC of this phase (105,821) now acts as a major upper resistance
📦 Reaccumulation #2 (Right)
Structure: BC → ST → UT → Shakeout → Minor Spring → SPRING (current)
Current price has tagged Spring at the convergence of:
Lower Bollinger Band ($105,174)
61.8% Fibonacci retracement ($105,915)
🧪 Market Internals
RSI: 38.31 → deeply oversold, aligned with a Spring phase
Volume: Fading on last leg down, hinting exhaustion
BBs:
Upper: $110,828
Basis: $108,006 (confluent with 55 SMA)
Lower: $105,174
200 SMA: $102,248 (macro support)
Pattern context: Another bullish flag is forming within the second structure
🎯 Trade Expectations (Pending Spring Test as Confirmation)
If this Spring holds:
🔄 LPS → Look for bullish reaction with increased volume
TP1: AR retest around $106,752
TP2: 55 SMA + BB Midline confluence at ~$108,000
TP3: Range target or previous BC level near $112,000–$113,000
A decisive break below $105,000 with RSI < 35 and rising volume would invalidate the Spring and shift focus to breakdown risk.
🔍 Wyckoff View
This is a classic Spring setup from a Wyckoff reaccumulation structure. Two sequential structures are visible, and the first structure’s BC now serves as the foundational support for the second. This kind of layered support builds conviction — but needs validation via LPS and SOS phases.
Yes the major trendline was broken, but we are now consolidation and reaccumulation for the next leg up, unless the pattern is invalidated.
🕹 No short setups active unless structural failure confirmed.
💬 Share your view: do you see this as a Spring or potential failure?
#BTCUSDT #Wyckoff #Reaccumulation #CryptoTrading #BitcoinAnalysis #TechnicalAnalysis #Spring #LPS
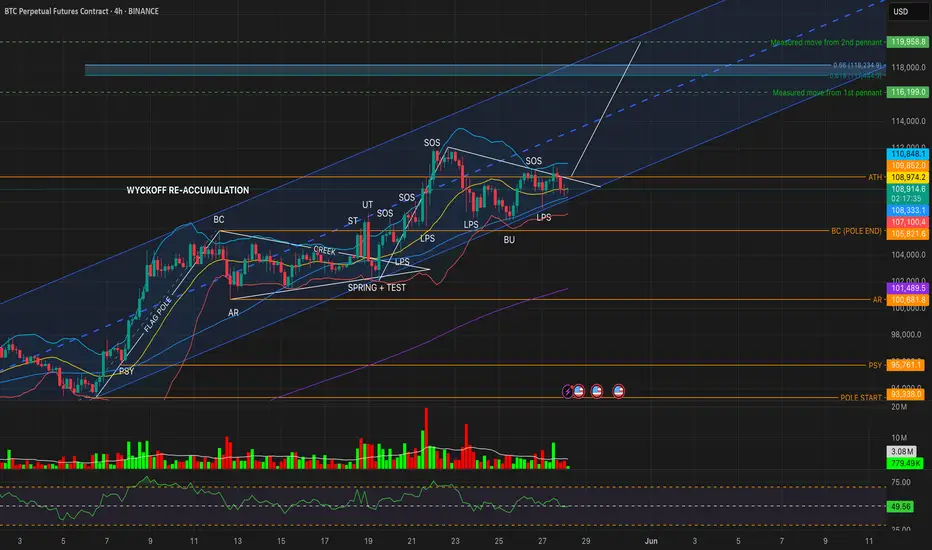
BTC 4H – Final Shakeout Before Markup?Bitcoin continues to coil below ATH resistance, now forming a second symmetrical pennant after the first flagpole breakout. Price is wedged between the ascending trendline support and persistent ATH rejection (~109.8K) — and the next move could define the entire Phase D → Phase E transition.
🧠 Wyckoff Reaccumulation Context:
✅ Spring + Test confirmed ~May 19
✅ Multiple LPS retests held around 107–108K
✅ Two clear SOS rallies tested above the creek
📌 Currently in late Phase D, facing third rejection from ATH
⚠️ Compression Observations:
RSI (14): 49.88 → neutral to bearish momentum
Volume: No conviction from either side
Lower BB + BU lows (~107K): A logical Spring zone for a potential wick-down fakeout
Price remains within channel and trendline support
🔄 Key Scenarios:
🟡 Bullish (Spring + Markup)
Wick below trendline to 107K zone
RSI bounce + green volume spike
Break + close above 110K → Confirms Phase E Markup
🎯 Targets:
Measured Move 1: 116,199
Measured Move 2 (Pennant): 119,958
Fib Cluster: 117,444 – 118,234
🔴 Bearish Breakdown
Close below 107K LPS with volume
RSI drops < 45
Structural failure → risks reversion to AR (~100.6K) and possibly BC
🧭 Conclusion:
Bitcoin is in the decision apex of a second pennant. If we see a wick-down + bounce (Spring-like behavior), it could be the last reload before a markup wave.
But without volume and momentum, this remains a fragile structure — stay patient, let the chart confirm.
#Bitcoin #BTCUSDT #Wyckoff #Pennant #CryptoTA #BTC4H #VolumeAnalysis #RSI
Us30 longThis is a very short term trade..
1 is a wave of fear
2 is a wave of panic
3 is a wave of stop outs, (I was stopped out too)
after wave3 buyers come in hot
I would advise entering after break and retest of the trendline. to recent high

Trapped sellers EU longEur group is showing strength, while USD shows weakness.
we can capitalize on that to be bullish on EU!

Strength on HPQ ChartHP Inc., stock approaches the bottom of the sideways channel (black horizontal lines) from which it may bounce again.
During the May 29, 2024 bar, professionals bought (blue rectangle), and since then, whenever the price reached this zone, they were buying more.
It should be noted that the buying around the bottom of the sideways is much bigger than the selling around its top which is bullish behaviour. Wyckoff's Spring on the recent activity adds to strength too. Another good sign for bulls is the decreasing volume on the down move, which indicates an absence of professional interest in lowering prices.
The testing process is ongoing as of today. If the price reaches the buying zone and no supply reappears, there is a big probability for a move up towards $37.30 - $ 39.29 with minor resistance around $34.62 - $34.72.
If supply reappears and the price breaks the bottom of the sideways channel ($32.41) we may see another leg down to $29.00 - $30.00 for more buying.

Strength on PCAR stock Paccar Inc. stock looks strong. We can see that since October 2024, the largest volume occurred after publishing earnings reports or on ex-dividend dates. Please note that:
- All bars on those days are down with the closing price in the middle of the bar which in Volume Spread Analysis (VSA) indicates strength.
- The volume on the October 22nd 2024 daily bar is the largest till now and the current price is above it.
- All professional activity after October 2024 is happening around the buying zone created during the October 22nd bar (blue rectangle $104.38 - $104.91).
- Recent buying (February 12th) breaks the previous low ($102.64) and recovers above that level which is a Wyckoff's Spring.
This all is very bullish. Still, the last testing showed the presence of supply.
If professionals can absorb the supply, we may expect a rally towards $116.01 - $117.83 with potential resistance in the $112.18 - $114.73 zone. Otherwise, another leg down to $100.01 for more buying is possible.

NLMK 1H Long Swing Trend TradeTrend Trade
+ short impulse
+ support level
+ biggest volume T1?
- 1 bar reversal?
+ volumed 2Sp
+ weak test to 1/2
+ first bullish bar closed entry
Calculated affordable virtual stop
1 to 2 R/R expandable to 1D if closed Sp take profit
Daily Trend
" + long impulse
+ 1/2 correction
+ JOC level
+ support level
+ volumed manipulation"
Monthly Trend
"+ long impulse
+ T2 level
+ support level
+ volumed manipulation"

AudJpy Long idea Long idea on AJ
Potential spring setup
Set alerts and wait for confirmation candle once taken stops

[MANAUSDT] - Keep ur eye on it!as u see ... clearly wyckoff accumulation on weekly chart
price now is at a rock bottom
i recommend it for long term investment.
best regards Ceciliones🎯

Currency Wars: Ep. 2I have identified new structure printed. I have thus decided to execute a buy position at the lower extreme of the price range. With the candle now closing bullish at the low, there is probability that price will hold. I aim to hold this position to as far as Friday, if able.

(COIN) coinbase "up and down -- volume" The custom indicator I created shows a pattern I'm not used to seeing on cryptocurrency. Stocks are quite different especially right now and with Coinbase. The consistent up and down pattern of volume in such short time frames shows the varied differences between cryptocurrency traders and stock traders.

EURJPY, Spring into this ABCD heavenThe first ABCD on the Pic starts the move from the 61% FIb retracement. Just noticing that
Then after the EMAs cross up, take all ABCDs.
Notice how important it is to have the confluence of a previous support.
For sure easy to see after the fact, but such pictures should be part of your collection and prep work so you believe it works.
One of the best indicators I know of... when the Springs work.
Yours truly,
The Spring Hunter

$NVDA S/R flipPrevious ATH on the daily is $480.88, on the 1H chart NVDA has tested this level as support twice in with price action that looks like a spring —> backtest of spring. Still exceeding expectations with earnings even if guidance wasn’t as bullish as people had hoped. Has obviously run up a lot but very strong uptrend and worth a go to get onboard the trend imo.

BOIL: Spring and Backtest with Hidden Bullish Divergence BOIL is preparing to shift out of the range as it Bullishly Diverges on the MACD during its spring and backtest and shifts out of the lower RSI Extremes.
We may just get a move to $90 and call it there, but I do think it's possible to see the $150s if this setup truly does result in the absolute bottom.

BB: Is at the PCZ of a Bullish Gartley and a Bullish Deep CrabBlackBerry is attempting a spring-and-back-test-of-spring at the bottom of the range that it's been trading within since 2012, and the level happens to align with the PCZ of a huge Bullish Deep on the left, to which it has reacted once before, and on its way to testing the zone a second time and back testing the spring. It's also formed a smaller, more localized Bullish Deep Gartley with some hidden Bullish Divergence on the MACD. If it manages to get back above $5 and stay above $5 in the active session, we would then have room to see it pump all the way up to $24.89 really fast as that is the next major level above and near the 200-Month SMA, but if things really want to get serious, we could see BB complete a Full Measured move of this range which would take it all the way up to the 50% retrace up at around $45.39

BTC BEAR TRAP : Trend Reversals 📈📉
Greetings, fellow traders! Today, let's explore a fascinating aspect of market dynamics – the concept that markets often change their trend direction when most participants least expect it. We'll dive into how we might currently be in a bear trap and what it could mean for a potential upswing.
📈 The Art of Contrarian Thinking: Market trends are tricky creatures. They often lure traders into thinking the current trend will continue indefinitely. However, seasoned investors understand that when everyone is convinced of a particular trend (bullish or bearish), the market may surprise with a reversal.
🐻 The Bear Trap: A bear trap is a situation where the market appears to be in a strong downtrend, leading traders to sell or short assets. However, this could be a cunning trick, as the market may reverse course, catching those overly bearish traders off guard.
📈 Signs of a Reversal: While we can't predict market movements with certainty, recognizing signs of a potential trend reversal is essential. This might include technical indicators, fundamental shifts, or sentiment changes.
🚀 The Anticipation of Growth: If we're currently in a bear trap, it suggests that the market sentiment is overly pessimistic. This can set the stage for a potential upswing when the market decides to confound the majority.
💡 Key Takeaway: The market has a way of playing tricks on participants. It's a reminder to remain adaptable in your trading strategy, ready to pivot when the unexpected happens.
🔮 The Future Unveiled: While recognizing a bear trap is insightful, always combine this with thorough analysis and risk management before making trading decisions.
In conclusion, market trends can be both persistent and deceptive. Understanding that trend reversals can happen when they're least expected empowers traders to navigate the markets with greater flexibility.
Stay vigilant, stay open-minded, and remember – in the world of trading, being prepared for the unexpected is often the key to success! 🧐🚀
❗See related ideas below❗
Follow + Like this post and share your insights in the comments; your engagement fuels the creation of valuable content! 💚💚💚

Workhorse is at a Support Between the 0.786 and 0.886 RetracesWorkhorse looks like it could be setting up for a Spring off of an Ice Line that aligns with the 0.786–0.886 Fibonacci Retraces. It also seems to be somewhat Bullishly Diverging on the MACD though not perfectly. If this turns out to be the bottom, then it could go for an inverted AB=CD move all the way up to the 1.272 Fibonacci Extension up at $125.92.

$ANY: Momentum Shifting Spring and Bullish SharkANY looks to be springging off an also support level that aligns with the 1.618 Fibonacci Extension of a Log Scale Bullish Shark while at the same time the RSI seems to be shifting it's momentum into the Bullish Control Zone; Hold these levels long Enough and it could rise up to the 50% Retrace up at around 2 dollars.
