EURUSD - This how a Wyckoff Spring Formation looks likeEvery chart has a story to tell and this is the story of this chart
The Story:
We are on a heavy down trend
Broke Support Level but with a very high PVR
This High PVR on the down wave were buyers. How do I know? I do not at that time, but I do know later on because price never broke the low of the down wave
Fast move up
The confirmation is the down wave with the High SI of 15.0 = HTMD (Hard to Move Done)
...and finally the entry is the up wave breaking the resistance level + more confirmation the PRL signal
Result 68 pips and now ranging. Looking for the next entry with the classic text book entry "Exit from Range with Plutus"
Enjoy!
Learn to Read and Trade any Market
Spring

AUDUSD - Possible Wyckoff Spring Coming UpEvery chart has a story to tell, this the story of this one. This video explains how to read the chart using volume waves, pvr, speed index and plutus signal

EURUSD - Wyckoff Spring formation on a Slow MondayEvery Chart has a story to say, that's the story of this one:
This video explains the Wyckoff Spring Formation after high volume and the long Plutus signals.
Enjoy!
Learn to Read and Trade any Market

$GASS: Challenging a Supply Line at a Support FloorStealthGas right now is attempting to Spring back above a Macro Support floor and break through a Supply Line it has formed within this range.
Upon breaking free from this supply line we should most likely see it go to atleast complete a 61.8% retrace.

ATOMUSD: Holding Support Above 0.786 RetraceAfter crashing below it and bottoming at the 0.886, ATOM has come back above the 0.786 and is Double Bottoming while Bullishly Diverging above a local trendline. If this action holds firm then I think it can see $22-$44.

CHZUSD: Holds Demand Line as it Attempts to Spring Above SupportChiliz after Retracing to the .886 PCZ of a Potential Bullish Deep Cypher has bounced back into a Previous Zone of Support and is now Holding on to a Potential Demand Line.
It also appears to be double bottoming on significant timeframes at these levels.
If CHZ can successfully hold the line here we could see it go up to target the Neckline of the Double Bottom at and if things go really insane we could see it make a full upside .886 Retrace.

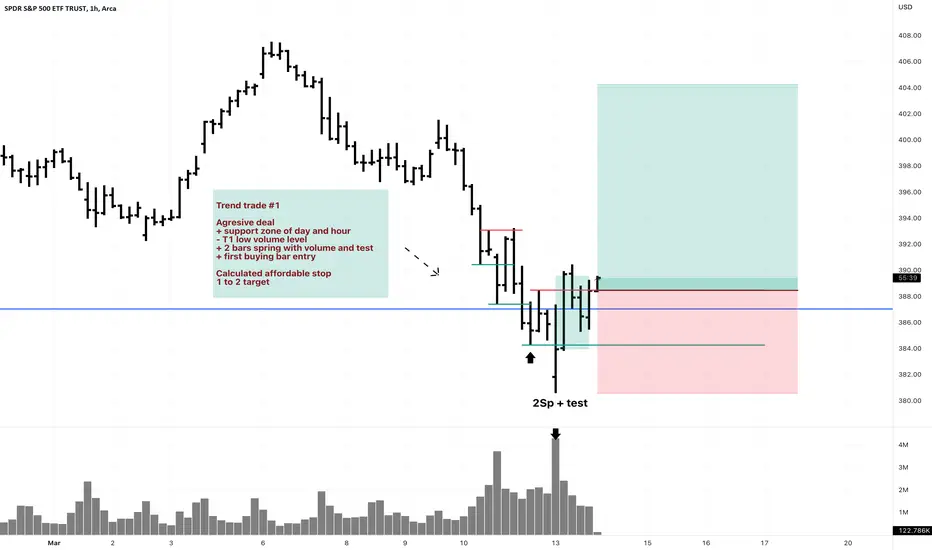
SPY 1H 2 bars spring with volume and test at day and support Trend trade #1
Agresive deal
+ support zone of day and hour
- T1 low volume level
+ 2 bars spring with volume and test
+ first buying bar entry
Calculated affordable stop
1 to 2 target
$SWN: Bullish Spring and Backtest with Bullish DivergenceSouthwestern Energy Company is potentially Backtesting a Spring at a Harmonic 1.618/1.272 Harmonic Confluence Zone while showing Extreme Levels of Bullish Divergence on the Weekly Timeframe; If SWN performs and pivots off of this level then we could see it go up all the way to the 800 Week EMA which would give us a Potential Upside of nearly 200%

HOOKUSD: Sits at PCZ of a Bullish GartleyThe MACD is prepped for a Bullish Crossing as it attempts to show its first confirmation of Bullish Convergence since hitting the PCZ the first time. If it can bounce here again it would be a Higher Low and Break Hook and Go off the Gartley PCZ which from there I think will have room to more than double in value.

One of the biggest accumulation phases in crypto historySecond test after the Spring phase done. This will get way higher than 50$. But yes, it will take time. Expect some violent moves. And I would not sell on the way up, this will go sideways at most during the re-accumulation ranges and people will FOMO hard after the 8$ resistance is broken.

Shangai Stock Index Wyckoff AccumulationJust an idea of a book trade for wyckoff accumulation schematics #1. If global economy goes down in 2023, we will see the final spring for basically all stock markets, including the chinese one.

Solana Showing Signs of Life Near the PCZ of a Bullish SharkSolana after bringing us a Weekly Double MACD Bullish Divergence Below Support has managed to Spring Back into the Major Support Zone that is confluent with a 1.618 Bullish Shark and is now Preparing to Bullishly Engulf the previous weekly candle in an attempt to hook on to the zone.
This can lead to us confirming the Old Support Zone as Support Again where we could then rally off the Support and take off to the Minimum Harmonic Target of $133.86 and if things are really Bullish; All Time Highs.
My only worries for this coin are it's previous connections with FTX but perhaps the technicals are hinting here that the FTX impact is not as bad as I initially perceived.

AUDCAD rises violently to resistanceAUDCAD rose to the first resistance due to a false break to support the average and is expected to rise more

Filecoin: Spring and Backtest of Spring with Bullish EngulfingFilecoin is attempting to confirm a backtest of spring in the form of a Break-Hook and Go while Bullishly Engulfing and holding Above the 200 Day Simple Moving Average. If this holds up i think it will be able to rise to The Fibonacci Extensions of the 1.618 and if lucky, the 2.618

NZDCHF: Backtest of Spring with Hidden Bullish DivergenceThe NZDCHF on the High Timeframes is trying to confirm an old Support it originally lost, as new Support again while showing Hidden Bullish Divergence on the MACD and it looks like price will be Challenging a Supply Line very soon which it will probably break above.

AKROUSD: Bullish Butterfly Spring and Backtest In Falling WedgeAKROUSD is Bullishly Diverging on the MACD and RSI as tje PCZ of a Bullish Butterfly while also trading within a Falling Wedge and Backtesting a Potential Spring.

Gold held key support, looks like bottom is inLooks like high probability that the gold bottom is in

BTC update after CPI data released. Hi dear community and my loyal followers. As you know actual CPI data released 7.1% but had expected 7.3% so both stock and crypto market reacted the news positively and pumped making the market green.
If you check my previous analysis about BTC short term update, You can see that I warned you about it, tweeted about new updates how I closed my short position at 16.8K and opened long at the same level.
I'm looking at daily timeframe and as you see I expect BTC bullish move towards 21.5-22K if it flips green zone and at the same time OBV breaks the mentioned blue channel and confirms trend strength with volume.
When you look at my daily chart you can notice how BTC diagonal support trendline held & how beautiful triple bottom on OBV chart played out very well.
If BTC breaks the mentioned green zone 18.5K it will confirm and increase probability that my previous analyses were accurate about BTC bottom and Wyckoff accumulation phase.
As you remember I mentioned many times that BTC real bottom was at 17.5K in June and the recent dump from 17.5K to 15.5K was a false breakdown/bear trap/ with double bottom pattern + many bullish divergences like 2021 November top which was a false breakout/ bull trap/ with double top = many bear divergences. At the same time I published Wyckoff accumulation phase and told you that the recent dump from 17.5 to 15.5K was a spring.
As you see on the chart I expect red line scenario for coming days. BTC more likely will hit 21.5-22K supply zone and rejects at that area and tests 18-18.5K resistance, then hits upper band of the Wyckoff accumulation zone.
If my scenario plays out, it will also confirm the weekly falling wedge breakout and retest posted bellow and my previous analyses.
Check bellow other bullish weekly charts and indicators I'm going to update.
If you like my ideas and analyses, don't forget to like and follow for further updates. I will appreciate any single follow, like & comment.

Wyckoff accumulation FTMare we in at the accumulation phase and did we already had the 'spring' ?
What do you think?
school.stockcharts.com

Litecoin to Bitcoin is Peaking Back Above Very Historic SupportLTC/BTC have traded against eachother within this huge range since the beginning and this range has always been well respected and now we are on the lower end of the range and have broken out of a Falling Wedge and are now Piercing back within the support zone we very much needed to stay above and now could be looking for a retrace back to the upper end of the range up at 0.025 BTC. if we then break above that level LTC will have likely have Blue Skies from there and could go well above 0.05BTC.

Wyckoff accumulation phase of a lifetime? I've posted my first accumulation idea here back in August 22nd
And it seems to have played out nicely.
Excited to see where this goes as I see this as an accumulation phase of a lifetime. We'll potentially reach the bottom within the next few weeks/months and this seems like a great time to accumulate BTC.
If Tether shows itself to be the next falling knife, we'll for sure reach levels below the currently indexed ones. But maybe that can be averted.

Long entry for XAU/USDAnything that doesn't make sense, please give me a comment. Please motivate me to develop myself and help someone needed.
Don't forget click like, it's a hug for me. Thank you!

BABA - Wyckoff accumulation patternNo one knows what will happen, but so far this is textbook accumulation pattern according to Wyckoff. Spring next??
