possible accumulation The fiber is trading in a range and we can notice an upthrust and apossible spring, we still cannot confirm that the low of today is the real spring, in fact if we trade in a conservative way we might wait other confirmations before thinking about opening a long trade, if you are more aggressive you might open a buy with tp and sl as highlighted on the chart above.
Pay attention at the fundametal news, especially on thursday during ECB event
If you want more specific information send me a direct message.
Francesco
Spring

BTC Wyckoff spring triggered by the ETH merge?Here's something I've been playing around with. The idea is that we're potentially almost at the end of an unusually short Wyckoff accumulation period. Coincidentally, then the spring would fit well with the time of the ETH merge. The merge could mean there's a lot of people that's playing the "buy the rumor, sell the news" game - potentially meaning a lot of gains will move from ETH into BTC and trigger the spring, signalling we're out of the bear market (semi-short term at least). I'm keeping an eye of the price range movements over this weekend to mid next week for a soft confirmation that we're in phase c.

Wyckoff accumulation + gartley pattern We can notice an accumulation phase in the market. Pay attention at the spring, if you zoom in the chart you can see that the low of the spring has broken the low of selling climax and that is a perfect liquidity grab used by istitutionals to open their big long positions.
Then you can see the gartley pattern that worked perfectly, now I expect a retracment and a continuation of the new uptrend

WYCKOFF analisysTHE CABLE 15 min chart analisys:
We can notice a possible accumulation range, we notice that the volumes are not high when the price reaches the resistance line and this means that the interest in selling is shrinking.
Now we should follow the price action, price could:
1 retest the support line and create another stronger spring (not likely)
2 moving up strongly and breaking the resistance ( we may consider to open a position ONLY if price retests the resistance line)
3 continuing the ranging market for the next 1-2 days ( in this case we SHOULD NOT open any long position because the accumulation scheme would have failed and it might be a redistributon).
Follow me and stay tuned!
The Italian trader

Posting an updated chart of my Wyckoff Accumulation ideaWe've probably reached the bottom on the 17'600 wick or have come very close to it. My proprietary risk metric allows for a minimum daily close of 16'400$, which we will potentially reach on a spring event in case this wyckoff accumulation plays out.
Previously:

BTC DIAMOND PATTERN ON THE 4HBTC has recently rejected at the $25,000 level with a SPRING candle or UPTHRUST Range as shown on the charts.
This is a very good chart for playing level to level, multiple DEVIATION levels.
BTC also has a Diamond on the 4H TF.
We either hold $24,000 and target $28808 that was broken and never retested, or we dump and make a new LL with the Diamond Pattern.
The pattern is 50/50 on my Analysis.
Happy Trading.

The SpringROKU has been undergoing a complex accumulation phase for the last 3 months. This chart shows the boundaries that have formed, and it can be broken down further into 5 zones of alternating 3-point moves (e.g. relative low, relative high, relative low).
Volume has decreased, volatility has decreased indicating accumulation. Also the DMI is characteristic of accumulation. This gap down on earnings will be the spring, it will get bought up fast.
Next to come will be the sign of strength, then backup/retest, and finally markup.
The green path is illustrative but the expectation is that it will be trading in the 90-110 range by end of August. Markup will take it to 130-180 by end of year and that will begin the next bullish cycle toward new all time highs in the years to come.

Springish Obvious and typical *Drunk Spider Web* pattern unfolding.
DMI indicates we just saw the spring of a wyckoff accumulation phase - still needs to complete sign of strength and backup/retest before markup.
Within this zone can also see a triangle that broke out, then retested support. However, ROKU has quite a web of resistance - could swing long near term calls around 100 strike and hedge 3:1 (perhaps Jul 8 100c, Jul 1 85p)
Confirmation for big long would need to see a run from here to around 111, then test of around 100 and bounce from there. If that plays out I’d become very bullish with initial target 140. Not Financial Advice.

Jumping your local creekBased on DMI and obv divergence on the 30min-1 hour time frame, this is a good setup to make a run back to upper 20k/lower 30k region.
Detecting equilibrium point 3-way intersection occurring around 6:30AM on Tuesday June 21st.
The way I see it BTC started trading bullish after the 17k got bought up and it’s looking like that was the spring of a very local accumulation phase, which would setup for an incoming sign of strength near the critical event on Tuesday morning. What would unfold if this materialized is a back up test and then continuation to near upper 20-lower 30k.. this would likely be part of a larger accumulation within the 17-30k range and could result in a larger spring down to the 13k level before initiating markup (and completion of corrective wave after big money loads the boat at average cost of 22k.
The blue lines are the local creek drawn at successive highs, we just saw an inflection from down current to up current which makes me think that that was a spring at 17k. The dashed purple are support across successive lows which might give some confirmation the sign of strength is coming if it can get back above the purple line immediately above price in chart.

BTCUSDT | Wyckoff Accumulation | Advanced Price Action Wyckoff Method | Wyckoff Accumulation | Advanced Price Action If Price Reject LPS Then We ll see short time Rally in Btcusdt Pric Move for Sign of Strength SOS so after backup BU we ll see Btcusdt price to bullish
Not a Financial Advice

APP Potential Spring - Waiting for backtestEyeballing APP here. On the daily we have three drives of classic bullish divergence on the MACD indicating price action reversal. So far, the price has indeed rallied. If APP can successfully backtest that $49.86 previous all-time low close here in late march, then I'll take a long with the chance for a very nice April/May return.
Also, the sellers failed to push the price down to the bottom of that descending channel. Further signalling a greater chance of a reversal and eventual breakout to the upside.
Entry: None yet, need a successful backtest of the spring.

Wyckoff accumulation for rune this is my theory about rune being in a accumulation zone. we should see a giant move down to the spring zone. which long term is the .618 fib. let me know if i need to simplify it more.

SRMUSD: Double Bottom Visible on WeeklyWe have Hidden Bullish Divergence at Support on the Daily and a Lower Low Double Bottom Spring of a potentially failed Double Top Pattern on the Weekly with Bullish Divergence and if it plays out we can very well see a rally up to $12 and if it breaks all time highs it will target $22-$24

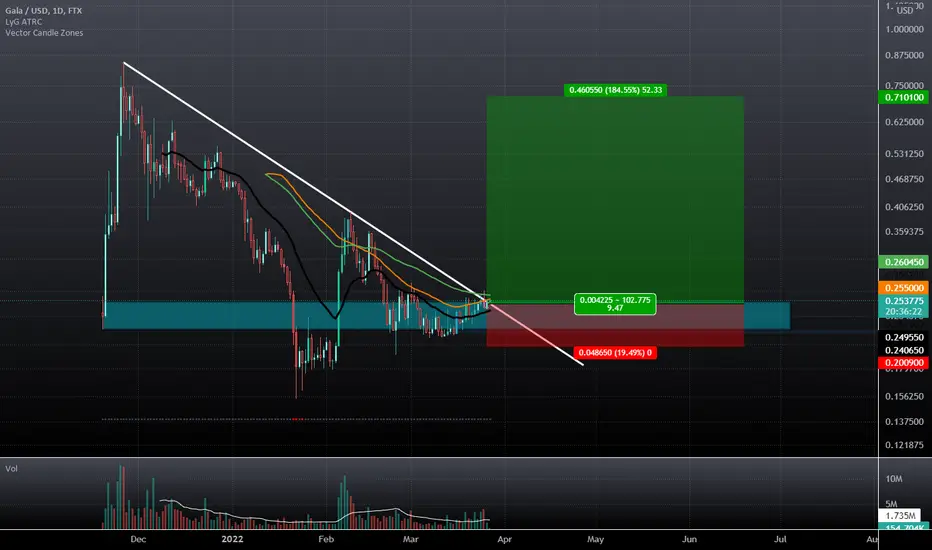
Bullish Dragon with Break Hook Go ConfirmationGALA looks like it has nearly 200% upside from here after giving us a Break Hook and Go confirmation on a Bullish Dragon and springing back above an old Support level.
OGN - For The Win!Happy Spring to all OGN holders! Over the past week, there has been a massive rise in price ~ mostly due to Origin Protocol announcing the full release of Origin Story, their NFT Marketplace. Cheers to this run, and many more!

Wyckoff Tape Reading - $AA - BullishBackground - Mar 20, 22
* 🐂
* Maybe at an oversold condition
Current Condition
* I don't see SOW 🚫 🐻
* Reactions on decreasing volume
* Coming to reaction -> re-rest at 90
What am I looking for
🐂 - high vol absorption at 90
🐂 - low vol reaction to 71 support and buy spring
🐻 - Don't see anything in the immediate future
Video Analysis cln.sh

AMC Wykoff If this plays out as wykoff a bounce from below this line is usually strong. A 18% minimum increase to next resistance seems likely.

KUB 4H way in the theory of Wyckoff Accumulation phase?KUB 4H way in the theory of Wyckoff Accumulation phase C
and is making Spring and Test
Do you think about this?
www.lucid-trader.com

Bullish Dragon Breakout on AmpltudeWe have broken back above a Bearish Trendline and are Springing back above the 1.13 fib extension while testing the Neckline of a Potential Double Bottom and the RSI is back above the 50 line. Best case scenario here is that this price action is followed by a major Retrace to the upside between the 61.8% and 78.6% Retraces.

Accumulation now over?Price has been trading within this range for the better part of 2 months now. Most probably an accumulation after the markdown. We are almost about to rocket out of there.
Looking for the spring and a close within this range again and show signs of building support
Alternatively We look for the break and retest of the resistance for a continuation down the channel

BTC possible Wyckoff Creek into SpringPersonally I have been favouring lower prices and retest of 28K
This set up mid downtrend is not my favourite scenario but it is getting a little hard to ignore now
Can see a few days of volatility decreasing and supply exhausting. Hate to admit it but there are conditions for a spring action here
Not being the bottom saint but this could very well be the new low and perhaps bouncing on an apex style formation on higher timeframes (See last idea)
Risk management must be applied well as always but the set up is too good to miss.
Pay to play! If this fails then we look to lower prices...

BTC in an accumulating phaseHello guys, as mentioned in previous ideas, im just a day trader sharing my ideas.
Please do not take them as financial advice, always do your own research.
As mention before, we've been shorting since 52k and waiting on BTC to descend to its highest support and demand zone, which spans all the way from 43k to 40k, to enter into some fresh LONG positions.
In the past few days we've seen a lot of volatility, and the pair is trading at 41k at the time of writing.
We can see a lot of buying volume rolling in, suggesting accumulation and leveraged traders are doubling down on their positions as the leverage ratio in exchanges is rapidly increasing (Which means traders are confident about their positions).
Finally we can see an interesting pattern forming which would suggest a trend reversal, the Wyckoff spring. There are a lot of ideas here about Wyckoff's accumulation phase here on TradingView, so I won't get into the details, but if that is whats going on, we should expect a pattern like the one drawn play out in the next few days.
I am still confident on my analysis, and Im personally happily accumulating more BTC at lower levels, averaging my positions.
If the price turns down from 40k, we can expect to revisit lower levels like 38k. If that plays out all we have to do is stay calm, stay away from high leverage and accumulate at lower prices to average out our positions.
Hope you guys are doing well and taking some profits along the way, money management is KEY.

Here we go again ! - BTCUSDT ANALYSISConclusion since the last analysis : we are always waiting for buying volumes and like I said in the few past analysis (attached to this one), if we don't find some buying volumes we will go deeper to find some.
So, we didn't find buying volumes and it's kinda frustrating because the setup was pretty to have a good signal : exhaust of volumes, buying pressure, majors levels and a nice start of short U-Turn. Unfortunetly the closing candle of the US session was murderous, we didn't had buying volume .... so we go deeper with selling volumes. Did it change something for us ? Absolutly not ! I said "lower it is better it is" in the yellow area (because the biggest level is the bottom of the area) and when I spoke about volumes at the first stop I said that I was expecting the same reaction on the bottom. And here we are ! We have volumes again, we have a selling exhaust again, we have buying pressure again, we have levels again, so .... we wait buying volumes again ! And I prefer to specify : the down channel isn't reintegrated, we are always on it.
Wyckoff pattern is hard to navigate, like I already explain, it's an emotional pattern, we search extreme fear to take the most of profit of the market. And until we didn't break the spring pattern there is no reason for me to change my vision of the future evolution.
I remind : "Making money in trading is math and respect of strategy, so never let your emotions guide you in uncomfortable positions" . If you change your mind before the end of your strategy, you don't applicate what you learned for.
What happen if we go deeper ?
In fact, in my strategy it's the last level to considerate the spring pattern, and so, the wyckoff accumulation pattern. If we see a selling volume breaking the pin, it's the end of the pattern and I will look for the next setup to target.
I said in one of my past analysis : "even if we go lower than the yellow area, don't forget that we are on support until $39,500 and we are not in bear market until $28,200" and it's always the case so there will be other opportunities.
I also want to remind : 0 entry on market since my first analysis about this pattern (9 days ago). Some beginner which trade with emotions have probably already took 3-4 positions .... and 3-4 stop loss. I said PATIENCE, WAIT, you win money by not loosing it . So just continue to do it until you have a clean signal in your strategy.
PS : Apologize for my english, I do my best. Don't forget to like, follow or even comment if you like, it give me some strength to continue !
