Spring

AAL - MONTHLY VIEW IDEAOR.....FELL BELOW SUPPORT. SPRUNG BACK ABOVE AND NOW RETEST THAT SUPPORT ON MONTHLY TIME FRAME !?! WE MIGHT NOT NEED NO STINKING DIVERGENCE !

the spring sprang sprungpossible spring confirming more upwards movement. I would say that is just about the last of <240 we will see for a couple days more low 240s to confirm.
suspending short positions for the time being to await further confirmation

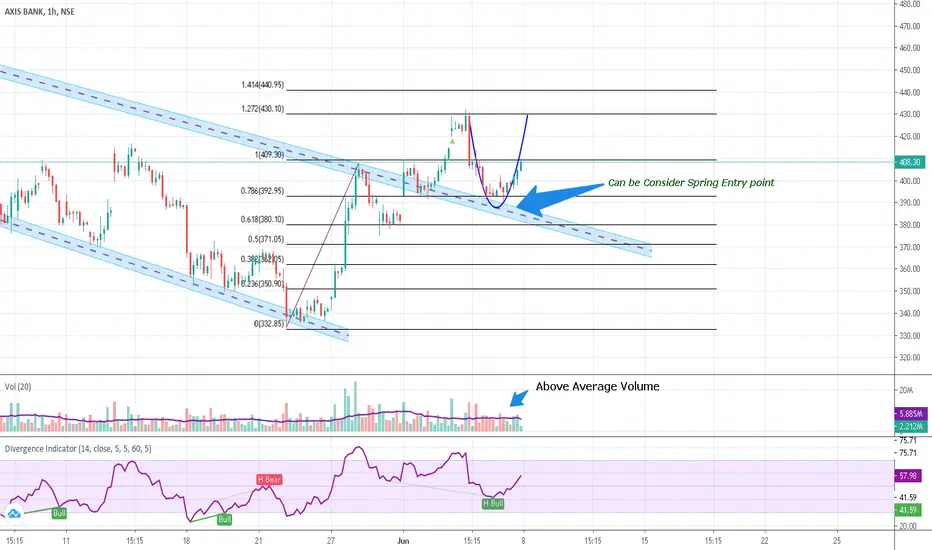
Axis Bank from 6 June 2020Channel has been broken ... spring entry position also validated .. cup formation expected ..
buy only above next fib level ..with good volume breakout.

EURGBP BUY WYCKOFF ACCUMULATIONThis patterns looks like WYCKOFF ACCUMULATION. Spring phase is soon going to finish go for the buy after your indicators turn green for buy. Below are few examples to show you how to trade this eurgbp trade.
USDCAD moved upward after Spring.
Buy more after you see triangle pattern near the resistance line. like I exactly Predicted in GBPUSD.
Hit the like button if you find it helpful and informative and follow to catch the waves correctly

Trade Journal: Long $ZM - Inside Day Setup - 3/27/2020ZM has been gaining a lot of attention lately due to COVID-19 and the rising demand for online conferencing programs. ZM had recently broke out but has been relaxing for the last 3 days after reaching a high of 164. The last 2 days, ZM formed inside candlesticks on the daily chart indicating that a breakout may be imminent.
Following yesterday's post on ZM, the inside day candlestick trade triggered today at 147. I was not able to catch the initial breakout, however I did catch some shares during the late morning retracement at $150 and put my stop loss at today's low.
Entry - 150.76
Stop loss - 145
Target - 175
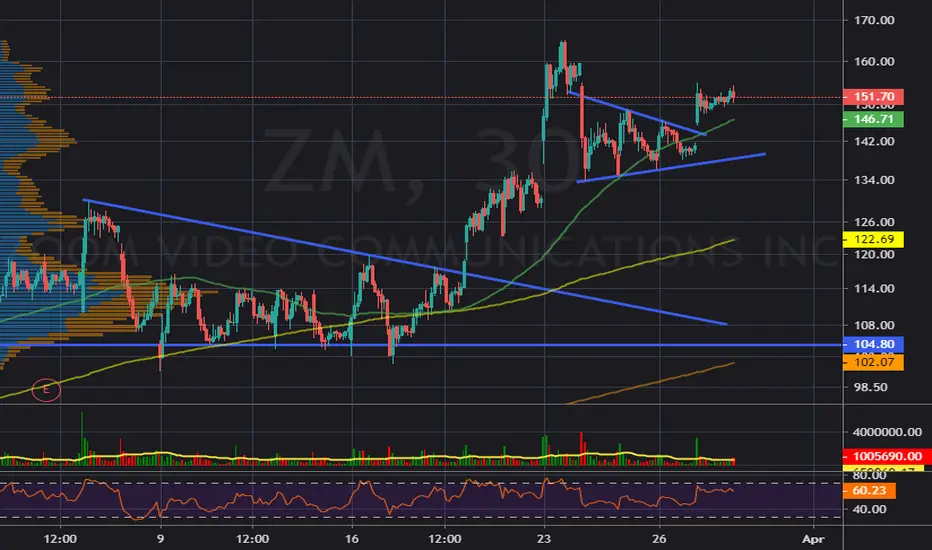
Trade Idea: Long $ZM @ 1472 inside day candlesticks are forming in ZM as a coiled spring is forming on the lower timeframes. ZM has not participated in the recent market bounce and seems to be acting inversely to the action. Watch ZM to start breaking out today or tomorrow above 147.
Long @ 147
Stop Loss @ Below today's low.
Target @ 180

Spring 4 H ???Well, we know what is happening right now rgarding Covid-19
considering that could be a possible spring wich can be helpful to make a little profit , but becareful , the market is still bearish.
I would enter a position with a tight SL.
Target 23
If more than 23 , i could be a trap .. becareful.
I hope this is helpful , I tend to share my ideas and I would like also to get a feedback on that.
Thanks
Check Stoch, for the entry.:)

JSE:ANG Anglogold SpringAfter dropping below the trading range, the yearly pivot point and 200 Day SMA, today it has rallied and is showing a reversal bar. This looks like a spring and what is expected now is for the markup in Phase D. Due to the high volume we may have a test of the spring again to use up the last bit of supply but in the weeks to come we are looking for a markup to the top of the trading range and then a breakout and markup to higher prices.

Type 2 Spring Means Bullish Accumulation But Expect RetestsThe closing hour today printed a type 2 wyckoff spring which means it tested support to a moderate depth compared to the selling climax and also moderate volume.
This is bullish and means this more likely an accumulation zone than distribution however because it's a type 2 spring there are probably going to continue to be tests lower in the range to fully shake out the weak hand bulls so the strong hands can absorb all they can before it moves higher out of this range.
I am not about to buy this blindly but will be looking for low risk entries on tests of the prior wicks.

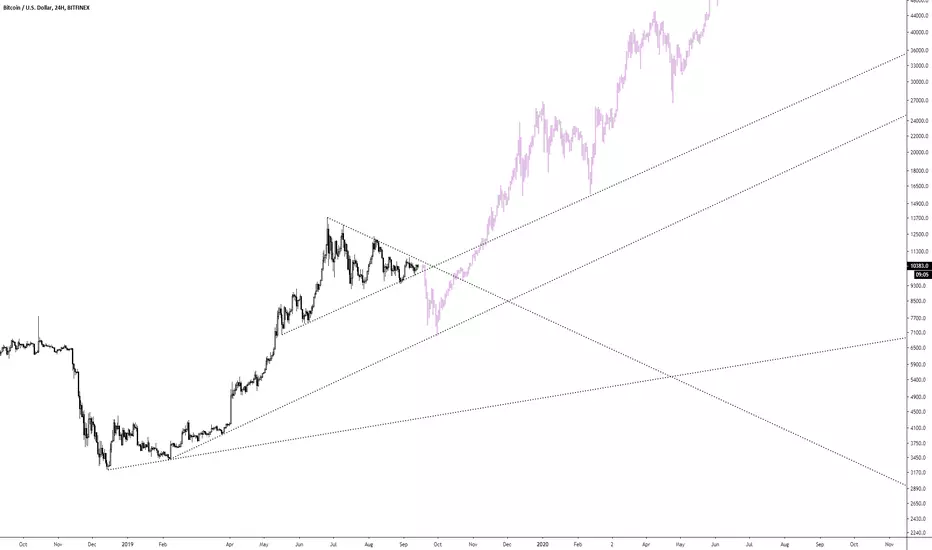
PLAN A FOR CRYPTO SPRING 2020"To the moon, to the sky, to the highest ever price!" - this is what you will see and hear everywhere after BTC will reach 13k+ in April. But be smart. Bitcoin is in a phase of tremendous volatility and that means the short-term nature of any strong movement.

XAUUSD Buy WYCKOFF ACCUMULATION #1XAUUSD Buy setup. I figured out WYCKOFF theory in Gold. Every wave was easy to predict. expecting more buys in gold.
previous Charts


Shakeout/spring vs Drop after distribution On the left we have the coinbase 4hr chart from October.
You can see the shakeout drop from 7990 to 7300
There is a spike in volume which acts as a spring to pump price to 10540
On the right we have the coinbase 4hr chart from November.
Don't be fooled in to thinking this is the same price action.
After distribution finished, the price dropped.
Slowed by the moving average, walls on exchanges to encourage people to long.
Compare the volume profile.
So far there is no volume here and once enough leveraged longs are in, I expect the drop to continue.
There could be a small rise to liquidate bottom shorters, in which case I would be looking at 9030-9070.

BTC Wyckoff AccumulationPS - Preliminary Support (buys provide a bounce to slow move down)
SC - Selling Climax (Buys absorb remaining sells , end of panic sell off)
AR - Automatic Rally (Price rise caused by volume buys and lack of sells on the orderbook)
ST - Secondary Test (retest of support, may occur multiple times)
Shake Out - Volume sell to drop price encouraging inexperienced traders to close their longs opened at ST and possibly cause additional panic sells
Spring - Buy orders filled from Shake Out and price rises sharply and orders clear remaining sell orders
Test - Test of available supply. Low supply results in price mark up breaking previous resistance levels
SOS - SIgn of Strength (Often a result of high volume buying or fomo after a spring)
LPS - Last Point of Support (Test for Resistance / Support flip, Puillback)
BU - Back-up - After a jump across the creek move, the price often experiences retest of support and will pull back close to the low after the SOS
TR - Trading Range (Caused by profit taking at the end of the SOS and re-accumulation at the new price range)
Length / duration can vary.
Set range high as next high after SOS
Set range low as LPS after SOS

BTC descending channel with HTF horizontalsBTC descending channel with HTF horizontals and descending resistance. Keeping it simple with lower green demand pool highlighted.


BTCUSD 1H chart (5/8/2019)Good morning traders. I hope my continued insistence on risk management over everything else has gotten through to everyone. Yesterday's surprise news -- the Binance "hack" -- was a good example of the importance of risk management. Price dropped just over $200, as a result of the news, which liquidated many traders. The positive side to this is that Binance will cover the lost funds so traders didn't really lose anything. Normally, we would've expected to see a $1000 drop due to the news yet we only saw a third of that, and this morning we have already seen price recover all but $25 so far.
During the drop, in our Discord last night, I mentioned that I wouldn't be surprised to see price rise back up and even make new 2019 highs pretty quickly. Why? Because accumulation has been occurring for quite a while which should mean that there isn't a lot of loose asset in the market. If much of the asset is in professional hands due to cyclical accumulation, then retail doesn't have the supply to cause price to drop significantly and stay down when they sell emotionally based on the Binance news. If this is the case, then the most likely result is that the professionals should be scooping up the retail selling. And here we are this morning, with a high that is just a few dollars off the price level when the news broke. Personally, I went long at $5772. I attempted to enter at $5720, after the 15 minute candle closed and confirmed a likely bounce, but couldn't get the order confirmed with the exchange until the higher price due to the overloaded servers. So I remain long toward my upper targets that I have mentioned numerous times in previous analysis.
The 1H chart shows a great reversal candle at the bottom of the drop. We can see that price ultimately bounced at the EQ of the May 3rd TR with the candle body being supported by the HVN at $5750. Note that the volume associated with this reversal candle was greater than the volume associated with the supply candle prior to it (demand is stronger than supply). But even that supply candle's volume was less than the volume of the similar $200 supply candle earlier that morning. This tells us that there isn't as much interest in selling at these lower prices which generally means that price is ready to continue moving higher. I have relabeled the recent price action to better fit the activity seen last night. Price is now back above the 21 EMA and the top of the May 3rd TR, and has reclaimed the ascending red channel's EQ, which is bullish. It should also be noted that the move down also helped price possibly play out the 4H bearish divergence that was printing. If price can close above $5910, then I believe we will be seeing $6000 much sooner than later. I continue to watch for a close above the swing high at $5970.
Every day, we have a choice to act positively or negatively, so if you get a chance, do something decent for someone today which could be as simple as sharing a nice word with them. You just might change their day, or even their life.
Remember, you can always click on the "share" button in the lower right hand of the screen, under the chart, and then click on "Make it mine" from the popup menu in order to get a live version of the chart that you can explore on your own.

JSE:INP JSE:INL Investec Waiting for MarkupInvestec has formed a Trading Range (TR) after Preliminary Support (PS), Selling Climax (SC), Automatic Rally (AR) and Secondary Test (ST). There has been low absorption volume in Phase B and we have now seen a spring and test in Phase C. After the test is done we can expect a markup in the TR in Phase D to the top of the TR.

JSE:FBR Famous Brands Eyeing MarkupFamous Brands was in a Markdown until the end of 2017. The downward stride has been broken after a selling climax and low volume accumulation. We have now seen a spring form and tests on lower volume. The expectation is for the markup in Phase D to start back to the Yearly Pivot Point before a potential Markup in Phase E.

JSE:NRP NEPI Rockcastle Potential Spring and TestNEPI has been range bound since February. At the end of November we have seen a spring on high volume. There has been a lower volume test and I am waiting for a good bullish bar to start building a position and a jump across the 200Day SMA. However, some caution is still needed as the 200Day SMA seems to be holding. There is divergence on the Volume RSI confirming buyers in the market.
