Bitcoin : Christmas Dead Cat Bounce over ? What's next ? Hello traders.
Going to open a short position around this 4170 area at the next 4hr red candle for several reasons :
- We are around a 0.786 Fib Retracement from the previous 4.4k top and 3.1 bottom which is a key level for reversal.
- We are making a nasty bearish divergence on RSI, MACD and Stoch, they have proven their worth during this bear market.
- It looks like we might be forming a falling wedge, which is a bearish pattern.
- There is always a story of power in a trend which is most of the time defined by volume. As you can see, the volume on this last pump is really not significant compared to the overall volume of the move. It was a push that was showing that the current trend might be weakening, so we want to participate in the pullback. Looking to find 3541 as first target being the 0.618 Fib retracement of this upward move. Risk Reward ratio is 3, pretty safe.
What's next for BTC ?
From my experience, bottoms, real bottoms, never flatten out and then spring like the action we have seen this past week. Actual bottoms are violent formation with huge wicks in the candles, enormous % variation and very brutal action. I don't define the 3.1 low as bottom, therefore I think we will see lower levels in the beginning of Q1 or later this year. I don't want to hurt feelings of the newly found bulls on this platform but I think this is only a dead cat bounce that has had a violent spring fueled by FOMO and broken dreams. Now if this is a spring, we need to see if this was the end of the action or if there is more. Basically, the intensity and volume of the coming pullback should give us clues to whats next. If BTC manages to stand it's ground at the 0.618 Fib and look for higher prices, we might be able to make a medium term higher high before going to find the real bottom. If BTC fails to hold the 2 levels that are on the chart, things will probably turn pretty ugly.
Stay Open-Minded and Trade Safe.
Wishing you all a Merry Christmas and beautiful end of the year celebrations !
CR.
Spring

BTC/USD 30 min/4H charts (12/20/2018)Good morning, traders. I was wrong yesterday and it appears that Bitcoin had one more leg up. This is why I continue to stress the importance of risk management, not only in your entry but also in your exit. If you watch my morning live streams then you know I consistently discuss the importance of having your exits figured out before you enter a trade. This includes, as I have stated numerous times, that point at which the trade goes against you. Fortunately, my manual trailing stop loss was hit and I was able to still notch a 16% portfolio profit on yesterday's move down while I slept as a result. Sure, I missed the extra bit of upward momentum but I ended up with a significant profit for one day's trade and I can now look to short once more this morning.
Last night's move up touched the top of the TR which also happens to be the 4H R4 pivot as well as the target off the smaller wedge I discussed in the Tuesday update and noted as the red dotted line, though I believe I referred to it as dashed (). The 30 minute chart gives you an updated EW count which aligns with the slightly higher grey price tool target based on the larger wedge's width. The MACD histogram is already printing hidden bullish divergence as well signalling a possible last subwave up. However, we could see a truncated 5th subwave. The end of this first large wave, around $4220, would put price where we would expect it to be in terms of accumulation (between the AR and failed upthrust's high). For reference, please refer to the Wyckoff accumulation schematics. Furthermore, a 61.8% retrace from the projected $4220 high would be at the EQ of the light blue demand zone. Price would also be getting support from the ascending black dotted line. All of this strengthens the likelihood of yesterday's mentioned orange path, though the LPS would be about $100-$150 higher at that point. Based on this larger TR that we have been working with for a few weeks now, if we get a bounce from that blue demand, I believe the possibility of a Spring would be greatly diminished which means we could very well have seen our lowest point of this correction. Refer, specifically, to Wyckoff accumulation schematic #2 as a general guide. It also means that we should expect to end up back in the 2018 TR within the next few weeks at the most.
None of this guarantees that we won't go down further, whether it's just for a Spring or to even lower targets, but it does provide more support for the narrative that I am discussing. As such, traders must continue to concentrate most of their effort on their risk management. I have outlined the proposed path on the 4H chart.
As mentioned previously, yesterday's Fed comment that it will raise interest rates .25% gave DXY a strong initial bounce. However, the Fed sounded much less dovish than anticipated which caused the stock market to drop. This drop took price below the 2018 TR and I expect that we will see continues downward movement, at least in the near term though we should at least expect some sort of relief bounce before too long. I will continue to watch price action and volume to get an idea if price will make another attempt at the top of the TR or if it will find resistance at the bottom. Since that initial DXY pop, we have seen DXY continue its downward path as I mentioned we were likely to see. As a matter of fact, DXY hit my 96.20 target exactly as traders/investors seem convinced that the Fed will not raise interest rates in 2019 thereby taking the wind out of DXY's sails. As a result, the EUR/USD pair had a strong run overnight, topping out at 1.14857. I was in a short yesterday that hit my trailing stop before this move up late last night, which exited my position in a very small profit (nothing to write home about, but confirmed upward momentum), and I am currently watching price action as I look for an entry today.
Every day, we have a choice to act positively or negatively, so if you get a chance, do something decent for someone today which could be as simple as sharing a nice word with them. You just might change their day, or even their life.
Remember, you can always click on the "share" button in the lower right hand of the screen, under the chart, and then click on "Make it mine" from the popup menu in order to get a live version of the chart that you can explore on your own.

BTC/USD 1H/1D charts (12/14/2018)Good morning, traders. Once again, it pays to watch the morning live stream. After the breakdown of the small descending triangle, I stated that the most likely scenario was to see price print an SFP around $3200, which is exactly what happened. Price is now consolidating toward the large red descending broadening wedge's resistance. If price pops up and through it, then price should target $3360/$3370. Failure to get that pop will likely see price targeting the $3000 area. I would not be surprised to see this latter scenario develop as there appears to be a concerted effort to push price down toward that level. Watching the order books, any time price gets to the point that it should pop, we see supply being dumped onto buyers while demand remains significant below $3200. One likely explanation is that there are large buyers in that area who are trying to get their orders filled. So, it is just something to keep in mind as price moves. Price is currently working off the hidden bearish divergence on the 1H TF. This clears the way for a possible move up as described above without the impediment of such a divergence to keep it from ascending in the near-term.
The 1D saw a breakdown of the pennant that was printing. The target of that breakdown is $2950 which would pull price through the bottom of the descending wedge and back to the dashed red resistance line which began with the drop out of the $6000s. This would produce a strong bear trap if it plays out prior to December 16/17th. Interestingly, the ATH was on December 17, 2018. The conspiracy theories would run hard and long if that date this year were to produce the lowest point of this correction. There is a possible double bottom printing as well, if not the left shoulder and head of an IHS. RSI continues to flirt with oversold following recent bullish divergence. It has been printing higher lows toward the area of resistance around 32-33. Logically, since we are bouncing off the ascending channel's support, we would look for price to target the top of the channel but this is not guaranteed. Reaching that point also puts price at the red wedge's resistance. Don't forget that a close above that resistance sets up a target of $1150 above the point at which price breaches it. Additionally, reaching that target confirms the double bottom (if an IHS doesn't play out first) thereby creating a target of $5430. If the IHS prints, then I will update with a target based on that particular pattern as well.
Don't forget, we have discussed the possibility of a trip down to the $2500/$2600 area as well, but the further down you continue to look, the greater the likelihood we won't make it that far. What this means for traders is increased risk. The question is, would the increase in profit justify the exponential increase in risk? Only you can decide that for yourself. A good rule of thumb is that if your reward doesn't increase 2x for every 1x of risk your trade increases, then it isn't worth it. The idea is that you should be looking for exponential compensation in order to take on increased risk.
The DXY continued up overnight and into this morning but appears to be potentially topping out one more. I closed out my EUR/USD long yesterday for about 30 pips of profit after it was confirmed that price would not advance any further. I am now long EUR/USD once more. Stocks continue to have a bad time. As usual, early morning buying resulted in distribution the rest of the day. There was a bit of demand showing up toward the end of it, but not enough to create anything more than a doji for the 1D candle. Price now has a lower gap to fill as a result.
Every day, we have a choice to act positively or negatively, so if you get a chance, do something decent for someone today which could be as simple as sharing a nice word with them. You just might change their day, or even their life.
Remember, you can always click on the "share" button in the lower right hand of the screen, under the chart, and then click on "Make it mine" from the popup menu in order to get a live version of the chart that you can explore on your own.

JSE:NPN Naspers Testing the Long-term Trend Channel Naspers has been in a down sloping channel since it a throw over of the long-term trend channel and Buying Climax (BC) formed in November 2017. It has now reached the oversold line of the long-term channel and there has been some bullish action. We see a spring with increase in volume on the reaction also seen in gaps to the upside. The Volume RSI has shown divergence with price since the start of the downward sloping channel. This all seems bullish but a jump of the 200Day SMA would have to be seen to confirm the markup in Phase D.

BTC/USD 30 min/1D charts (12/7/2018)Good morning, traders. As I discussed was most likely to happen, during yesterday morning's live stream, Bitcoin dropped down to the $3200/3300 level depending on which exchange you were monitoring. There wasn't any immediate pop back up though so price bears closer attention at this time. The 1D chart shows a nice descending wedge and the 30 minute shows an equally nice ascending channel. The 1D and 3D RSI are printing strong bullish divergence as well.
A break upward through the ascending triangle's resistance should have price targeting the $3540 area. This will put it right back into the TR. But it must first close above the McGinley Dynamic on that 30 minute TF. This latest downward move has defined the very likely support level of a descending channel. If this is the case, then the expectation should be a move up to the top of the channel. The target mentioned above brings price to the channel's equilibrium which is the first expected resistance when trading channels. If this move down was a spring associated with the $3475-$4120 TR, then I am looking for the move up as spoken of, followed by a Test back down toward the bottom of the TR at around $3475. A successful Test should then see price making its way back up toward the top of the TR. The volume on the potential Spring was more than I would've liked to have seen, so a good Test (low volume) would be imperative to signal a successful Spring. We would then likely see a pullback at the top of the channel, creating an LPS. Again, we would be looking for low volume on that pullback.
We also talked during the live stream about the larger picture and how this move down could be printing a double bottom. This pattern won't be confirmed until we see the daily close above the swing high at $4409. So, until then, it is just a possibility. The target based on that pattern would be $5430, which takes price right up to resistance. What happens after that depends on supply and demand. As long as demand is greater than supply, price will press through that level which would bring up the 2018 TR as the target. But, as mentioned, price must first close above the 30 minute TF McGinley Dynamic in order to set up a possible push through the ascending triangle. If price cannot do this, then we will continue looking lower for the targets mentioned throughout this week in my other analysis.
Bitcoin price remains under pressure this morning and its continued attempts to pull itself away from the resistance line that's been keeping it in check since the drop from the $6000s have failed. Price has fallen through the black support line on yesterday's 4H chart which sets up a downside target of $1040 below the point of breach. This would put it between $2677 and the S3 pivot at $2725. Overnight a double bottom was seen on the 15 minute chart which saw price shooting back up toward that black line only to be rejected on its attempt to push through. Volume continues to pick up in the $3600-$3800 area suggesting demand continues to remain present there but the longer price sits in this area the more likely that demand is to dry up.
In FOREX news, U.S. NFP numbers were released today and they were pretty ugly (as I have been suggesting was most likely throughout this week) at 150K v. the consensus of 200K. This gave our Discord members opportunity to capitalize and make money as price hit our USD/CAD and EUR/USD targets. I exited my long USD/CHF position near the 50% retrace, at about 25 pips profit, as I stated was my intention during yesterday morning's live stream. I then entered long in that same pair at 0.99079 after the report this morning, which was near the bottom of the drop (because I saw bullish RSI divergence on the 5 minute TF) and exited at 0.99307 for a similar profit. I then shorted at 0.99287 and am currently sitting at about 8 pips profit and expecting continued pressure on the USD as the algos and retail traders work out their positions relating to the news.
Every day, we have a choice to act positively or negatively, so if you get a chance, do something decent for someone today which could be as simple as sharing a nice word with them. You just might change their day, or even their life.
Remember, you can always click on the "share" button in the lower right hand of the screen, under the chart, and then click on "Make it mine" from the popup menu in order to get a live version of the chart that you can explore on your own.

BTC/USD 1D/1M charts (11/20/2018)Good morning, traders. I was wrong about a pop back up after price breached the $4900/$5000 level and price has continued to move through lower areas of liquidity and support with only minor pauses. This is why I have yet to take a long position. Emotional trading and/or lack of patience are the most significant reasons why retail traders lose money. While waiting for a good entry doesn't guarantee you will be profitable, it does decrease your risk exponentially. Since trading is speculation, protection of capital should always come before growth of capital.
That being said, we appear to be bouncing out of $4200 which is the next area of support. So, what have I been looking for in terms of confirmation? As I mentioned during the live streams, I am waiting for a nice hammer or other strong bullish candle on the 4H TF, at the least, but preferably on the 1D, 3D, and/or 1W. Additionally, a bullish engulfing candle on one of those larger TFs would also qualify as confirmation of a bounce at the very least. This should be preceded by a lot of very negative sentiment noticeable throughout social media (which I believe we are in the process of seeing). Although volume is higher on this week of downward movement than it has been lately, the reality is that it is very small compared to the Selling Climax in February. This leads me to believe that the current shakeout is a #2 Spring which is most readily associated with a Terminal Shakeout. Whereas the #1 Spring in February is denoted by the large and increasing candle spreads and expanding volume (large drop with large supply), the #2 Spring is denoted by large and increasing candle spreads but only moderately expanding volume (large drop with moderate supply). The question is, is this the 21 or 23 version of #2 Spring? We need to continue watching price action and volume to get an idea.
If you have been paying attention, then you will have noticed that Bitfinex Longs have been increasing steadily during this downswing. Why is this important? Because you should have noticed that a significant number of longs have been liquidated as well. This means that more Long positions are being opened than closed on the down move suggesting absorption. Additionally, Shorts have continued to build as price dropped further. This leads me to believe that smart money is going long while retail is going short. Possible support for such an analysis can be found in social media as the general sentiment is despair and pain. These Shorts will help fuel the move up as much of the supply should have been removed during 2018's accumulation as well as the recent shakeout. Any strong movement back up should see retail traders FOMOing in as well thereby accelerating that rebound. There is no guarantee that all of this will happen, but it remains the most likely scenario at this time, once this shakeout is complete.
The 1D has printed a large descending wedge of approximately $1200 width at its widest so far. This wedge also has the requisite four alternating touches to support and resistance. What does this mean? It means that if price happens to close above the descending resistance of that wedge, before making a new low, then we should be looking for a target of $1200 above that point. Consequently, the recent low and subsequent bounce so far has been a reaction to the 1M OB which I pointed out during yesterday's live stream. There should be an expectation of resistance at $5000 and the bottom of the 2018 TR at around $5800/$6000. A close above $6500 sets up strong additional bullish momentum. There is further support around the $3600/$3700 level.
Remember, you can always click on the "share" button in the lower right hand of the screen, under the chart, and then click on "Make it mine" from the popup menu in order to get a live version of the chart that you can explore on your own.

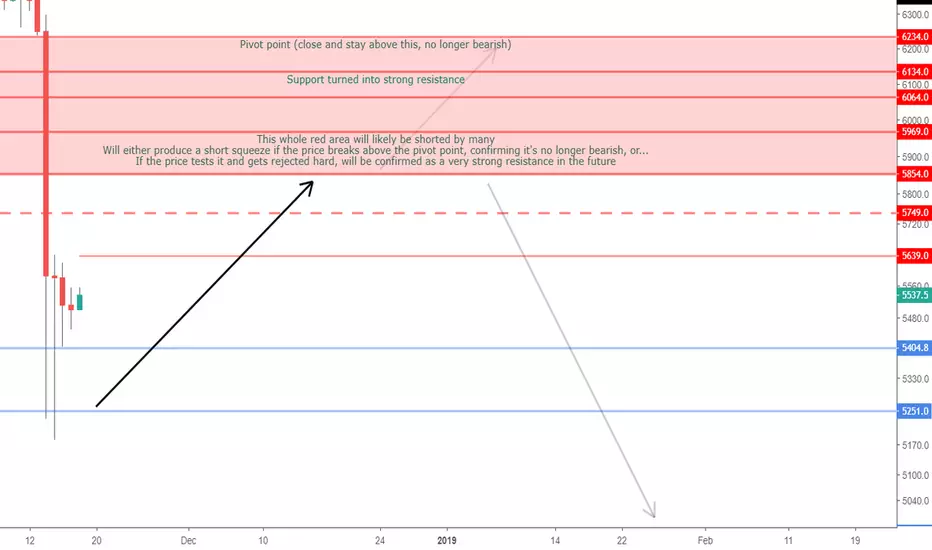
BTC broke key support - Is it game over?The support that held this market for a year has now broken.
Is it game over and all hope lost for the bulls?
Almost, but not yet.
These markets are tricky, and they don't usually let something that looked like a little too obvious "bottom" at 5800-6100 area to actually be the bottom.
Larger players know that there were lots of stop loss orders just below those levels.
When you know this and have the capital to push the market just enough to trigger those stop losses in a chain reaction (one stop loss triggers the next, and so on), it is only natural that you're going to try to tap all that free liquidity by giving the price just a little nudge in that direction, and leave the rest to domino effect of panic selling and stop loss triggering along with liquidations of overleveraged traders.
All of this while you have your buy orders waiting at the lower prices where those liquidations and stop losses will be sold into and absorbed.
This is also why these kinds of moves are called shakeouts.
It is the equivalent of shaking a tree while holding open a large bag below, and see what falls from the tree into the bag.
You do this only when you see the tree has lots of ripe fruits ready to drop.
This same phenomenon is also known as Wyckoff spring, phase C in Wyckoff accumulation schematic (where market operators test the demand by shaking out most of those who bought near the bottom, before the markup phase).
That was the bullish case (and also the last hope for the bulls).
No one can tell for sure if we're witnessing a shakeout or an actual market breakdown at this point, but there is a way to find out.
How do we find out?
We watch for the characteristics of a shakeout vs a real breakdown.
1. If this is a shakeout (Wyckoff spring), then the price tends to stay below the key support (in this case 5800-6200 area) only for a short time, and then shoots right back up above the support area where it can no longer be threatened by the bears.
In our case, that would mean the price must not stay below 5800 when the monthly candle closes (in 12 days from now), and ideally after that time we should see it break above 6000.
On the other side...
2. If this is a real breakdown, then what usually happens is, the price tries to test the previous support (now turned into resistance) which is the 5850-6200 area, and there it gets rejected hard due to many people waiting the retest to short sell or get out of their bad (trapped) buy entries.
Note that if the bearish momentum is stronger than usual, then these retests only barely touch the lower boundaries of the resistance area (in this case that's 5749-5854).
And finally, this below is the chart of the Wyckoff accumulation range (in case this happens to be accumulation, and we can't know that for sure yet) I posted back in July, along with what kind of moves I'd expect to see in order for it to play out.
As you can see, it played out pretty well so far (as close as you can guess moves in a 5-6 months timespan).
Now it remains to be seen which of the two options I described above are going to happen in order to confirm the trading plan for the next few months from now.
Bitcoin to the moon! don't miss the last chance to buy! Wyckoff!bears have been selling for 9 months but they have been way too excited! it looks like we hit support here, but just wait! they haven't heard about a man called Richard D. Wyckoff. 1874 baby!
target hit, now we go up to 20k when bakkt launches. don't miss your chance!

Trying times for Bitcoin; what happens next?Price has to close in the trading range-5777 sometime this week or next in order to be considered a Wyckoffspring. If not, this might signal continuation of the trend. Also, the 100WMA hovers just around the new yearly low so, price might not get below it so easily. Considering a new cycle low has been formed confirmed by cycle time zones in horizontal blue lines, might be difficult for bears to out in a new low just yet.

BTC/USD 1D chart (11/15/2018) Price up?Good morning, traders. I hope you were able to join the live stream yesterday morning as we discussed exactly what happened, calmly and unemotionally (okay, so I may have laughed a bit) -- how it was playing out as I suggested it would months ago if we saw a terminal shakeout and what to expect next. So far, things continue to play out as expected. The next few days are crucial, however, in determining which way price is likely to go. The reality of it is that the 1D RSI is obscenely low at 14 and the 4H remains oversold at 9 after closing at an anemic 5.5 yesterday morning. We even see the 3D moving into oversold territory this morning. This means that we should expect a good bounce at the very least. No, it doesn't happen immediately, but it should happen sooner rather than later. As such, traders should be paying attention to the 1D chart.
Not all price drops are created equal. So, what do I believe happened yesterday? I believe it was a terminal shakeout. A normal shakeout/spring is initiated during a bullish/upward trend and is a product of, or otherwise characterized by, weakening price. A terminal shakeout, however, is preceded by a trading range and comes at the end of accumulation, signalling that the preparation for mark up is complete. If you've been following me for a few months then you know price had been in a tight TR since the end of the first week in September. That's just over 2 months. You can also zoom out and notice that it had been in a larger TR since the Selling Climax on February 5th. Whichever you choose to look at, the reality is that this drop came after being in a TR for quite a while making it much more likely to be a terminal shakeout than a normal drop toward $3000 as the result of a descending triangle.
The purpose of the terminal shakeout is to scare the remaining weak hands into selling their asset prior to mark up commencing by creating a false impression of the direction of the market thereby creating a "bear trap." It does this by running stops on longs and encouraging short selling. Once the shorts are locked in and stops have been run, price reverses causing shorts to liquidate or cover as well as FOMO into longs from those sitting on the sidelines. Watching tucsky.github.io we were able to witness longs' stops getting triggered and numerous, significant, liquidations. Bitfinex shorts grew 8500 in the past 24 hours. That's 45%. And of course www.coinfarm.online showed Bitmex shorts growing substantially as well, causing the funding rate to flip strong and hard to shorts paying exponentially more to longs (www.coinfarm.online). Remember, all contributors to the market affect price finding, so although Bitfinex is having its own issues with the new bank and Tether's value, and Bitmex deals with swaps, rather than spot, these things help us get a clearer picture of what's going on in the market. The terminal shakeout results from poor quality supply which is another way of saying weak hands hold too much supply. It is then answered with high quality demand. The key in all of this is how much supply is removed from the market and how much of that supply is absorbed. This will become much more clear in the next few days. So far, we saw large volume on yesterday's drop suggesting that C.O. was hard at work absorbing the supply. We continue to see good-to-decent volume today, suggesting the same. Importantly, the volume yesterday was much lower than the SC in February which tells us that there is much less supply floating around than there was back then, further suggesting 2018 has likely been accumulation.
At this point, price has hit my first target area between $5250 and $5460. We may see a bit more downside, however, which would tap liquidity sitting just under $5000. If price happens to make it that far down, my expectation at this time is to see a good-sized candle as price rebounds out of that liquidity. The buildup of shorts on the shakeout should help fuel upward momentum. I expect to see a Test around the bottom of the 2018 accumulation TR ($5900 area) before continuing higher once buying picks up, but depending on just how much supply has been removed from the market, price may overshoot that level.
Remember, you can always click on the "share" button in the lower right hand of the screen, under the chart, and then click on "Make it mine" from the popup menu in order to get a live version of the chart that you can explore on your own.

BTC/USD 15 min/4H charts (11/6/2018)Good morning, traders. It looks like we've got things fixed on my end so I should be back without interruption now. Since the last time I posted, price has continued to move as I outlined that it was likely to do, having reached the top of the blue TR and then retraced a bit within it to print an LPS. Price topped out at $6475 which was just above the flag target of $6460. This gave price just over $150 of upward movement. Shorts have continued to drop off significantly (currently at 21473) on Bitfinex as we discussed would happen, with the Shorts-to-Longs ratio now sitting at 0.8797. Additionally, Bitmex shorts and longs are even at this time.
Price is being supported by the 4H pivot, showing expanding volume on the rallies and contracting volume on the reactions. This is bullish price action, but it is a 4H TF and nothing larger so I'd like to see more confirmation via continued rising OBV. Currently, I'm watching for OBV to breach the descending blue resistance line. Overnight, RSI breached its own descending black resistance line and is bullish at 61. MACD is sitting just under the signal line waiting to cross bullishly. There was the slightest hidden bullish divergence between 23:00 CST on 11/3 and 2:00 CST this morning which resulted in the current 4H candle showing price appreciation up through the equilibrium of the blue TR. Traders need to remain vigilant because price needs a nice, strong push up to avoid possible bearish divergence which is likely to be more pronounced on the MACD. This bearish divergence would play into the 1D scenario mentioned below. Spot price is showing strong resistance at $6500 on various exchanges while swap price on Bitmex is showing significant support between $6350 and $6400. This being as it is, Bitstamp is currently showing 500 BTC support at $6300 which is greater than 2x the resistance at any point up to $6800 so far. Local diagonal resistance has been noted with a descending red line on price.
The 15 minute OBV has been trending upward for the past week and has recently breached the descending blue resistance line dating back to 10/15, which is significant on this very small TF. However, it wasn't a strongly bullish break, rather it has been more of riding along the resistance/support for the past two days. If we consider that price is being contained rather than supported, as I have been suggesting based on volume and price action, then that would explain this OBV action since C.O. money is part of the smart money. So, having to sell into the rallies to keep price contained would necessarily have the effect of keeping OBV contained as well. OBV is printing a descending broadening wedge, which gives us the expectation of an increase which should result in a higher price as well. MACD just crossed bullishly and RSI is bullish at 54.5. I'd like to see RSI cleanly break 62.5 on this TF to suggest strong bullishness. Local diagonal resistance and support has been noted with red lines on price.
I will provide and discuss the 1D chart in greater detail during this morning's live stream at 10 a.m. CST as well as upside targets, but it notes that RSI breached the resistance of the triangle it has been printing since its July high and is sitting bullishly at 52.5. MACD is continuing to increase but presents the possibility of hidden bullish divergence printing some time this week, starting at 10/31. MACD is pretty short on that day, so if price drops, as long as it remains above that day's low of $6199, we could likely see a lower low in MACD and a higher low in price, suggesting continued price appreciation. With overall volume continuing to dwindle, this described price action is a strong possibility. In that case, I will be watching the 1D red diagonal support and resistance lines. Daily OBV has breached its own resistance as well, which is an encouraging sign for market bullishness.
Overall, price remains within the larger two-month-old black TR between $6095 and $6587. Once price moves through the resistance or support of that TR, I will evaluate the movement to decide whether I will enter at that time. Until then, all this little movement is nothing more than noise with a risk that is far too great in exchange for any reward for me.
Remember, you can always click on the "share" button in the lower right hand of the screen, under the chart, and then click on "Make it mine" from the popup menu in order to get a live version of the chart that you can explore on your own.

BTC/USD 1H/4H charts (11/01/2018)Good morning, traders. The Internet is, once again, anything but stable this morning so there won't be a live stream but I will record a video and upload it as soon as the connection is stable enough to do so. Tech comes tomorrow so by Monday we should be good to go. During yesterday morning's live stream, we witnessed price doing what I suggested it would. The break to the downside stopped just about $5 from my target. After that we saw significant buying as price immediately shot up $150 right into my upper target range. This was a small shakeout which created the liquidity needed to break out of the local TR. I continue seeing the emotionally bearish "analysts" finding new reasons why price MUST go down and stay down, but my reasons for it not doing so have remained unchanged throughout this year.
The shakeout yesterday created a short TF double bottom by closing above the highest point between them. Based on the pattern, we should see price targeting the $6370 area. Doing so will bring price back up into the larger blue TR thereby confirming the drop four days ago was a spring on that TR (LPS on the larger TF black TR). In this case, we should expect price to continue up as it creates multiple LPS's in the blue TR, ultimately targeting the top of the larger TF black TR that's been in play for two months. This is also the R3 pivot on the 4H chart at $6587. There is the slight possibility that price will not continue to head upward toward the $6370 target since yesterday's high was pretty close to it at $6350 and pattern targets often don't play out exactly as drawn. The 4H OBV isn't convincing at this time, but that can change by the time the candle closes as the 15 minute OBV is showing us what I want to see -- upward movement.
Yesterday's pop sent 4H RSI to the resistance line, but not through it. This kept it from printing bearish divergence. If you were watching my live stream yesterday morning, then you know that price has held almost perfectly within the quick potential flag I drew right after price popped. My bias based on the volume and price action is up rather than down at this time, but a close below the $6250/$6255 level will suggest possible lower movement and I may change my opinion at that time. As long as price remains above yesterday's swing low at $6199.25, traders have little reason to be concerned. As mentioned yesterday, two gaps remain on the 15 minute chart at $6291 and $6229. In most cases, price returns to fill the gaps but these particular gaps appear to be breakaway gaps (decisive movement, associated with heavy volume, out of the local TR) which means we don't usually expect them to fill as price is expected to continue moving in the direction of the breakaway.
With all this in mind, if price plays out as a flag, then the expected target based on the flagpole is around $6460. This would put it at the top of the blue TR/4H R1 pivot. Currently this is the expected movement, as explained above, while price targets the top of the larger TF black TR. The 4H RSI is printing a flag right under resistance at the moment increasing support for the idea that price will continue higher. However, as always, nothing is guaranteed in trading so traders should utilize strong risk management. Price dropping below the swing low from yesterday sets up an initial target of the bottom of that same black TR at around $6094/4H S5 pivot.
Overall, price remains within the larger two-month-old black TR between $6095 and $6587. Once price moves through the resistance or support of that TR, I will evaluate the movement to decide whether I will enter at that time. Until then, all this little movement is nothing more than noise with a risk that is far too great in exchange for any reward for me.
Remember, you can always click on the "share" button in the lower right hand of the screen, under the chart, and then click on "Make it mine" from the popup menu in order to get a live version of the chart that you can explore on your own.

BTC Macro Wyckoff Phase C?
The Weekly chart is great at filtering out noise. I refer back to it for a clearer picture of what's going on without having to see ugly wicks from bart patterns and the like. It's obvious that we are in a down trend. It's important to note that we broke the February lows, but did not close below as the market rallied to close above 6k. The first thing that jumps out to me from a Wyckoff perspective is the increasing bearish effort that is producing a decreasing result in terms of spread and close to close as seen in the past three bearish bars. This is evidence of decreasing bearish momentum on the way down as larger hands seem to be quietly absorbing supply. Those familiar with Wyckoff might also recognize the possible spring situation that we have found ourselves in. From a macro view, we might say that this is a spring type #2. Please refer to Bruce's blog post for more background: stockcharts.com
If we are indeed in a spring situation, we'd like to see this level hold. #2 springs don't need to be tested, but they can be, so we'd watch to see how the market reacts to a test. Lower volume on a test would show signs of support. The bullish case would have us making multiple last points of support on the way up.
Another idea within the accumulation trading range bias is that this is just another ST in Phase B. Either way, It may be tradable to the upside with a stop under the most recent lows.
Good luck.


Wyckoff Accumulation Schematic?My last chart was a complete disaster.
Even though I pinpointed where the last dip should stop, the bounce was disappointing.
Now, this looks like a classic Wyckoff Accumulation, the only difference I see is the "Creek" not going all the way to the resistance levels.
If it does happen, we should expect a spring any time soon, with an increase in volume and an abrupt pump.
We shall see.
cmtassociation.org

Wyckof Accumulation Schematic? My last chart was a complete disaster.
Even though I pinpointed where the last dip should stop, the bounce was disappointing.
Now, this looks like a classic Wyckoff Acc. Schematic, the only difference I see is the "Creek" not going all the way to the resistance levels.
If it does happen, we should expect a spring any time soon, with an increase in volume and an abrupt pump.
We shall see.
cmtassociation.org

EURUSD 15M Bullish Divergence with Spring A good scenario for continuation with conservative take profit.
Follow me if you would like more signals!

Bitcoin 2018 Spring Roadmap, IRS/Tax April Cashout Theory [BTFD]Greetings once again BTFD members, lurkers and first timers!
Weclome to the greatest show on Earth right now!!!!
Its been a really fun and exciting path towards finding the TRUE value of Bitcoin since the rather over-inflated peaks of December and January
So what is the true value of bitcoin? its different for every person to be frank and thats why its having such a hard time finding its floor and is performing exactly how it should considering the tech and what it does and can be used for
my main theory which has also been confirmed now by a few other btc charters such as goldbug,
the US Tax/IRS stuff concludes on April 15th or so i am to believe, meaning people who bought and sold BTC last tax year now will have pretty large taxes to pay off, many people probably didnt know or realise this until too late and hence why there has been such a huge sell offs every week about $5-20bn has been going OUT of the market and not coming back in nearly as much, the Mcap clearly show this
So im charting that after 15th April we might see some trickles of life coming in to back bitcoin back up to some even stupider levels than the last all time high
BUT.....
until the 15th im totally bearish and by looks of things we are going to see a sub $4k bitcoin after all.
i expect the sell-off to be quite short and the rebuy very fast as i have been saying since last year this would play out around these levels
so you can use my chart as a guide for rest of the spring/summer and see if my theory is right, be nice if it is, cause im leveraging every part of it this year!
WHEN MOON? WHEN PARABOLIC?
End goals if the Gann fans hold then im seeing a nice cross around $12.5k for a first target and then back onto test ATH's after a small correction/pullback
Will be a Golden cross formed if the buying after sub$4k is steady and fast
Expect bounces on fib levels and we will go much more into detail via the telegram and our new discord playroom (PM me for details)
JOIN US ON THE LINKS BELOW for 24/7 FREE Bitcoin and crypto coin analysis and ZERO pump and dump spam :)

Power Ledger Possible break-out ScenarioPOWR is showing a textbook falling wedge patter. We can see the upper and lower limit produce lower highs and lows; while the MACD is showing stronger accumulation since 1/17/18.
This combination of rising MACD and a condensing falling wedge has me feeling short term skeptical maybe even a little bearish as I look for it to fall it the 3000 area. But with there being strong evidence of support at 3000 in Decembe rof last year I'm looking for the low to be about .00003150.
From that low, IF we break out of the wedge and the MACD continues to rise, I'd expect to test the .382 and maybe even the .618 retracement levels. In this market its about outperforming BTC and I'm betting on the intermediate upside of POWR as BTC looks to stabilize. I am BULLISH on the future of POWR
Not advice - DYOR - Happy Vernal Equinox Day
Hoping Spring brings life back to our precious market.
*Delgado*

BTC GAINING TRACTIONLadies and Gentlemen, spring us almost upon us once again. With it, nature comes booms back to life, we are witnesses to the trees and flowers beginning to blossom, we're being teased with warmer weather, and our dear friend Bitcoin is starting to kick back into gear. When analyzing the future of BTC you can find 20 different "experts" who will give you 40 different expectations, some bearish, many bullish, some think its worthless, and some think it should be $1M. But no matter what you believe there is one constant that remains, people BELIEVE in this industry and in its potential. Now I'm not saying belief alone is enough to push an industry past all the FUD, all the fear, or all the corporate naysayers who are scared of crypto making their business obsolete. But what I am saying is that smart, hard working people all over the WORLD are dedicating their lives to the development of crypto, and that should spark inspiration in all of us. People from all walks of life working to bring together a fair and accessible financial system to better connect people and business around the globe is something I can get behind; and with BTC being for forerunner it has to garner most of our attention for the time being.
With that said lets hop into the 1D chart of BTC! 1D is looking great, we saw a beautiful morning doji form on the 25th, followed by a long green candle to confirm a bullish pattern. From there we can see that BTC is finding new levels of support around 10300, and is currently forming a bullish engulfing pattern over the 2/28 candle. Ideally this candle stays long and green today which should set us up nicely to gather support near the .5 Fib retracement (near 10900 or 11000).
MACD 12 has risen over the 26, and is braking above 0 for the first time in since January. The last time we saw this MACD pattern where it broke above the 26 and over the 0 was October of last year and was proceeded by a MASSIVE bull run. Let's pay close attention to what happens the next week or so and hopefully get our space suits ready.
Rainy Thursday mornings call for Jack Johnson and too much coffee.
Not financial advice - DYOR - Louisville plays Virginia tonight, Cards need a big W here to become a lock for the tournament.
-Delgado-

TRON perspectives on a bull runso previously posted the chart diagram and theory that TRXBTC would be experiencing a bull run in the very immediate future - give or take 2 weeks as outlined using the green markings
however, when re-evaluating the chart and pattern formation we see unfolding before us, one needs to look at how long we have been in this corrective phase and realize that not enough time has elapsed, perhaps.
although all targets remain the same, i still see this going back to all time highs this year and before the summer arrives, but i just think that this return to these lows will have to stick around for some more time. a lot of people lost at the top to make the profits seen from those who had been in on TRXBTC back at the double digit satoshi range for tron.
this longing of the U, idk what the technical term is - but this rounding of the bottom (maybe?) could be much wider than what was indicated before.
so expect something more like the light blue outline to pan out as a primary timeline and use the green one (originally posted) as a best case scenario.

Strategy Shift, Long SNAP in 2018; Stable IPO $20-24 RangeSnapchat is an Advertising Platform that leverages camera hardware using AR and Geo Location in order to create small, bite sized entertainment experiences that become cyclical and habitual for users. That they called themselves a camera company in 2017 was ludicrous and out of line. The new design leans heavily towards this model and focuses more on AR (which they should given that the iPhone X is starting to propagate a paradigm shift in personal connectivity to hardware and environment) to maximize the camera hardware via software.
They have a really great auction system in place and there's a shift internally with empowering the community (finally) that will eventually start to bear fruit if they give these new initiatives proper love and attention. It's a huge pivot, but one that I think they're starting to understand. Being able to let community and companies directly control exposure in order to generate revenue is a total win, especially with the format that Snapchat uses. They're letting companies sponsor promoted stories, which I feel trends towards this new operational structure. They just have to continue to execute well and the stock will start to pop it's way back up.
The advertising side of the business is growing exceedingly well and is positioning itself in the best way possible for Snap to leverage it into the future. User base is also increasing, along with the new Lens Studio program, so overall the story for Snapchat is positive (minus all the people fighting the redesign - as usual). I think an accumulation period in April should be watched for before the next earnings call. We're heading into Spring Break, music festival season, baseball and the Spring/Summer momentum shift. Market conditions remaining positive, next EC could be another good trend upwards.

SPRING arrives earlier for XRP this 2018.We have XRP starting to look bullish, let´s see why.
- The double bottom failed piercing the lowest support of the correction at $0.88, this is something that we were expecting since our last analysis (you can find it attached below) and it achieved perfectly, entering the buy zone (the pink box) and rebouncing strongly after touching the lowest support of the buy zone which is a very important consolidation zone of Dec 2017.
- Price is now oscilating between the previous lowest point of the downtrend at $0.88 and the 0.786 Fibo retracement of the big picture since the bullish rally started in Dec 2017, XRP is consolidating there.
- We have a SPRING formation, these means that XRP went out from the trading range (green box) going lower than the previous low of the trend, giving bears the sense that downtrend is still active and may continue its way down, but it quickly rejects the price getting back into the trading range inside the green box. It is like a bear trap when a downtrend is ending and it is usually a good signal that a trend reversal is getting in, by now, price is holding well on the price inside the green box, it is a good signal.
- We finished the downtrend movement inside the buy area (pink one) with a very large and convincing "Hammer Candlestick" which is also a trend reversal sign.
- Also BTC is forming a very beautiful inverted H&S pattern that if broken, as now they are moving with a very high correlation, it will ride XRP to $1.13 which is the next very strong resistance to test and see if XRP can go higher from there.
- $1.13 is also very close to the downtrend line we have since the last important upside from Jan 17 (the white line). If XRP is able to break the $1.13 resistance, it is very likely XRP will go through the trend line also.
