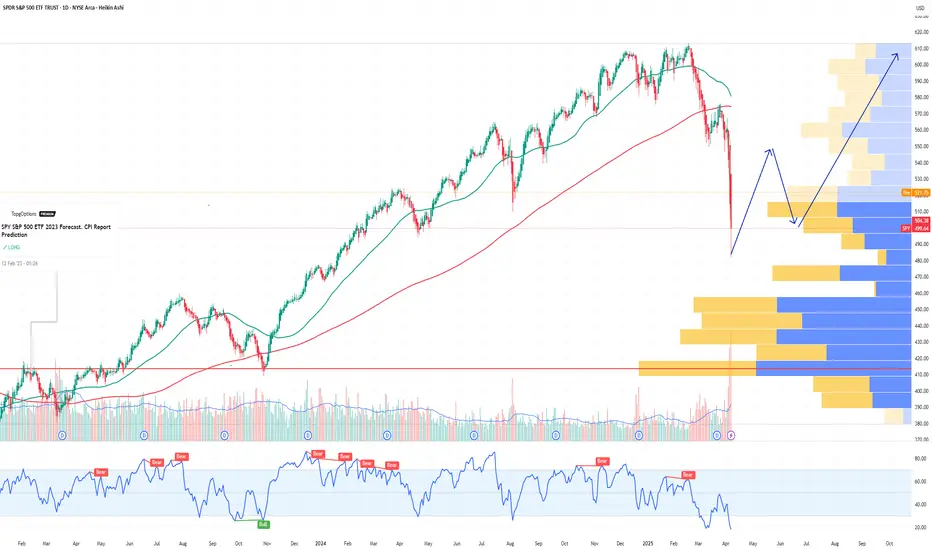
SPY S&P 500 ETF Potential W-Shaped Recovery Forming We may be witnessing the formation of a W-shaped recovery on the SPY (S&P 500 ETF) – a classic double-bottom structure that often signals a strong reversal after a period of correction or volatility. Let’s dive into the technicals and what this could mean in the sessions ahead.
🔍 The Technical Setup:
SPY recently tested key support around the $485-$500 zone, bouncing off that area twice in the past few weeks. This gives us the left leg of the W and the first bottom. After a modest relief rally to ~$520, we saw another pullback – but this second dip failed to break below the first bottom, a hallmark of the W-pattern.
As of today, SPY is starting to reclaim ground toward the $517-$520 resistance zone. If bulls can push through this neckline area, especially with volume confirmation, we could see a breakout that targets the $530-$535 area in the short term.
🔑 Key Levels to Watch:
Support: $490-$500 (double-bottom support zone)
Neckline/Resistance: $530
Breakout Target: $550 (previous highs)
Invalidation: A break below $490 with volume could invalidate the W-recovery idea and shift bias bearish.
📊 Momentum & Volume:
RSI is climbing back above the 50 level – bullish momentum building.
MACD shows a potential crossover forming, hinting at a shift in trend.
Watch for increasing buy volume as SPY approaches the neckline – that’s where the bulls will need to step up.
🧠 Macro & Earnings Angle:
Don’t forget – we’re entering a heavy earnings season and rate cut expectations are still a wildcard. A dovish tone from the Fed and strong corporate results could be the fuel that sends SPY higher to complete this W-shaped recovery.
🧭 Final Thoughts:
This is a high-probability setup if neckline resistance is broken cleanly. Wait for confirmation before going heavy – fakeouts are common in double-bottom scenarios. If we do get the breakout, we may be looking at a broader market rebound going into summer.
🔔 Set alerts near $525. A confirmed breakout could mean the bulls are back in charge.
SPX (S&P 500 Index)
06/30/25 Trade Journal, and ES_F Stock Market analysis
EOD accountability report: +212
Sleep: 7 hours
Overall health: Good, caught up on workout and sleep over the weekend.
** VX Algo System Signals from (9:30am to 2pm) 2/4 success**
— 12:20 PM VXAlgo NQ X1 Sell Signal :x:
— 12:30 PM Market Structure flipped bullish on VX Algo X3!:check:
— 1:55 PM VXAlgo NQ X1 Buy Signal :x:
— 2:00 PM Market Structure flipped bearish on VX Algo X3! :check:
**What’s are some news or takeaway from today?
and What major news or event impacted the market today?
**
The X1 Signals today has been happening after market structure signals and usally that means MM is going to change the direction to the opposite way to scam us. Based on that, I decided to lock out my account after making $200 today so i don't get caught in the scam.
News
EU TO ACCEPT TRUMP’S UNIVERSAL TARIFF BUT SEEKS KEY EXEMPTIONS — 2:07 PM
What are the critical support levels to watch?
--> Above 6240= Bullish, Under 6210= Bearish
Video Recaps -->https://www.tradingview.com/u/WallSt007/#published-charts

Stocks Are Crushing It at Record Highs. What’s Behind the Rally?Happy record highs, everyone — confetti, champagne, and yet another all-time high. The Nasdaq NASDAQ:IXIC and the S&P 500 SP:SPX just did it again — notched fresh closing records that have traders flexing their P&Ls like it’s 1999.
If you’ve been on the sidelines, you’re probably staring at the chart asking: How did we add trillions to market cap while my grocery bill still looks like a high-yield bond payment?
Good question. Because these days, stocks are behaving like they live on a separate planet from the actual economy (looking at you, Nvidia NASDAQ:NVDA ).
Let’s pop the hood and see what’s revving this record-breaking machine — and what potholes might lurk ahead.
🤫 Nasdaq: The Comeback Kid of 2025
Take the Nasdaq Composite NASDAQ:IXIC — your favorite tech playground — up a mind-boggling 32% since the April lows . One-third of its total value was minted in three months — as much as $7 trillion added in.
What happened? Well, start with the obvious: the Magnificent Seven are doing the heavy lifting again. Nvidia NASDAQ:NVDA , Microsoft NASDAQ:MSFT , Apple NASDAQ:AAPL , Amazon NASDAQ:AMZN , Alphabet NASDAQ:GOOGL , Meta NASDAQ:META , Tesla NASDAQ:TSLA — they’re the gym rats of this rally.
But here’s the kicker: while the headlines are all “index record highs,” the Mag 7 as a whole are actually down slightly for the year. The hero’s cape belongs mostly to a few standouts: Meta, up 21% this year. Microsoft, up 17%. And Nvidia? Not bad: up a whopping 65% since the April swoon.
When the generals lead, the army follows — at least until they don’t?
🤖 S&P 500: Powered by 7, Dragged by 493
The broad-based S&P 500 also clocked a new record close at 6,173.07 . Everyone loves to toast a new all-time high, but here’s your buzzkill: the “500” in S&P 500 is a bit of a myth these days.
The Magnificent Seven alone account for more than 30% of the index’s total weight. Last year, this elite club rose 57% while the other 493 stocks crawled up just 13%. Strip out the hyper-scalers, and you’ll find most stocks are still limping along, wrestling with tepid growth and stubborn inflation.
So yes — the S&P 500 is soaring. But the S&P 493? Not partying at the same rooftop bar.
💼 Conflicting Data: This Economy Ain’t It (Yet)
Here’s where it gets spicy: GDP actually shrank last quarter — down 0.5% year over year. Inflation is still running hot with May’s PCE figure at 2.7% (the Fed’s target is 2%).
Fed boss Jay Powell and the central bank squad are trying to thread the world’s tiniest policy needle: cut rates enough to juice the economy, but not so much that they stoke a fresh inflation flare-up.
Meanwhile, job numbers are a mixed bag , and corporate revenue hasn’t been setting new records to match those ceiling-high stock valuations.
In short, the disconnect between equity prices and economic reality is growing wider than the spread on your favorite meme coin during an illiquid Sunday afternoon.
👨🏻💻 Tariffs, Tweets, and the Trump Factor
And who could forget the wildcard factor? Trump’s new tariffs. The “reciprocal tariffs,” as he likes to pitch them. One day he’s threatening to slap 50% duties on everything from French wine to German cars. The next, he’s cozying up for “productive” chats with Brussels.
This policy whiplash makes supply chains sweat, but so far, equity traders are shrugging it off — and even cheering. Why? Because in Trump’s world, chaos means central banks might cut rates to cushion the blow. And nothing says “rocket fuel” for risk assets like lower borrowing costs.
Add to that the weird paradox that tariffs — while inflationary in the short run — can also weaken the dollar if the Fed turns dovish. A weaker greenback means US tech giants look cheaper to global investors. So… up we go.
🏛️ The Great Fed Cut Watch
Speaking of cuts: the Fed’s next meeting is in late July, and Wall Street is holding its breath. Rate cuts mean cheaper money — which often means traders load up on risk.
The market is currently pricing in a 90% chance of a cut in September (and an 80% chance of a hold in July). Meanwhile, gold OANDA:XAUUSD — the non-yielding safe haven — is selling off while traders are flocking toward the risk-end of the boat, leaving the safe-haven corner gathering dust.
👀 What’s Next? The Inevitable Hand-Wringing
So — should you pop champagne? Depends.
If you’re a trend follower, record highs are record highs. Momentum is your friend. But if you’re a value purist, these multiples probably make your eye twitch.
Big question: when does this all get too frothy? Will the next earnings season justify these valuations? Markets are forward-looking anyway — even if big tech’s revenue flops, that doesn’t mean money will flow out of the market cap.
After all, we’re halfway through the year and that means it’s time to pop open the Earnings calendar for those spring reports.
Any dip right now may very well be seen as an opportunity to swoop in at a lower price, not as something that indicates there’s something fundamentally wrong with the business.
🫶🏻 The Takeaway: Celebrate, but Stay Focused
The rally is real. The headlines are dazzling. But the same lessons apply: trends don’t last forever, risk doesn’t disappear just because the chart is green, and the Magnificent Seven won’t carry the world on their backs indefinitely.
So have your stop losses placed right, your position sizes sensible , and your eyes on the macro backdrop. Because record highs are fun, but holding the bag isn’t.
Off to you : Are you riding this rocket or waiting for the next dip? Drop your take below — are we so back, or about to crack?

SPX500 Extends Rally on Fed Hopes and China Trade DealS&P 500 Set to Extend Record Highs
U.S. stock futures climbed on Friday, continuing this week’s strong momentum on hopes of eased trade tensions and growing confidence in multiple Fed rate cuts later this year.
Futures tied to the S&P 500 and Nasdaq 100 pointed to fresh record-high openings, while the Dow Jones was set to rise by 150 points.
Adding to the bullish tone, Commerce Secretary Lutnick announced a trade agreement with China, reducing tariff risks and easing concerns over rare earth shortages.
TECHNICAL OUTLOOK – SPX500
The index has broken into new all-time highs (ATH) and stabilized above the 6,143 resistance level, confirming bullish strength.
As long as the price trades above 6,143, the uptrend is likely to continue toward 6,225, with potential short-term pullbacks to 6,143.
A 1H candle close below 6,143 could trigger a deeper correction toward the pivot zone at 6,098.
Key Levels
Resistance: 6,175 → 6,225
Support: 6,098 → 6,041
previous idea:

SPX: new ATH, despite allEconomy, geopolitics, trade tariffs, inflation, Fed moves. It seems that the market got tired of all news during the previous period, and decided to take the optimistic side, despite all. The S&P 500 reached a fresh, new all-time highest level on Friday's trading session, at 6.185. With the latest move, the S&P 500 managed to erase all losses from April this year, when the index tumbled around 20% after the implementation of trade tariffs.
The weekly trade tariffs news brought a termination of talks between the U.S. and Canada. However, what moved the market the most was the news that the US Administration settled a deal on trade tariffs with China. Although details of the deal were not publicly disclosed, still the market reacted very optimistic about it.
At the same time, the latest macro figures for the US are showing that the tariffs are slowly starting to reflect in the U.S. economy. The Fed's favorite inflation gauge, the PCE index increased by 0,1% in May, which was expected. However, the Personal Income and Personal Spending in May missed heavily market estimates. The Personal Income dropped by -0,4% for the month, while Personal Spending dropped by -0,1%. Analysts are pointing that these figures are showing that the US consumers are spending less due to increased prices of goods, after implementation of tariffs. At the same time, there was a slowdown in the U.S. GDP growth rate, final for Q1 was negative for the quarter, at the level of -0,5%.
Tech companies continued to be in the focus of investors' interest. APPL closed the week at $210,08, with a modest weekly gain of 0,24%. MSFT gained 3,87% for the week, closing it at $495,94. Market favourite NVDA surged by 9,74% within a week, closing at $157,75. AMZN also had a good week with a surge of 6,33%. Despite higher volatility, TSLA ended the week at 0,33% higher, underperforming other tech companies included in the index.

SP500 - Cycle Analysis; New V-Bottom24 Dec 2018 - V-Bottom Trough:
This marks a clean V-bottom. Both the 227-ROC and 114-ROC showed simultaneous positive acceleration after price reacing its low. Shortly after, both crossed their 57-SMA almost in sync — increasing the probability of a sustained bullish move. Price confirmed this by breaking resistance and forming a V pattern. This was further validated by the centered moving average crossover (114-CMA crossing above 227-CMA).
25 Mar 2020 - Deep COVID Crash Trough:
During this phase the priced broke below the support, creating a deep trough. Altough both ROC lines initially showed strong negative acceleration due to the COVID-19 crash, they soon reversed above their 57-SMAs, signaling a major shift in momentum. This coincided with the price breaking above the key resistance which was also crossed in 2019 when confirming the old V-pattern. After this breakout, a brief pullback followed before the uptrend resumed with increasing strength.
22 Jun 2021 to 19 Dec 2023 - Pattern
During the initial period a bearish divergence was visible in the ROC, nevertheless price and rate of change both declined making a low in early October 2022. A technical pattern began to form, which appears to align more closely with a symmetrical triangle; So when measuring its height and projecting it from the breakout point aligns with the new all-time highs that were reached on 27 June 2025.
21 Mar 2025 - New Cycle Trough
A new V-bottom formed shortly after the current cycle began. Both ROC indicators had already crossed their SMAs to the upside, showing early signs of positive acceleration, days before of price broke through the resistance and reached the new record high.
The 227-SMA is likely to cross from below the fast SMA while a possibility of a pullback increase.
Following that, the 114-CMA will probably has the chance to cross back the 227-CMA, with the price potentially confirming a new support level and resuming its uptrend - in line with the broader cycle timeline.

SPX - Space X?SPX means SpaceX? LOL NOO, but this coin has traits of the rockets. to move up, as stated

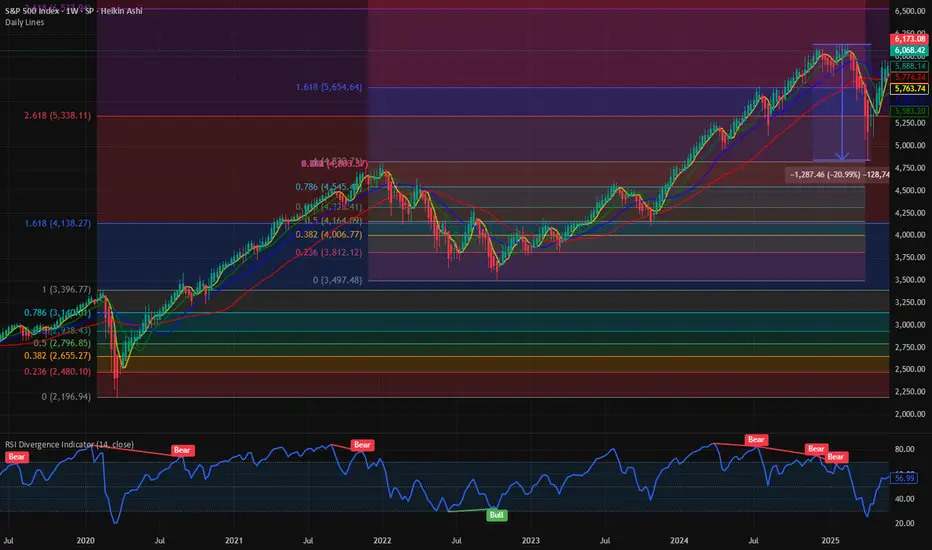
$SPX Path of least resistance is higher. Next Stop : 6500 This week we officially recovered all the losses from the liberation day low. We had a 20% bear market crash and since then there has been a V shaped rally in the major averages. NASDAQ:QQQ and SP:SPX have fully recovered the losses and then some. It is 0% form its ATH. We have been closely following the chart of SP:SPX for the last few weeks and have marked various Fib Retracement levels and Fib Extenstion. IN my opinion the Covid lows were one of the majot drawdown moments.
If we plot the Fib Extension on the COVID highs and lows, we can clearly see the Support and Resistance zones. As per the Fib Levels the next consequential level in SP:SPX will be 6550, which is the 3.618 Fib level. That I would suggest as the path to least resistance. First, we go higher before we can see any major correction. In case of a Major correction, we get support @ 5300.
Verdict : SP:SPX goes higher first before correction. 6550 is the next stop.
S&P500 Potential UpsidesHey Traders, in today's trading session we are monitoring US500 for a buying opportunity around 6,075 zone, S&P500 is trading in an uptrend and currently is in a correction phase in which it is approaching the trend at 6,075 support and resistance area.
Trade safe, Joe.

BRIEFING Week #26 : Are we going for a Bubble ?Here's your weekly update ! Brought to you each weekend with years of track-record history..
Don't forget to hit the like/follow button if you feel like this post deserves it ;)
That's the best way to support me and help pushing this content to other users.
Kindly,
Phil

06/27/25 Trade Journal, and ES_F Stock Market analysis 06/27/25 Trade Journal, and ES_F Stock Market analysis
EOD accountability report: +915
Sleep: 6 hours
Overall health: edgy from sleep
** VX Algo System Signals from (9:30am to 2pm) 3/4 success**
9:37 AM VXAlgo ES X1 Buy signal :check:
9:55 AM Market Structure flipped bullish on VX Algo X3! :check:
10:31 AM VXAlgo ES X1 Sell Signal (double sell) iffy
1:43 PM Market Structure flipped bearish on VX Algo X3! :check:
**What’s are some news or takeaway from today?
and What major news or event impacted the market today?
**
Early on in the market, I noticed that there was heavy manipulate by the MM with violent buy and sell. This somewhat warns that today's market could be tough to trade and you have to be very patient.
News
PRES TRUMP: ENDING ALL TRADE TALKS WITH CANADA; WILL TELL CANADA ITS TARIFF LEVEL IN COMING DAYS - around 1 :40pm est
What are the critical support levels to watch?
--> Above 6200= Bullish, Under 6185= Bearish
Video Recaps -->https://www.tradingview.com/u/WallSt007/#published-charts

Beating the S&P 500 with TradingView's Stock ScreenerThis is Mo from MWRIGHT TRADING. The date is Friday, June 27th, 2025.
This video is about selecting stocks that collectively have the potential to consistently beat the S&P 500
I look for smooth and consistent long-, mid-, and short-term performance. For that we need
Building a Screener
What I look for
- Liquidity - that means money, or trading volume.
- Room to move - no overhead resistance
- Favorable trends - stable moving averages
- Good short term signals - a good intraday chart
Filters
- Market Cap 300M to 2B
Not too big, and not too small
- Perf 10Y > Perf 5Y
No long term dips in performance
- Perf 5Y > Perf 1Y
No short term dips in performance
- SMA(300) < Price
Price above moving average
- SMA(200) < Price
Price above moving average
- Avg Volume 10D > 100K
No lightly traded stocks. Liquidity needed
- + SMA(200) >= SMA(300)
Stacked long-term SMAs
- + SMA(50 >= SMA(200)
Stacked short-term SMAs
- + ROE, Trailing 12 Months > 0% (Chris Mayer)
Improving ROE
Examples
- SENEA
- DGII
Review the charts
- Verify short term performance
- Multi-VWAP (1 hr Chart) - Free Indicator
- Above a rising 5-Day AVWAP
- Magic Order Blocks (5 min Chart) - Free Indicator
- No major overhead resistance
- Verify fundamentals and long term performance
- ROE (Quarterly) - TV Indicator
- Rising ROE
- Float Shares Outstanding - TV Indicator
- Lower float means lower supply. When high demand occurs, this can act as a price catalyst.
- Multi VWAP from Gaps - Free Indicator
- Stacked is good
- 3 SMA Ladies - Custom Indicator
- Stacked is good

06/26/25 Trade Journal, and ES_F Stock Market analysis 06/26/25 Trade Journal, and ES_F Stock Market analysis
EOD accountability report: +731.25
Sleep: 5 hours
Overall health: meh
** VX Algo System Signals from (9:30am to 2pm) 3/3 success**
— 9:38 AM Market Structure flipped bullish on VX Algo X3
— 10:30 AM Market Structure flipped bullish on VX Algo X3!
— 11:27 AM VXAlgo ES X1 Sell Signal
What’s are some news or takeaway from today?
and What major news or event impacted the market today?
today was another interesting day, i am noticing that when market structure changes 2x in the same direction, it is usally pretty effective and scammy at the same time
News
*NVIDIA NASDAQ:NVDA SHARES HIT A NEW HIGH TO RECLAIM WORLD'S LARGEST STOCK TITLE - market is being carried by the momentum of mag 7
What are the critical support levels to watch?
--> Above 6175 = Bullish, Under 6155= Bearish
Video Recaps -->https://www.tradingview.com/u/WallSt007/#published-charts


SPX is overheated, a correction is necessary📉 Market Update: No, It Has Nothing to Do with Trump
This move has nothing to do with Trump’s dramatic announcements. The reality is simple: the MACD on the daily chart is overheated, and a healthy correction is needed — likely down to the 5,520 level — before resuming the uptrend.
Now, does it surprise anyone that Trump acts like a PR agent for his investors? He always seems to drop “bad news” at the exact moment the charts call for a pullback. My guess? They're shorting right now.
🪙 Bitcoin Stalling
CRYPTOCAP:BTC is also losing momentum, and looks like it’s in need of a short-term correction as well. This suggests a week of consolidation ahead for the whole crypto market.
But let’s be clear:
🚀 The Bull Market Is Not Over
The weekly charts remain very bullish, and this trend could last another 4–6 months. The macro bullish structure for crypto remains intact.
However, in TradFi, there are cracks:
🔻 20-year bonds sold at 5.1% — a major recession red flag
💸 Tariffs are putting pressure on global trade
📉 The entire traditional market is starting to de-risk
🔮 What to Expect
Short-term correction to ~5,518 (first bottom target)
A possible rebound after healthy consolidation
A continued uptrend in crypto unless key support breaks
I’ll publish a new update when conditions change.
📌 Follow me to stay ahead of the market. And as always: DYOR.
#CryptoMarket #Bitcoin #MACD #TechnicalAnalysis #CryptoCorrection #BullishTrend #RecessionWarning #TradFi #Altcoins #BTC #MarketUpdate #TrumpEffect #DYOR

Nasdaq All-Time Highs, S&P Close, Blast Off or Breakdown?What an incredible melt-up since April 7 lows in the US markets.
Trump vs Musk - ignored
Iran vs Israel - ignored
High Valuations - ignored
FED Pausing - ignored
The US economy is resilient and it's a good thing because the world is performing really well (EX-US). Europe/China/India/Emerging Markets are outperforming the US by 15-16% YTD
The USD is having one its worst years ever in 2025
Gold, Silver, Bitcoin are great diversifiers in my opinion for 2025
Oil prices are incredibly volatile and energy stocks and commodities in turn are showing
volatility and big swings
As we near end of month and end of Q2, I have to believe the market is due for a small pause or pullback sooner rather than later - but we'll see
Thanks for watching!!!

S&P500 1D Golden Cross, middle of 3y Channel, much upside to go!The S&P500 index (SPX) has been trading within a Channel Up since the final sell-off of the 2022 Inflation Crisis. The only time this pattern broke was for 4 days during the bottom formation (April 2025) of the recent Trade War.
Ahead of the first 1D Golden Cross since January 26 2023, the market looks more bullish than ever as it is trading within the 0.5 - 0.618 Fibonacci range of this Channel Up, suggesting that there is considerable upside before it tops.
The last Bullish Leg that started on the Channel Up bottom and peaked before a 1D MA50 (blue trend-line) test grew by +28.30%. Expecting a repeat of that, we may see the price targeting the 0.786 Fibonacci level at 6550 before the next 1D MA50 pull-back.
-------------------------------------------------------------------------------
** Please LIKE 👍, FOLLOW ✅, SHARE 🙌 and COMMENT ✍ if you enjoy this idea! Also share your ideas and charts in the comments section below! This is best way to keep it relevant, support us, keep the content here free and allow the idea to reach as many people as possible. **
-------------------------------------------------------------------------------
Disclosure: I am part of Trade Nation's Influencer program and receive a monthly fee for using their TradingView charts in my analysis.
💸💸💸💸💸💸
👇 👇 👇 👇 👇 👇

SPX500 Short There are multiple patterns on M15 and H1
All timeframes up to H4 are overbought
There are multiple double tops with divergence
This is at the all-time high, suggesting there will be a lot of resistance
Markets look like they are due for a drop after such a sharp move up\
Stop loss above 6130

SPX Rug📊 Chart Analysis: ES1! (S&P 500 E-mini Futures, 1H) – Impending Breakdown via iFVG and Rising Wedge Top
This chart represents a technical analysis setup for ES1! (S&P 500 E-mini Futures) on the 1-hour timeframe. Here’s a contextual breakdown pointing toward a potential “rug pull” scenario by the end of the week, driven by an internal Fair Value Gap (iFVG) rejection and wedge resistance structure:
⸻
🔺 Structure Overview: Rising Wedge and Distribution Top
• The price action is following a rising wedge, which is typically a bearish reversal pattern, especially when occurring after a strong impulse move.
• The wedge’s upper trendline has just been tagged or slightly breached, with price showing early signs of rejection (small-bodied candles, wicks).
• A parabolic curve is drawn projecting a rounded top, suggesting buyers may be exhausting into resistance.
⸻
🧩 Internal Fair Value Gap (iFVG) in Focus
• The shaded gray area below current price action marks an iFVG (Internal Fair Value Gap) – a low-volume inefficiency formed during the recent bullish rally.
• iFVGs often act as magnetic zones, pulling price back to “rebalance” before continuation or reversal.
• Price has not yet filled this inefficiency completely, indicating a likely retracement target.
⸻
📉 Projected Breakdown Path
The curve implies a rounded top formation, with the following potential sequence:
1. Minor liquidity grab just above the wedge resistance.
2. Failure to hold above resistance confirms a deviation and traps late longs.
3. Sharp drop into the iFVG zone (gray block).
4. If iFVG support fails, acceleration toward the lower wedge trendline could follow — a true rug pull scenario.
⸻
🔻 Bearish Confluence Factors
• Volume divergence or lack of sustained momentum at highs (not visible here, but implied).
• The steepness of the rally suggests FOMO-driven buying, often vulnerable to reversal.
• The price has extended significantly from the last consolidation base, creating air pockets below.
• Candle structure shows upper wicks and rejection tails, signaling supply.
⸻
🗓️ Timing Bias – Into Week’s End
• Given the tightness of the wedge and proximity to iFVG + overhead resistance, any retracement could be swift and violent, particularly if driven by macro catalyst or profit-taking.
• Expectation would be a breakdown into Thursday or Friday, aligning with common volatility windows (e.g., weekly options expiry).
⸻
🔚 Summary
• Bias: Bearish (short-term)
• Trigger: Rejection of wedge high / deviation above resistance
• Targets:
• Primary: Fill of iFVG (gray zone)
• Secondary: Breakdown to lower wedge support
• Invalidation: Sustained acceptance above wedge trendline with bullish continuation

06/24/25 Trade Journal, and ES_F Stock Market analysis EOD accountability report: -717.50
Sleep: 4.5 hours - heat waves in nyc
Overall health: meh
** VX Algo System Signals from (9:30am to 2pm)** 4/4
9:40 AM Market Structure flipped bullish on VX Algo X3! 5 pts
9:42 AM VXAlgo NQ X3 Buy Signal (failed)
11:00 AM Market Structure flipped bullish on VX Algo X3! 20pt
11:58 AM VXAlgo NQ X1 Sell Signal (failed)
What’s one key lesson or takeaway from today?
and What major news or event impacted the market today?
There are days that the algo will lose but you just gotta trust the process and execute accordingly with a stoploss.
What are the critical support levels to watch?
--> Above 6130 = Bullish, Under 6125= Bearish
Video Recaps -->https://www.tradingview.com/u/WallSt007/#published-charts

S&P500: Channel Up targeting 6,170.S&P500 is bullish on its 1D technical outlook (RSI = 65.737, MACD = 75.400, ADX = 16.727), unfolding the new bullish wave of the 1 month Channel Up, after a bottom near the 4H MA200. The first bullish wave one reached +4.35%, we expect to repeat that so for a few more candles we will remain bullish, TP = 6,170.
## If you like our free content follow our profile to get more daily ideas. ##
## Comments and likes are greatly appreciated. ##

SPX - Space X?I dont know whats the full form, but its just flowing and when it flows - we say LET IT FLOWW!

06/23/25 Trade Journal, and ES_F Stock Market analysis EOD accountability report: +1128.75
Sleep: 7.5 hours
Overall health: good
VX Algo System Signals from (9:30am to 2pm) 4/4
10:40 AM VXAlgo NQ X1 Sell Signal (double signal):check: 10 pt move
12:00 PM Market Structure flipped bearish on VX Algo X3! :check: 35 pt move
12:43 PM VXAlgo ES X1 Buy signal (triple signal) :check: 20 pt move
1:34 PM Market Structure flipped bullish on VX Algo X3! :check: 23 pt move
What’s one key lesson or takeaway from today?
and What major news or event impacted the market today?
Oil is trading as if the Israel/US-Iran war is over and market can be irrational lol
What are the critical support levels to watch?
--> Above 6060 = Bullish, Under 6050= Bearish
Video Recaps -->https://www.tradingview.com/u/WallSt007/#published-charts
