SPY Swing Trade Plan – 2025-06-06📈 SPY Swing Trade Plan – 2025-06-06
Bias: Moderately Bullish
Timeframe: 3–4 weeks
Catalysts: Strong institutional flows, trade talk optimism, solid jobs report
Trade Type: Long equity position
🧠 Model Summary Table
Model Bias Entry Stop Loss Take Profit Holding Period Confidence
DS Moderately Bullish $600.02 $595.54 $618.02 3 weeks 65%
LM Moderately Bullish $598.50 $586.70 $616–618 3–4 weeks 75%
GK Strongly Bullish $600.02 $592.00 $610.00 4 weeks 72%
GM Moderately Bullish ~$600.50 $587.50 $627.50 3–4 weeks 70%
CD Moderately Bullish $600–600.50 $585.00 $620 / $635 3–4 weeks 72%
✅ Consensus: SPY is in a bullish trend across timeframes
⚠️ Disagreements: MACD momentum and entry/pullback levels
🔍 Technical & Sentiment Summary
Trend: SPY above 10/50/200 EMAs on all models
RSI: 60–61 → bullish but not overbought
MACD: Mostly positive, DS cautious on daily histogram
Support Levels: $591.06, $595.54, $597.26
Resistance Zones: $600.83, $605.21, $610
VIX: 17.6 (declining), supports risk-on sentiment
News: Trade talk optimism and strong jobs data fueling momentum
✅ Final Trade Setup
Parameter Value
Instrument SPY
Strategy LONG
Entry Price $600.00
Stop Loss $588.00
Take Profit $625.00
Position Size 83 shares (1% risk on $100K)
Entry Timing At market open
Confidence 70%
💡 Rationale: Aligned bullish signals across timeframes, falling VIX, and strong macro sentiment favor a trend continuation move toward $625. Position sized for conservative risk management.
⚠️ Key Risks & Considerations
MACD divergence could signal near-term stall
Resistance zone at $605 may act as a cap
Macro volatility: Strong jobs could raise rate expectations
VIX Watch: A spike above 20 could reverse market trend
Exit Protocol: Consider closing if SPY closes below the 10-day EMA (~$591)
📊 TRADE DETAILS SNAPSHOT
🎯 Instrument: SPY
📈 Direction: LONG
💰 Entry Price: 600.0
🛑 Stop Loss: 588.0
🎯 Take Profit: 625.0
📊 Size: 83 shares
💪 Confidence: 70%
⏰ Entry Timing: Open
SPX (S&P 500 Index)
RobinHood - Urgent News - Afterhours SelloffOn June 6, 2025, S&P Dow Jones Indices announced no changes to the S&P 500 index in its quarterly rebalance, marking the first such instance since March 2022. This decision notably excluded Robinhood Markets Inc., despite speculation that it might be included due to its market capitalization exceeding $20.5 billion and recent strong performance. Following the announcement, Robinhood's stock declined over 5% in after-hours trading
The next S&P500 quarterly rebalancing is set for September 2025....perhaps the next leg higher needs to wait until them
As of June 6, market close, Robinhood's stock is trading at $74.88, with a market capitalization of approximately $36.85 billion. The company has experienced significant growth, with a 365% increase in stock price over the past 12 months and a 50% surge to start 2025. Analysts project continued revenue and earnings growth, with an average one-year price target of $51.19 per share
We issued put option alerts to our members and shorted this live stream on Friday afternoon.

SPX: chasing the 6KThe jobs data were in the spotlight of markets during the previous week. The Non-farm payrolls in May with 139K new jobs came as better than market anticipated, which supported the optimistic mood of investors. The S&P 500 managed to return to the levels modestly above the 6K level. Tech companies were again in the spotlight of investors. In this sense, the magnificent 7 drove the market to the higher grounds. In the Friday trading session, NVDA gained 1,2%, AMZN was up by 2,7%, while Tesla gained 3,7%. It should be noted that Tesla had quite a turbulent week. Its shares first dropped by 14% at the beginning of the week, after its CEO commented negatively on a current policy of the US President Trump. Certainly, this came as a surprise for markets, considering Musk's strong support for President Trump, both during the electoral campaign and his presidency.
Current optimism might be slowed down with forthcoming inflation data. Namely, a large number of economists are pointing to potential for the economic slowdown and higher inflation induced by implemented trade tariffs by the US Administration. In this sense, there is a probability that higher volatility of the index might continue in the coming period, as markets will try to understand what impact future growth and earnings will have on any new news on trade tariffs. It has been announced that further talks between China and US officials on trade tariffs will be held next week in London. This event will be closely monitored by investors.

$SPY bearish, to break April lows?Most people are thinking that we'll see a correction that goes back to the $560 area and then from there, we'll go to new highs. They also don't think it's likely that we'll retest the lows from April and think it's nearly impossible that we'll break the lows.
However, my base case is that we will break the lows. Yes, in the past, most dips like the one in April were good buying opportunities, but the chart looks different here.
You can see that ever since April, all we've done is consolidate up into a rising wedge.
We look set to break down from that in the coming days. If we do break down and are unable to reclaim the highs, then I think my base case will become the highest probability outcome.
I think it's likely that the move down will take us to the $424- 402 levels. Let's see what happens.

All-Time Highs (3% Up) or US/China Trade Gap (4-5% Down)?It's summer time (1st week of June)
Brutally slow price action thus far, Non-Farm Payroll hits this Friday
Next week will be more US Inflation Date (CPI, PPI)
S&P and Nasdaq are only 3% (or slightly less) away from all-time highs
Melt-up momentum says it's the path of least resistance
US/China Trade Agreement Gap (that silly little Monday announcement) is 4-5% lower
Whatever we hit, there will be disappointed traders and investors - the ultimate pain trade :)
I'm not bearish, I'm ridiculously cautious as a bull and wanting to see a pullback. I can tell
because it's actually annoying watching the market grind so slow to the upside shrugging
off every bad news bite and sense of reality
The big beautiful tax bill is losing support (see Elon Musk's latest comments)
The Trump Administration has pivoted so hard the other way the market is virtually
ignoring tariff news now
Let price be your guide. I'm connecting the April 7 lows forward and if the bears cross it and price sweeps some lows, there might be some pullback potential in the cards
Plenty to watch - be patient - opportunities await. Not forcing anything for now and I'm
doing the "boring" stuff for income trading.
Thanks for watching!!!

SPX Technical Analysis – Bullish StructureSPX Technical Analysis – Bullish Structure
The overall trend of SPX appears bullish, and based on the current structure, the asset shows potential for a 20% upside, with a possible move toward the $1.25 level.
Key support zones to watch are:
$0.90, which is approximately 11% below the current price
$0.80, which is around 21% below and can be considered the main support
As long as the price holds above these key levels and the bullish trend remains intact, the outlook stays optimistic for further upward continuation.
📌 This analysis is for educational and informational purposes only and does not constitute financial advice.
📝 Follow for more updates on SPX and other assets

S&P500: Gearing up for a push to 6,100S&P500 is bullish on its 1D technical outlook (RSI = 64.611, MACD = 85.830, ADX = 19.630) as it has been trading inside a Channel Up for over a month. Right now it is halfway through the new bullish wave. We expect it to rise by at least +4.40%, same as the previous one. Stay bullish as long as the 4H MA50 holds, TP = 6,100.
## If you like our free content follow our profile to get more daily ideas. ##
## Comments and likes are greatly appreciated. ##

Something Brewing on SPXCup and handle brewing on the SPX daily. All time highs are near. See you there before the pullback

SPY Major Confluence ZoneSPY has a major upside confluence zone around 625
Looking for a test of this area in the coming weeks.
The level is about 5% away.
Let the melt up begin.

SPY New All Time Highs IncomingThe #SPY weekly chart is so bullish but don't take my word for it.
Simply look at the weekly bullish crossover that occurred between the 7 week & the 20 Week MA.
The last time this occurred was in Nov 2023 and the markets ripped 19% before having a major 3 week pullback and then another soaring continuation higher.

Bullish Intraday Patterns Everywhere!SPX had a wonderful intraday hourly chart confirmed breakout. This pattern is bullish and likely will continue higher.
The bulls tomorrow would love to confirm the daily chart breakout and will try to push for that.
SPY/SPX is holding more relative strength than the Q's & IWM which is displaying broad participation.
There are many bullish charts showing accumulation, golden crosses and bullish MA crossovers.
The DXY appears to be wanting to break down to around $97.00 which should yield more upside.
We secured profits today on SPY 594 calls & NVDA 144 calls.
We still remain net long and see the S&P 500 over $6000
Apple, XYZ, AI - are bullish setups were continuing to manage.

Bulls and Bears zone for 06-03-2025SPX has been trading in a range since mid May. Perhaps a pullback might be in the cards.
Level to watch: 5946 --- 5948
News to Watch:
US Factory Orders 10:00am
US JOLTS 10:00am

S&P500 Giant Inverse Head and Shoulders waiting for its breakoutThe S&P500 index (SPX) appears to be forming the Right Shoulder of a long-term Inverse Head and Shoulders (IH&S), the pattern that made the April 07 bottom of the Tariff War correction.
Currently supported by both its 1D MA50 (blue trend-line) and 1D MA200 (orange trend-line), once the overhead Resistance/ neckline breaks, we expect a +24.55% rise to the 2.0 Fibonacci extension, the equivalent of the rise it made from the April bottom up until now.
The target given is 7400.
-------------------------------------------------------------------------------
** Please LIKE 👍, FOLLOW ✅, SHARE 🙌 and COMMENT ✍ if you enjoy this idea! Also share your ideas and charts in the comments section below! This is best way to keep it relevant, support us, keep the content here free and allow the idea to reach as many people as possible. **
-------------------------------------------------------------------------------
Disclosure: I am part of Trade Nation's Influencer program and receive a monthly fee for using their TradingView charts in my analysis.
💸💸💸💸💸💸
👇 👇 👇 👇 👇 👇

06/02/25 Trade Journal, and Where is the Stock Market going tomo**EOD accountability report: +1176**
Sleep: 6 hours , Overall health: Health is getting better as I am getting a bit more rest, but can't seem to push past 6 hours of sleep. Might attempt to sleep earlier as i am usually heading to be around 1-2 am and waking up around 9. Also learned that I have pretty high cholesterol last week, so I plan to start implementing fiber pills into my night stack as it is essential to flooding out cholesterol.
**Should I release my daily supplement stack?**
What was my initial plan?
Bullish going into the market as we went over $5900, and looking for BTD at MOB, Flipped Bearish as we lost MOB.
**Daily Trade recap based on VX Algo System**
— 10:00 AM VXAlgo ES X3 Sell Signal
— 10:30 AM Market Structure flipped bearish on VX Algo X3!
— 11:26 AM VXAlgo YM X1 Sell Signal
— 2:00 PM VXAlgo NQ X3 Sell Signal
Next day plan--> Above 5900 = Bullish, Under 5880 = Bearish
Video Recaps -->https://www.tradingview.com/u/WallSt007/#published-charts

SPY (S&P500 ETF) - Price Testing Resistance Trendline - DailySPY (S&P500 ETF) price is currently testing a resistance trendline above ($593 to $595 price levels).
SPY price in the medium-term has been uptrending since April and May 2025.
SPY price in the short-term has been consolidating sideways, and a large volume breakout or breakdown has not occurred yet.
The 12EMA (blue line) has been holding as support for 5 trading days. Resistance targets to the upside would be $598 to $600.
The grey gap and the 26EMA (purple line) are downside support targets if a rally does not occur this month ($576 to $567).
Breaking news and tariff trade deals are supposed to occur in June and July 2025.

Nightly $SPY / $SPX Scenarios for June 3, 2025 🔮 Nightly AMEX:SPY / SP:SPX Scenarios for June 3, 2025 🔮
🌍 Market-Moving News 🌍
🏭 U.S. Manufacturing Slump Persists
U.S. manufacturing contracted for the third consecutive month in May, with new orders, backlogs, production, and employment all declining. Trade-war disruptions and elevated input costs continue to squeeze factory margins, setting the stage for today’s ISM Manufacturing PMI release
🌐 Global Trade Tensions Weigh on Stocks
Renewed U.S.–China tariff threats sent the S&P 500 lower overnight, as investors fear higher costs for exporters and slower global growth. Futures pointed to another rough open for $SPY/ SP:SPX
📈 China Caixin PMI Exceeds Expectations
China’s May Caixin Manufacturing PMI unexpectedly rose to 50.8, signaling stabilization in export-oriented factories despite ongoing trade uncertainty. That positive surprise may offer some support to Asian equities today
📊 Key Data Releases 📊
📅 Tuesday, June 3:
8:30 AM ET – ISM Manufacturing PMI (May) Measures U.S. factory-sector health; readings below 50 indicate contraction. Today’s survey will confirm if the May downturn persists.
10:00 AM ET – Construction Spending (April) Tracks monthly change in total construction outlays—an important gauge of housing and infrastructure investment trends.
1:00 PM ET – 10-Year Treasury Note Auction Benchmark auction that influences the yield curve. Weak demand or higher yields here can pressure equities, especially growth-oriented sectors.
⚠️ Disclaimer:
This information is for educational and informational purposes only and should not be construed as financial advice. Always consult a licensed financial advisor before making investment decisions.
📌 #trading #stockmarket #economy #news #trendtao #charting #technicalanalysis

BRIEFING Week #22 : Still waiting for OilHere's your weekly update ! Brought to you each weekend with years of track-record history..
Don't forget to hit the like/follow button if you feel like this post deserves it ;)
That's the best way to support me and help pushing this content to other users.
Kindly,
Phil

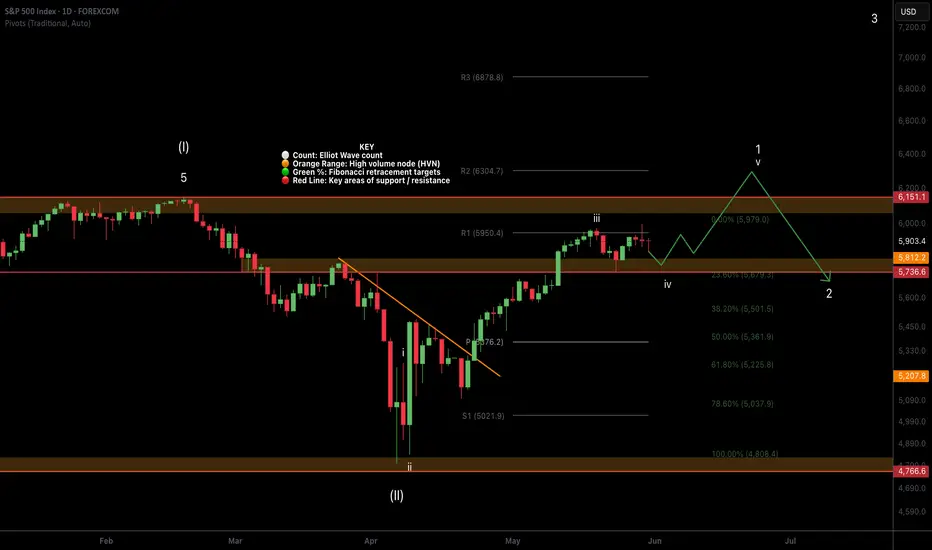
SPX500 (Daily) Elliot wave 4 underwaySPX appears to be printing a wave 4, potentially a triangle giving the proximity to the all the time high. Triangles are a motif wave ending pattern with a thrust up afterwards, typically a poke above the previous all time high before retracing trapping retail with FOMO.
Wave 2 is expected to retrace to the bottom of the triangle / wave 4 currently the high volume node support and .236 Fibonacci retracement at $5680
Safe trading
SPX: tariffs weekly tweet updateThe US Administration trade tariffs continue to bring confusion among market participants, but despite this, the S&P 500 managed to end May with a gain of 6,2%. The tariff-weekly-news included the announcement of the US President on social media that China “violated” current tariffs agreement. Although there were no further explanations, Bloomberg published information from an uncited source, that the US is planning to bring tariffs to China tech sector. At the same time, there was no official confirmation from the US Administration. The European Union is considering countermeasures on the US, after the announcement of the US Administration on an increase of tariffs on steel from 25% to 50%. All these ping-pong tariffs measures from the last period are causing some investors to slowly lose temper, with comments like “If you are an investor, you want to bet on good earnings, not good tweets about tariffs”, as Jay Hatfild from Infrastructure Capital Management told to CNBC. This brings some confidence that the markets will not make stronger moves on tweets, but only to actual moves of the US Administration in the coming period. Trading during May might provide some confidence also for the future period.
In line with investors, the University of Michigan Consumer Sentiment showed some relaxation with the final May data. The indicator ended the month at the level of 52,2 a bit better from estimated 51. The most important are inflation expectations which also eased a bit from previous release, in which sense five year inflation expectations are currently at 4,2%, and below market estimate of 4,6%.
The market confusion will most certainly continue also during June, but it seems at the lower volatility levels. More attention will be turned to macro data, and company earnings. The first trading week in June is bringing US jobs data, including the Non-farm payrolls, which might bring back some volatility on US equity markets.
Palantir Goes to Repeat Tycoon Buffett Early 1990s AchievementSomewhere in another Galaxy, in late December, 2024 (yet before The Second Coming of Trump), @TradingView asked at it awesome Giveaway: Happy Holidays & Merry Christmas.
1️⃣ What was your best trade this year?
2️⃣ What is your trading goal for 2025?
Here's what we answered:
1️⃣ What was your best trade this year?
- Surely Palantir NASDAQ:PLTR 💖
I followed Palantir all the year since January, 2024, from $16 per share, watch here .
Current result is 5X, to $80 per share.
Also I added more Palantir after SP500 Index inclusion in September 2024 watch here .
Current result is 2.6X, from $30 to $80 per share.
2️⃣ What is your trading goal for 2025?
- Once again, surely Palantir NASDAQ:PLTR 💖
It's gone 4 months or so... (Duh..? Ahaha.. 4 months, really? 😸😸😸)
Let see what's happened next at the main graph PLTR/SPX
First of all, let me explain in a few words what does this graph mean.
Rising (Blue) candle means Palantir NASDAQ:PLTR monthly return is better vs SPX
Falling (Red) candle means Palantir NASDAQ:PLTR monthly return is worse vs SPX
Conclusion
Palantir. The stock that outperformed S&P 500 Index, 11 consecutive months in a row.
Palantir. The stock that printed 11x since inception. 5.5x over the past twelve month and 1.5x in the year 2025 (the best one result so far over the all S&P 500 Index components).
Palantir. The stock that goes to repeat Tycoon Buffett achievement early 1990s (in 1992-93 Berkshire Hathway outperformed S&P 500 Index for a straight TWELVE MONTHS.
Palantir. Were we right with this stock on contest and won it? Exactly! Even though our prize has been toadly strangled. 🤭
--
Best wishes,
Your Beloved @PandorraResearch Team 😎

S&P500 finishing re-accumulation and sets eyes on 6230.The S&P500 / SPX has turned sideways after an impressive recovery from April's lows.
The 1day MA50 provides the same kind of support as it did after the October 2023 rebound.
The RSI pattern on both sequences is also similar and it suggests that the price is at the point where it breaks upwards to the Rising Resistance.
Target 6230.
Follow us, like the idea and leave a comment below!!

UNH: Why I Believe This Is a Dead Cat Bounce(Late posting)We’ve seen a quite the abounce in the market as of lately, but I believe it’s not a real recovery. To me, this looks like a classic dead cat bounce; a quick move up that happens during a downtrend before prices drop again. I’ll explain why I think this is the case, kind of a simple one.
First of all, the grand picture in the economy still looks fairly negative, especially respecting the TRUMP TARIFF new. Inflation hasn’t fully gone away, interest rates are still high, and consumer confidence is weak. There’s no major change in the news or the fundamentals that would support a strong comeback. It feels like people are just hoping things will improve, but the facts don’t really support that yet.
Second, the volume on this bounce has been low. In trading, volume tells you how strong a move is. If the price goes up but not many people are trading, it usually means there’s not much real buying happening. This bounce seems to be driven more by short sellers covering their positions, not by confident investors jumping in.
Third, we’re hitting key resistance levels—areas where the price dropped before—and we’re starting to see signs of rejection again. These levels are often hard to break through unless the market has strong momentum, and right now it doesn’t look like that’s the case.
Fourth, if you look at indicators like the RSI and MACD, they show that the price is already overbought. That means the recent move up may have gone too far, too fast. These kinds of readings usually lead to a pullback, especially when the bigger trend is still down.
Finally, the overall structure of the chart hasn’t changed. We’re still making lower highs and lower lows, which is what a downtrend looks like. Just because we’ve had a few green candles doesn’t mean the trend has reversed. Until we see the market start building a base and making new highs with strong support, I don’t think this bounce will last.
I n my opinion, this is one of those moments where people might get too excited too quickly. A lot of traders jump in thinking the bottom is in, only to get caught when the price turns back down. That’s why I’m staying cautious and watching for signs that the bounce is
failing.
I could be wrong, but right now, this feels more like a trap than a turning point.

SPX - June ProjectionsMay showed price heading back up to the high. This is four months now from the previous top. Generally for a major top to exhibit itself, it might take only three months to test. Four months is also not uncommon so it is possible that today's close will be last positive monthly close in a while.
I expect that the price will continue to rise, probably above the 6010 level of the last monthly closing high. If price surpasses the previous monthly close high, I will be watching for a turnaround, with prices eventually closing out June to the downside.
To me, based on the 40-month moving average. I have noticed that usually waves 2 and 4 have strong support at the 40 month moving average, where more major corrections will see price go below it. As price just came down to that level and didn't break it, we are in or have finished a wave 4. I'm still looking for lower prices assuming that this wave 4 to be a Flat with more sideways action ahead.
Currently short SP
