SPY - dump or bull market is back?hi traders,
Some months ago, we shared the idea where we explained that SPX will experience a correction:
The targets were reached, and next we saw a decent bounce, which is very well visible on the monthly candle.
Today, I see a lot of excitement about the monthly close, and many people call for a new all-time high soon.
I want to bring to your attention the monthly close in 2000.
It looks very similar to what we got yesterday.
A long, lower-shadow wick resulted in a bearish imbalance characterised by an excess of sellers, exerting downward pressure.
I still can see SPY/SPX retesting 570-580 levels, but it doesn't change the fact that lower levels may be tested in the next few weeks/months.
We got a bearish cross on the monthly time frame, which is not a joke.
If bears take control, I expect SPY to visit 460~ levels and later even lower: 410-408.
Long story short:
1. Short-term bounce may continue.
2. Mid-term - bears will take control, and we will see a bigger correction.
Do you agree? Share your opinion in the comments section
S&P 500 (SPX500)


Arshitecture / 30 Min Short Position SP500After the price reaches TP1, hold the current short position and consider adding to it on valid signals to ride the move toward TP2. Apply the same strategy for TP3, scaling in cautiously at key resistance zones.
I’ll share the key confirmations on the chart as they appear.
Goodluck BLUEBERRY:SP500

Hellena | SPX500 (4H): LONG to resistance area of 5682.Colleagues, I think that the deep downward movement is over and at the moment I expect an upward movement in a five-wave impulse. At the moment I expect a correction in wave “2” to the area of 5100, after which I expect the development of wave “3” at least to the resistance area of 5682.
There are two possible ways to enter the position:
1) Market entry
2) Pending Limit Orders.
Manage your capital correctly and competently! Only enter trades based on reliable patterns!

Nasdaq: Where should I buy from next? New bullish orderblockWe are hunting the next buyzone already. The correction zone is printing now.
This is how you accurately forecast your next entry ahead of time. Learn how corrections should work. Long below higher time frame (Hourly/Daily/Weekly) lows is the name of the game.
This should be easy work, and you can feel free to look for longs below 15m lows on the way to the targets above. Once we hit those, we should look for correction after closing below hourly candles, the same way we were able to freely take long after close above hourly candles today just as I prescribed while it was dropping.
This is just the rules of the game 🔓 gotta be sharp enough to observe them and trust the mechanics. Thanks for tuning in

SPX bullishI am now bullish in near term. For those following me, I have updated HILO EMA squeeze band with an option to plot more lines as seen this chart. I see a swing high of 5770, although a bit cautious about the month end. Market is tired of Trump tantrums and more focused on earnings which have been great so far. For near term month or two I would be looking for bye the dip

SPY/QQQ Plan Your Trade Update For 4-30 : Moving Into FlaggingThis quick update video should help you understand how my May 2-5 Major Bottom pattern could represent a move into FLAGGING within an inverted EPP pattern.
If my research is correct, the next move for the market will be a moderate downward price trend that will represent the FLAGGING portion of the inverted EPP pattern.
You've all see how bullish EPP patterns play out over the past 3 to 5+ months. Now we get to see how this recent SPY low near 480 turns into an inverted EPP pattern. This is basically the same pattern - but forming in an inverted mode.
As we transition through this inverted EPP pattern, what I'm looking for is a breakdown move to create the new FLAGGING formation. This move aligns perfectly with my May 2-5 Major Bottom pattern and could be a perfect setup for the attempted "breaking of the Flag High" in late May 2025.
I'm watching Gold and Silver stay relatively strong today. So I'm seeing today's market move as a "reversion move" - not really a breakdown move (yet).
It will be interesting to see how this plays out.
If the markets move into Flagging, as I expect, the big opportunities will be to ride the Flagging & Breakdown patterns over the next 30+ days before we move into either an INVALIDATION or CONTINUATION phase of the inverted EPP pattern.
Price is the ultimate indicator - you just need to know what to look for.
Get some.
#trading #research #investing #tradingalgos #tradingsignals #cycles #fibonacci #elliotwave #modelingsystems #stocks #bitcoin #btcusd #cryptos #spy #gold #nq #investing #trading #spytrading #spymarket #tradingmarket #stockmarket #silver

The SPX Sell Off at 5500Hi all,
It has been a while since we posted as we waited for a really good trade setup. The SPX is hovering at 5500 and we believe it is the right level to sell.
1) There is a shark pattern at this level
2) RSI is overbought on every time frame except H4 and D1
3) There are smaller patterns to sell
4) There is very strong structural resistance at 5510 to 5520
The first target will be 5306 which has a great risk to reward of 1:5.
We will wait for M15 divergence and a trend line break to enter.

SPY/QQQ Plan Your Trade For 4-30 : Carryover PatternToday's Carryover pattern suggests the markets may attempt to trend slightly upward after the big downward pressure/GAP sets up this morning.
As many of you are already aware, I have been predicting a May 2-5 Major Bottom in the markets.
I would suggest today's carryover pattern may be negated by an early breakdown in the markets. If my May 2-5 Major Bottom pattern is going to show up, the markets would likely start to break downward today and tomorrow - leading to the Major CRUSH pattern on Friday.
Gold and Silver appear to be consolidating into a flagging/cradle pattern. I believe the downward pressure on the markets will likely prompt a flush-out low in metals before another big rally phase sets up.
BTCUSD is stalling and will likely pull downward as my May 2-5 Major Bottom pattern plays out.
Basically, HEDGE your positions.
This market looks like it will roll into a moderate low over the next 4-5+ days, then base and bottom after May 10th or so.
As I've suggested, I positioned for this move about 4-5 days ago. Now, I just need to ride it out and start booking profits when they happen.
Get some.
#trading #research #investing #tradingalgos #tradingsignals #cycles #fibonacci #elliotwave #modelingsystems #stocks #bitcoin #btcusd #cryptos #spy #gold #nq #investing #trading #spytrading #spymarket #tradingmarket #stockmarket #silver

S&P500 INTRADAY resistance at 5510A wave of earnings reports is due today, with Microsoft and Meta in focus. The tech sector remains under pressure, highlighted by a 15% drop in Super Micro Computer after disappointing results.
In Europe, banks are seeing strong revenue growth, benefiting from recent market volatility linked to Trump’s trade policies. However, Mercedes and Stellantis have joined the list of companies withdrawing guidance due to uncertainty.
Donald Trump has again criticized Fed Chair Jerome Powell and defended his tariff strategy during an event marking his 100th day in office. Investors are now awaiting key US data, including inflation and GDP figures.
Meanwhile, China’s factory activity has contracted to its lowest level since December 2023, signaling the early impact of US tariffs and increasing pressure for government stimulus.
US consumer companies are also sounding cautious, pointing to a weaker economic outlook ahead.
Key Support and Resistance Levels
Resistance Level 1: 5670
Resistance Level 2: 5740
Resistance Level 3: 5820
Support Level 1: 5380
Support Level 2: 5310
Support Level 3: 5236
This communication is for informational purposes only and should not be viewed as any form of recommendation as to a particular course of action or as investment advice. It is not intended as an offer or solicitation for the purchase or sale of any financial instrument or as an official confirmation of any transaction. Opinions, estimates and assumptions expressed herein are made as of the date of this communication and are subject to change without notice. This communication has been prepared based upon information, including market prices, data and other information, believed to be reliable; however, Trade Nation does not warrant its completeness or accuracy. All market prices and market data contained in or attached to this communication are indicative and subject to change without notice.

SPX: Good push at EOD 4/30, but…Possible H&S? Hear me outGood push at end of day on 4/30 at close.
Zooming out, it’s starting look like it’s forming a H&S. I’m starting to see a lot of people flipping bearish as well. But, also near close today, volume was not promising, declining at the close.
I swung short-term puts on SPY, I like SPX puts for a day trade due to this formation but this H&S can possibly out within the end of week with more data and uncertainty or the following week.
I’m short at the touch of the light red line: 5655.79 to the downside.
Gaps below 5354.76, 5206.44
Would say by EOW to next week, if we pull back, may form/complete the right shoulder.
Do your DD!
Let me know your thoughts! #NFA

UBER Long Breakout Play | 4H ChartUber Technologies Inc. (UBER) just broke out of a long-standing descending trendline, confirming a bullish structural shift.
Entry: $79.43
SL: $70.45
TP: $86.93
R:R : 1:1.8
Technical Highlights
• Clean breakout above descending trendline and horizontal resistance at $77.35
• Retest and hold above previous resistance confirms bullish strength
• Strong bullish momentum and candle close above key levels
• Targeting the next major resistance zone near $87
Bias
Bullish continuation as long as $77.35 holds as support.
Plan
Trail stop if price sustains above $82. Look for volume confirmation on breakout retest.

April 29 Trade Journal & Stock Market AnalysisEOD accountability report: +686.25
Sleep: 8 hour, Overall health: :thumbsup:
Overall a decent day, but signals felt iffy today.
**Daily Trade Signals based on VX Algo System**
— 10:00 AM Market Structure flipped bullish on VX Algo X3!
10:27 AM VXAlgo ES X1 Sell Signal (double signal) :x:
1:08 PM Market Structure flipped bearish on VX Algo X3! :x:
1:51 PM Market Structure flipped bullish on VX Algo X3!
— 2:20 PM VX Algo ES X1 Sell Signal :x:
— 3:38 PM VXAlgo ES X3 Sell Signal (Double signal)
Next day plan--> Over 5470 = Bullish, Under 5470 = Bearish
Video Recap -->https://www.tradingview.com/u/WallSt007/#published-charts

Weekly Price Action: S&P500 Emini Futures ES1! Tuesday 4/29/2025In this video, we will be looking into the potential price action ES1!.

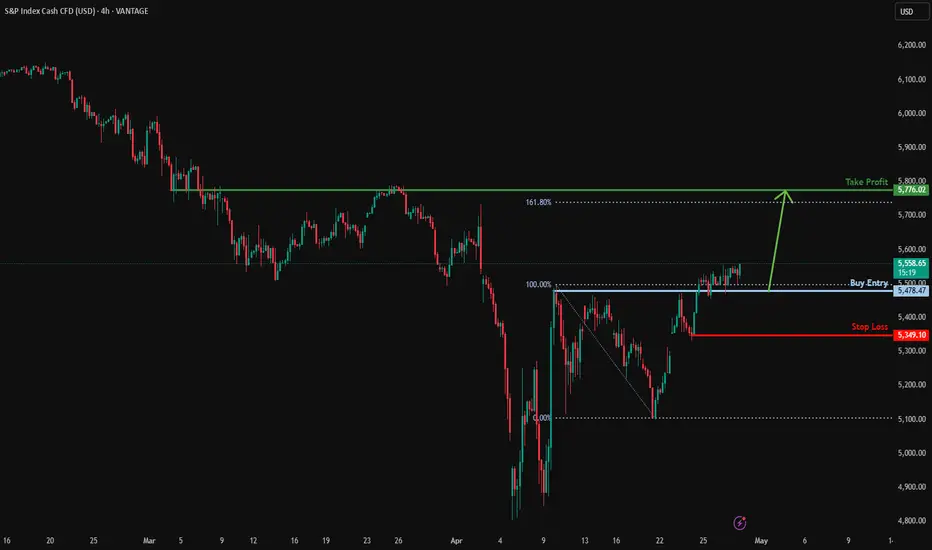
Bullish rise off pullback support?S&P500 has reacted off the support level which is a pullback support and could potentially rise from this level to our take profit.
Entry: 5,478.47
Why we like it:
There is a pullback support level.
Stop loss: 5,349.10
Why we like it:
There is a pullback support level;
Take profit: 5,776.02
Why we like it:
There is a pullback resistance level that is slightly above the 161.8% Fibonacci extension.
Enjoying your TradingView experience? Review us!
Please be advised that the information presented on TradingView is provided to Vantage (‘Vantage Global Limited’, ‘we’) by a third-party provider (‘Everest Fortune Group’). Please be reminded that you are solely responsible for the trading decisions on your account. There is a very high degree of risk involved in trading. Any information and/or content is intended entirely for research, educational and informational purposes only and does not constitute investment or consultation advice or investment strategy. The information is not tailored to the investment needs of any specific person and therefore does not involve a consideration of any of the investment objectives, financial situation or needs of any viewer that may receive it. Kindly also note that past performance is not a reliable indicator of future results. Actual results may differ materially from those anticipated in forward-looking or past performance statements. We assume no liability as to the accuracy or completeness of any of the information and/or content provided herein and the Company cannot be held responsible for any omission, mistake nor for any loss or damage including without limitation to any loss of profit which may arise from reliance on any information supplied by Everest Fortune Group.
MACD says a little higher for a little longerAs per the individual stocks I cover that have not yet reached their ideal retracement areas I am looking for the SPX to get higher into my target box. In any event it's reasonable for me to say we're in a B wave and therefore our pattern can develop into something more complex. Nonetheless, I am mainly looking for MACD to reach the zero line at the very minimum.
The take-a-way from this update is I am looking slightly higher in the markets for slightly longer...before our minor C wave takes hold of the market.
Best to all.
Chris

April 29, 2025 - Waiting for the Crash or the Miracle?Hello everyone, it’s April 29, 2025. Yesterday’s market session was about as exciting as watching paint dry. After months of Trump-fueled chaos, investors seem almost relieved that… nothing happened. Indices barely moved: TVC:DJI up 0.28%, SP:SPX up a pathetic 0.06%, CME_MINI:NQ1! down 0.10%. In short: we’re falling from a 150-story building, and so far, so good — but we know the real pain comes when we hit the ground.
Markets are clinging to hopes that Trump’s trade war with China might get a Hollywood-style happy ending. He’s calmed down a bit. Stopped slamming Powell, flirted with diplomacy, and softened up on auto tariffs. But with an avalanche of critical economic data coming (Consumer Confidence, GDP, PCE, Jobs) and Magnificent Seven earnings, no one’s taking big bets right now. Everyone’s waiting to see if the economic parachute opens, or if we get pancaked on impact.
Meanwhile, US macro isn’t looking great. Confidence is sinking — 53% of Americans say their finances are worsening, a record since COVID. Consumer spending is stalling, companies like NASDAQ:AAL and NASDAQ:DPZ are canceling forecasts, and the real estate market is coughing. Even hardcore Trump supporters are starting to sweat. The US might still technically be growing, but psychologically, the recession has already started.
OANDA:XAUUSD is holding strong at $3,321, BLACKBULL:WTI is around $61.57, and BINANCE:BTCUSDT is cruising near $94,400. Futures this morning are flailing between -0.6% and +0.2%, dancing to the tune of whatever headline drops next.
On the political front, Trump pulled a classic backpedal on auto tariffs: no double penalties for carmakers, partial refunds on tariffs already paid, and promises of time for US production reshoring. Nice words but rebuilding car factories will take years.
As for NASDAQ:NVDA , it’s under pressure after China banned sales of its H20 chips. Huawei’s Ascend 910D chip is stepping in — good for China, but too slow and too pricey for the rest of the world. Nvidia stays king globally for now, but the tech war is heating up.
Today, eyes are on key numbers: US Consumer Confidence (expected 87.7) and JOLTS job openings (expected 7.49M). Also, a heavy lineup of earnings: NYSE:V , NASDAQ:SBUX , NASDAQ:COKE , NYSE:PFE , NYSE:SNAP , and more.
For now, we’re still in free fall, hoping there’s a giant crash pad waiting at the bottom. Hang tight — it’s going to be another wild one.

S&P500 INTRADAY resistance at 5510Earnings season heats up with major companies like Visa, Coca-Cola, Starbucks, UPS, and Pfizer reporting results. In Europe, HSBC announced a $3 billion share buyback, while BP shares dropped due to weaker cash flow.
In Canada, the Liberal Party is set to win a fourth term, but likely without a majority, which could lead to a coalition-style government.
Meanwhile, the Trump administration plans to ease auto tariffs on foreign parts used in U.S.-made vehicles, boosting Ford and GM shares in premarket trading.
Market Impact:
Watch for shifts in trade-sensitive sectors, supply chain plays (especially in tech), and defense stocks as geopolitical risk evolves.
Key Support and Resistance Levels
Resistance Level 1: 5670
Resistance Level 2: 5740
Resistance Level 3: 5820
Support Level 1: 5380
Support Level 2: 5310
Support Level 3: 5236
This communication is for informational purposes only and should not be viewed as any form of recommendation as to a particular course of action or as investment advice. It is not intended as an offer or solicitation for the purchase or sale of any financial instrument or as an official confirmation of any transaction. Opinions, estimates and assumptions expressed herein are made as of the date of this communication and are subject to change without notice. This communication has been prepared based upon information, including market prices, data and other information, believed to be reliable; however, Trade Nation does not warrant its completeness or accuracy. All market prices and market data contained in or attached to this communication are indicative and subject to change without notice.

SPY/QQQ Plan Your Trade For 4-29 : BreakAway in CarryoverToday's pattern is a Breakaway in Carryover mode.
That suggests today's price move will attempt to break away from yesterday's body range and may be somewhat similar to yesterday's price action.
I interpret this pattern as a potential breakdown (breakaway) attempting to possibly find support below 540.
Remember, we are moving into the May 2-5 Major Low cycle pattern - so price should attempt to move downward at this stage.
Gold and Silver are moving through a consolidated topping phase. Where price attempts to push higher through a series of tops. Ultimately, I believe Gold and Silver will make a big breakout move higher (above $3500, $35.00) and attempt to rally up - breaking the $4200+ level (eventually).
Bitcoin seems to be stalling, like the SPY/QQQ, near upper resistance (near the FIB 50% level).
I see this stalling as the markets searching for a trend.
As I keep saying, I have a hard time seeing any reason why the markets will rally to new ATHs in the current environment (except the possibility of pure speculation).
We need to see some real growth expectations for the markets to begin another big rally phase.
Right now, I'm looking for confirmation of my breakdown into the May 2-5 Major Bottom pattern. Let's see if that actually happens or not.
Get some.
#trading #research #investing #tradingalgos #tradingsignals #cycles #fibonacci #elliotwave #modelingsystems #stocks #bitcoin #btcusd #cryptos #spy #gold #nq #investing #trading #spytrading #spymarket #tradingmarket #stockmarket #silver

SPX500 H4 | Potential bullish bounceSPX500 could fall towards an overlap support and potentially bounce off this level to climb higher.
Buy entry is at 5,546.94 which is an overlap support.
Stop loss is at 5,440.00 which is a level that lies underneath an overlap support.
Take profit is at 5,789.71 which is a swing-high resistance.
High Risk Investment Warning
Trading Forex/CFDs on margin carries a high level of risk and may not be suitable for all investors. Leverage can work against you.
Stratos Markets Limited (tradu.com):
CFDs are complex instruments and come with a high risk of losing money rapidly due to leverage. 63% of retail investor accounts lose money when trading CFDs with this provider. You should consider whether you understand how CFDs work and whether you can afford to take the high risk of losing your money.
Stratos Europe Ltd (tradu.com):
CFDs are complex instruments and come with a high risk of losing money rapidly due to leverage. 63% of retail investor accounts lose money when trading CFDs with this provider. You should consider whether you understand how CFDs work and whether you can afford to take the high risk of losing your money.
Stratos Global LLC (tradu.com):
Losses can exceed deposits.
Please be advised that the information presented on TradingView is provided to Tradu (‘Company’, ‘we’) by a third-party provider (‘TFA Global Pte Ltd’). Please be reminded that you are solely responsible for the trading decisions on your account. There is a very high degree of risk involved in trading. Any information and/or content is intended entirely for research, educational and informational purposes only and does not constitute investment or consultation advice or investment strategy. The information is not tailored to the investment needs of any specific person and therefore does not involve a consideration of any of the investment objectives, financial situation or needs of any viewer that may receive it. Kindly also note that past performance is not a reliable indicator of future results. Actual results may differ materially from those anticipated in forward-looking or past performance statements. We assume no liability as to the accuracy or completeness of any of the information and/or content provided herein and the Company cannot be held responsible for any omission, mistake nor for any loss or damage including without limitation to any loss of profit which may arise from reliance on any information supplied by TFA Global Pte Ltd.
The speaker(s) is neither an employee, agent nor representative of Tradu and is therefore acting independently. The opinions given are their own, constitute general market commentary, and do not constitute the opinion or advice of Tradu or any form of personal or investment advice. Tradu neither endorses nor guarantees offerings of third-party speakers, nor is Tradu responsible for the content, veracity or opinions of third-party speakers, presenters or participants.

Bull in a China Shop. The S&P 500 Index After 100 Days of TrumpPresident Donald Trump's first 100 days in office were the worst for the stock market in any postwar four-year U.S. presidential cycle since the 1970s.
The S&P 500's 7.9% drop from Trump's inauguration on Jan. 20 to the close on April 25 is the second-worst first 100 days since President Richard Nixon's second term.
Nixon, after taking office as President of the United States (for the second time) on January 20, 1973, witnessed the S&P 500 index fall by 9.9% in his first 100 days in office, due to the unsuccessful economic measures he took to combat inflation, which led to the recession of 1973-1975 when the S&P 500 index losses of nearly to 50 percent.
It all started in January 1973 in the best soap opera traditions of Wall Street, at the historical peaks of the S&P 500 index..
..But less than two years later it quickly grew into a Western with a good dose of Horror, because the scenario of a 2-fold reduction of the S&P 500 index was unheard those times for financial tycoons and ordinary onlookers on the street, since the Great Depression of the 1930s, that is, for the entire post-war time span since World War II ended, or almost for forty years.
Nixon later resigned in 1974 amid the Watergate scandal.
On average, the S&P 500 rises 2.1% in the first 100 days of any president's term, according to CFRA, based on data from election years 1944 through 2020.
The severity of the stock market slide early in Trump's presidency stands in stark contrast to the initial "The Future is Bright as Never" euphoria following his election victory in November, when the S&P 500 jumped to all-time highs on the belief that Mr. Trump would shake off the clouds, end the war in Ukraine overnight, and deliver long-awaited tax cuts and deregulation.
Growth slowed and then, alas, plummeted as Trump used his first days in office to push other campaign promises that investors took less seriously, notably an aggressive approach to trade that many fear will fuel inflation and push the U.S. into recession.
The S&P 500 fell sharply in April, losing 10% in just two days and briefly entering a bear market after Trump announced “reciprocal” tariffs, amid a national emergency that gave him free rein to push through tariffs without congressional oversight.
Then Trump began yanking the tariff switch back and forth, reversing part of that tariff decision and giving countries a 90-day window to renegotiate, calming some investor fears.
Many fear more downside is ahead.
Everyone is looking for a bottom. But it could just be a bear market rally, a short-term bounce of sorts.
And it's not certain that we're out of the woods yet, given the lack of clarity and ongoing uncertainty in Washington.
Time will tell only...
--
Best 'China shop' wishes,
@PandorraResearch Team

Bearish drop?S&P500 is reacting off the resistance level which is an overlap resistance and could drop from this level to our take profit.
Entry: 5,510.94
Why we like it:
There is an overlap resistance level.
Stop loss: 5,665.52
Why we like it:
There is a pullback resistance.
Take profit: 5,324.97
Why we like it:
There is an overlap support level that lines up with the 50% Fibonacci retracement.
Enjoying your TradingView experience? Review us!
Please be advised that the information presented on TradingView is provided to Vantage (‘Vantage Global Limited’, ‘we’) by a third-party provider (‘Everest Fortune Group’). Please be reminded that you are solely responsible for the trading decisions on your account. There is a very high degree of risk involved in trading. Any information and/or content is intended entirely for research, educational and informational purposes only and does not constitute investment or consultation advice or investment strategy. The information is not tailored to the investment needs of any specific person and therefore does not involve a consideration of any of the investment objectives, financial situation or needs of any viewer that may receive it. Kindly also note that past performance is not a reliable indicator of future results. Actual results may differ materially from those anticipated in forward-looking or past performance statements. We assume no liability as to the accuracy or completeness of any of the information and/or content provided herein and the Company cannot be held responsible for any omission, mistake nor for any loss or damage including without limitation to any loss of profit which may arise from reliance on any information supplied by Everest Fortune Group.

SPY/QQQ Plan Your Trade Update : Playing Into The Major BottomThis update highlights what I believe will be the last level of defense for price (support) on the SPY and why it is so important to HEDGE the markets right now.
The upward price move has reached the ULTIMATE HIGH (I believe) and is now moving into a Bullish EPP pattern (shifting into the downward pullback, then it will move into the flagging phase).
This flagging phase will be the deciding move (IMO) related to IF the markets attempt to break upward or downward near the current Fib 50% level.
This is why it is so important to HEDGE all open positions right now.
This battle zone in the markets (near the Fib 50% level) is not a guaranteed move higher or lower. Basically, we are watching the battle take place in live trading.
What we can do is try to rely on the EPP patterns and other formations to help guide us to the highest probable outcome, but we have to stay liquid and fluid as the markets trend.
Right now, I would suggest the breakdown (Major Low) outcome is about 70-80% likely. Thus, the breakaway (upside) outcome may be 20-30% likely based on my analysis.
But that could change if the SPY moves above $555.
Thank you again for all the great comments. I'm trying to help as many traders as I can. But this move to the 50% level is very "indecisive". So, I'm having to rely on Fibonacci Price Theory and other techniques (money management/HEDGING) as a way to protect my capital while I trade.
This is a great example of how you can learn techniques (beyond technical analysis) related to what to do when you really don't know what the markets may do in the near future.
The answer is HEDGE ACTIVE POSITIONS - or pull trades off (even if they are at a loss) and then HEDGE whatever you want to keep active.
No one is going to laugh when you tell them, "I protected my capital by hedging last week" when they are looking at severe losses and you are NOT looking as severe losses.
It is SMART TRADING.
Get some.
#trading #research #investing #tradingalgos #tradingsignals #cycles #fibonacci #elliotwave #modelingsystems #stocks #bitcoin #btcusd #cryptos #spy #gold #nq #investing #trading #spytrading #spymarket #tradingmarket #stockmarket #silver
