S&P 500 correction before the global fall.S&P 500 correction before the global fall of the usa stock market.
Hey traders! I’m sure many of you have noticed that after the introduction of retaliatory tariffs, the markets started getting pretty choppy.
The S&P 500 took a serious dive.
• On the weekly chart, I’ve marked a support level + the 161.8% Fibonacci level, where we might see a bounce back to the $5680–$5800 range.
• But from there, I think we could see the start of a major crash—both in equities and crypto—that could last 1–2 years.
• Based on my estimates, the S&P 500 could drop back to 2020–2021 levels, a wide range of 2200–3000.
• For Bitcoin, we’re talking around $5000; for Ethereum, $100–$300; and for Solana, $2–$12.
3D Chart:
3W Chart:
Real-world events that could tank the stock market this hard:
Global Recession: If major economies (US, China, EU) slide into a recession at the same time—think trade wars, rampant inflation, or a debt crisis—investors will dump risky assets like hot potatoes.
Trade War Escalation: Harsher tariffs between the US and China/EU could wreck supply chains, crush corporate earnings, and spark a full-on market panic.
Geopolitical Conflict: A big blow-up—like a full-scale war or crisis (say, Taiwan or the Middle East)—could send capital fleeing to safe havens (gold, bonds), while stocks and crypto get slaughtered.
Collapse of a Major Financial Player: If a big bank or hedge fund goes bust (Lehman Brothers 2.0-style) due to an overheated market or bad debt, it could trigger a domino effect.
Energy Crisis: A spike in oil/gas prices (from sanctions or conflicts, for example) could kneecap the economy and drag risk assets down with it.
Market Bubble Burst: If the current rally turns out to be a massive bubble (and plenty of folks think it is), its pop could pull indexes down all on its own.
Looming Wars: A potential Russia-Europe war starting as early as 2025, or an Iran-Israel conflict that drags in multiple nations, could destabilize global markets, spike energy prices, and send investors running for the exits.
S&P 500 (SPX500)

April 28, 2025 - Broken Supply Chains, and the DC CircusHello everyone, it’s April 28, 2025. The week ahead promises to be spectacular (or a complete disaster) depending on which way the wind blows out of Washington. So far, the futures are down about 0.6% this morning, as everyone’s trying to cut risk ahead of a week crammed with Big Tech earnings ( NASDAQ:AAPL , NASDAQ:MSFT , NASDAQ:AMZN , NASDAQ:META ), a mountain of macro data (PCE, GDP, ISM, jobs), and of course, the never-ending Trump tariff soap opera.
On the US politics front, Trump stayed uncharacteristically quiet over the weekend, no new bombshells. But whispers about “talks” with China surfaced, without any real confirmation. Meanwhile, several countries are supposedly rushing to negotiate tariff deals with the US. Expect headlines (and chaos) throughout the week.
Supply chains are starting to crack. Container traffic from China to the US has plunged 60%, and if deals aren’t made by mid-May, we could be staring down empty shelves and layoffs in transport and retail sectors. Think “Black Friday” without anything to buy.
Meanwhile, the drama at the Fed continues. Kevin Warsh, still salty about not replacing Powell, attacked the Fed’s “media circus” style, blaming it for post-Covid inflation. Warsh wants the Fed to go old-school: shut up, protect the dollar, and stop playing superhero. No forecasts, no endless press conferences. Just cigars and silence.
On the macro side, this week’s economic data could turn into a horror show: weak jobs numbers, soft GDP, slowing PCE, all raising the probability of recession. If that happens, expect markets to start begging the Fed to cut rates sooner rather than later.
Assets snapshot:
• BLACKBULL:WTI : $63.36
• OANDA:XAUUSD : $3,307
• INDEX:BTCUSD : $94,000
In short: expect maximum volatility, endless surprises from DC, and a market that could spin on a dime. Stay sharp, stay skeptical, and brace for anything.

SPY/QQQ Plan Your Trade For 4-28 : Inside Breakaway In TRENDToday's Inside Breakaway pattern in Trend mode suggests the SPY will attempt to break away from Friday's body range. The Weekly Bias turned to BULLISH last week.
I believe today's price move will be indicative of the rest of the week. We are moving into a very strong Major CRUSH pattern on Friday and I believe that pattern will be a big breakdown move in price.
Thus, I believe the early trading this week (today and tomorrow) will set the tone for the rest of the week.
If we see a rotation in price near the 550 level (to the downside) then my May Low pattern will likely transition into a price breakdown this week.
If we see more upside price action on Monday/Tuesday, then I would be very cautious of the end of this week as a sudden price breakdown may happen.
Gold and Silver will likely stay very muted for the next two trading days. The Canadian Elections will likely cause the US to briefly pause as one of our closest neighbors and trading partners moves through this pivotal election.
Bitcoin will also likely pause a bit in early trading this week and BTCUSD moves up to the $95-96k upper resistance area.
I suggest traders take advantage of this pause in price action to HEDGE their open positions. I believe the bigger move is still to the downside, but I also believe the markets could continue to push a bit higher before ROLLING into that May 2-5 Major Bottom.
At this point, near the 50% Fib retracement level, the markets could break in either direction. But I still believe the May 2-5 Major Bottom will play out as a unique lower low price level - below $525-530 on the SPY.
Get some.
#trading #research #investing #tradingalgos #tradingsignals #cycles #fibonacci #elliotwave #modelingsystems #stocks #bitcoin #btcusd #cryptos #spy #gold #nq #investing #trading #spytrading #spymarket #tradingmarket #stockmarket #silver

3 Oversold Stocks Poised for a Rally – MAS, IQV & TMOBelow is today’s SmartApingAI snapshot of three highly oversold names showing early signs of a rebound. Scroll down for a quick refresher on each company’s fundamentals, key technicals, and what makes them attractive at current levels.
1. Masco Corp ( NYSE:MAS )
What They Do:
Masco designs, manufactures and sells a broad range of home-improvement and new-construction products, including faucets, cabinets, hardware, coatings and architectural products.
Customers:
• Homeowners tackling renovation projects
• Professional contractors and builders
Income Source:
Primarily through the sale of mid-range to premium fixtures, cabinetry systems and paint/coatings.
Geographic Footprint:
• ~85% North America
• ~15% Europe
Product Pricing:
Mid-range to premium, with strong brand recognition in kitchen and bath fixtures.
SmartAping AI Model Target Price:
$81.36
Technical Snapshot:
• Broke below—and then bounced off—the $57 weekly support zone
• Now trading at $60.42, up from the intra-week low
• WiseStrat Macro ASI: deeply oversold at –120, turning bullish
• WiseStrat Micro ASI: still bearish, suggesting cautious position sizing
Why Watch:
Home-improvement spending has held up despite moderating housing starts, and MAS’s disciplined balance sheet and dividend yield (~2%) make it a compelling recovery play if consumer confidence picks up.
2. IQVIA Holdings Inc ( NYSE:IQV )
What They Do:
IQVIA provides data analytics, research services and technology solutions that power clinical trials, market research and real-world evidence for the life-sciences industry.
Customers:
• Pharma and biotech firms
• Medical device companies
• Healthcare providers and payers
Income Source:
Subscription and project-based fees for data platforms, consulting and trial execution services.
Geographic Footprint:
• 50% Americas
• 30% EMEA (Europe, Middle East & Africa)
• 20% Asia-Pacific
Product Pricing:
Variable, tailored to project scope—from high-volume data subscriptions to multi-million-dollar trial outsourcing contracts.
SmartAping AI Model Target Price:
$275.35
Technical Snapshot:
• Dropped below the $137 weekly support last week, then staged a relief rally
• Currently at $150.28
• WiseStrat Macro ASI: extremely oversold at –127, now in bullish reversal mode
• WiseStrat Micro ASI: turning positive, hinting at building short-term momentum
Why Watch:
With global R&D spend on track to exceed $250 billion this year, IQVIA’s blend of analytics and CRO services is in high demand. A seasonal uptick in trial starts could catalyze upside toward our $275 target.
3. Thermo Fisher Scientific Inc ( NYSE:TMO )
What They Do:
Thermo Fisher supplies scientific instruments, reagents and software used in research, diagnostics, manufacturing and safety testing across life-sciences and industrial markets.
Customers:
• Academic, government and corporate research labs
• Clinical and diagnostic facilities
• Biopharma manufacturers
Income Source:
Sales of equipment (from a few hundred to multi-million dollars), consumables, and service contracts.
Geographic Footprint:
• ~50% North America
• ~30% Europe
• ~20% Asia-Pacific & other
Product Pricing:
Ranges widely: entry-level lab kits to high-end sequencers and complete lab automation lines.
SmartAping AI Model Target Price:
$645.83
Technical Snapshot:
• Tested and held the $412.73 weekly support last week, bouncing back to $424.24
• WiseStrat Macro ASI: oversold at –129, now showing bullish tilt
• WiseStrat Micro ASI: still negative, cautioning potential retest of $412
Why Watch:
Strong long-term secular drivers—gene therapy, personalized medicine and diagnostics—remain intact. A washout in biotech funding fears has left TMO trading at a rare discount to growth peers.

S&P 500 Rally Exhausted? Watch This Level for the Next Drop!The S&P 500 Index( SP:SPX ) has finally touched the Resistance zone($5,680-$5,500) as I expected in my previous post .
The S&P 500 Index is moving near the Resistance zone($5,680-$5,500) , the Resistance line, and Yearly Pivot Point .
Also, we can see the Regular Divergence(RD-) between Consecutive Peaks .
In terms of Elliott Wave theory , it seems that the S&P 500 Index is completing the Zigzag Correction(ABC/5-3-5) , and if the uptrend line breaks , we can confirm the end of the Zigzag correction .
When the S&P 500 Index started to rise on April 22 , Bitcoin also started to rise at the same time , so a decline in the S&P 500 Index can cause Bitcoin ( BINANCE:BTCUSDT ) to decline .
I expect the S&P 500 Index to drop to at least $5,313 AFTER breaking the uptrend line .
Note: If the S&P 500 Index touches $5,712, we can expect more pumps.
Please respect each other's ideas and express them politely if you agree or disagree.
S&P 500 Index Analyze (SPX500USD),2-hour time frame.
Be sure to follow the updated ideas.
Do not forget to put a Stop loss for your positions (For every position you want to open).
Please follow your strategy and updates; this is just my Idea, and I will gladly see your ideas in this post.
Please do not forget the ✅' like '✅ button 🙏😊 & Share it with your friends; thanks, and Trade safe.

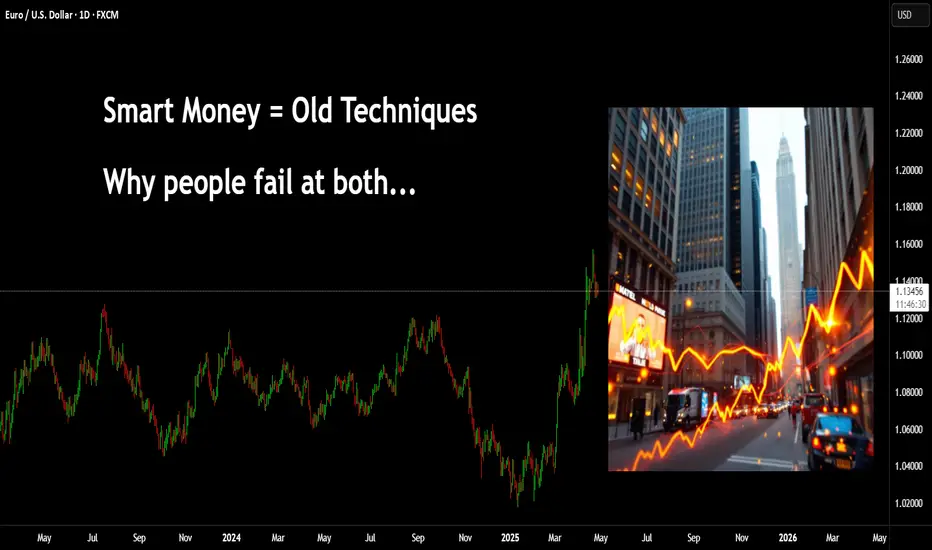
Why does it always go against you? You might be new to trading, you may have several years of experience. But, where a lot of people still seem to go wrong is in not realising the relationships.
I have posted hundreds of educational posts here on Tradingview from cartoons, trying to simplify techniques through to market relationships between technical systems such as Elliott Wave and Wyckoff.
Many new traders fall foul of social media posts covering "SMC - Smart Money Concepts" and are not seasoned enough to appreciate what or why these can work for some and not for others.
You have Elliott Wave traders, there is a saying along the lines of "if you put 10 Elliott traders in a room searching for a wave count you will come out with 11 different answers"
This isn't to say Elliott doesn't work, nor Smart Money.
The market seeks liquidity, it forms seemingly complex patterns that humans try to make sense of. We are great at that, seeing patterns even if they are not there. - Look, there's an upside-down butterfly 1.618 extension!
First, you need to appreciate Elliott Wave counts on smaller timeframe are pointless, especially in the age of algo's and bots. However, sentiment on the larger timeframes can't really be spoofed.
In this first image; you can see a market wave that is straight out of a textbook.
Let's also add some Wyckoff; if you were to visualise this - Wyckoff schematics would be visible on smaller timeframes, the Green boxes represent accumulation and the Red show distribution.
Let's overlay and Elliott Wave count -
Take that to the next level, this count is only part of a higher fractal count.
How does this fit into smart money concepts? well, it's more like - How does Smart Money fit into this?
Elliott waves and Wyckoff have been around for over 100 years. Many of the techniques shown on YT video's today can be traced back to these older concepts.
Now, if you can see how a 1-2 EW count pushes up for a 3. You can zoom in again and start to see what to expect when trading using SMC.
In this image you can see a drop, then a gap as price pushes back up (I haven't bothered drawing wicks for simplicity assume their inside the box)
Many traders would now anticipate a move that looks something like this.
Only to see price do this
Yeah - you're not the only one!
The next issue is where and how Supply and Demand is drawn.
Ok, the gap didn't hold, it must be the demand level there. GO AGAIN!!!
How did that play out? Trade 1, Trade 2 =
What about now?
Price holds the support
This time you are afraid to go in. Then one of two things happens.
1)
Or
2)
In the first image, we can see a sweep of prior liquidity and that creates momentum for a move up. In the second image, price simply melts away.
This is an easy fix. It all comes down to understanding what the charts are trying to tell you.
People love to talk about how "Smart Money" is the banks and institutional players - how they are playing against you on every click of the button.
The truth is, most people don't understand the market.
When larger players enter the market, the can leave a pretty obvious footprint. In addition to that - they leave behind orders they had but were unable to fill. These orders they will be defended with even more buying or selling (if they need to), and this is the premise for a rally and pullback or a drop to pullback.
Now, visualise a 1-2 Elliott Wave move. Why do you think 2 often comes back so deep?
What would you expect the move from 2-3 to do?
Powerful push, yes?
In this image, the move that created demand is simply the opposing colour candle before the power play. The significant move pushed up (showing institutional involvement). Hence, a location they will likely defend.
In addition to the push up, they pushed with so much money - it created a natural gap.
This type of example doesn't always have to be a power play 1-5 up, it could be visualised on pullback moves too.
Here's a great example recently on Euro.
The demand candle 'buy before the sell" is clearly targeted on the way up. Price fails to close above it, drops, goes back to retest - sweeps and drops. If you were to zoom in you will see on smaller timeframes evidence of a Wyckoff schematic with a UTAD.
Add a volume profile there.
As the price breaks above, after it's pullback you can see an acceleration in price and of course the area has the PoC.
Back to where people go wrong.
They will see this GAP created and assume price will come back here to reject and go. However, look closer and the demand that started the move is very near that gap.
Where is the juicy liquidity? PoC is another little clue.
Let's take this to another level.
In this image I have a range, using the prior high just to give the example in this post.
We are in an uptrend = we just broke the high, we expect a Pullback. Where would that likely target?
Zoom in again. This time I have added a fixed range volume tool.
What do you know?!
Anyways, once you get a handle on the bigger picture and understand the relationships, you can zoom into any timeframe you like - the game is always the same.
Have a great week all!
Disclaimer
This idea does not constitute as financial advice. It is for educational purposes only, our principal trader has over 25 years' experience in stocks, ETF's, and Forex. Hence each trade setup might have different hold times, entry or exit conditions, and will vary from the post/idea shared here. You can use the information from this post to make your own trading plan for the instrument discussed. Trading carries a risk; a high percentage of retail traders lose money. Please keep this in mind when entering any trade. Stay safe.
S&P 500 Analysis Ahead of the Busiest Week of Earnings SeasonS&P 500 Chart Analysis Ahead of the Busiest Week of Earnings Season
Despite the fact that President Trump’s earlier decision to impose tariffs (at higher rates than expected) shook the stock markets, the S&P 500 index (US SPX 500 mini on FXOpen) could still end April without significant losses (currently trading less than 2% below the month’s opening level) or even achieve a positive result.
According to media reports, around 180 S&P 500 companies are expected to release their quarterly earnings this week, including Apple (AAPL), Amazon (AMZN), Coca-Cola (KO), Eli Lilly (LLY), Meta (META), Microsoft (MSFT), and Chevron (CVX).
The share prices of these major companies — some of the largest by market capitalisation — could have a substantial impact on the S&P 500 index chart (US SPX 500 mini on FXOpen), given that their combined weight accounts for approximately a quarter of the index calculation.
Technical Analysis of the S&P 500 Chart
Based on the key price actions marked on the chart, we can identify a descending trend channel for the US stock market, which has been in effect since mid-February.
At the same time, the price has:
→ moved into the upper half of this channel, reaching its upper boundary;
→ found support around the median line (as evidenced by the price action on 21 April).
These are bullish signs, reinforced by the aggressive nature of the rebound from the psychological 5,000-point level, which acted as significant support in the first few days following the tariff announcement. Bears may still see an attractive opportunity to attempt to resume the downward momentum of the S&P 500 index (US SPX 500 mini on FXOpen), but will the fundamental backdrop support such a move?
From an optimistic perspective, sharp impulses driven by corporate news could lead to a breakout above the upper boundary of the red channel. This would likely be facilitated by important announcements (particularly from senior officials in the US, China, and Europe) regarding de-escalation of the tariff situation.
This article represents the opinion of the Companies operating under the FXOpen brand only. It is not to be construed as an offer, solicitation, or recommendation with respect to products and services provided by the Companies operating under the FXOpen brand, nor is it to be considered financial advice.

S&P500: Rebound or Bull Trap?Over the past week, the S&P500 weekly chart showed a key technical signal: the formation of a bullish engulfing.
This pattern emerged after several weeks of strong monthly bearish pressure, suggesting a potential reversal attempt or, at the very least, a technical rebound.
Analyzing the key levels, the price reacted inside a major demand area (visible on the monthly timeframe), positioned between 5,450 and 5,500 points.
The reaction from this zone reinforces the validity of the engulfing and suggests the market could now aim for the first resistance targets around 5,600 - 5,650.
Further upside targets are located at 5,837 and 6,023, previously marked as high-confluence zones.
From an institutional positioning perspective, the latest COT Report (April 22, 2025) reveals interesting developments:
Commercials (big players) increased their long contracts by +22,226 units, showing strong interest in upside protection.
Non-Commercials (speculators) also increased their longs (+8,754), but added even more to their shorts (+20,667).
The Net Positioning for Non-Commercials remains negative but has stabilized at less extreme levels compared to March, suggesting a possible phase of accumulation or preparation for a sentiment shift.
📊 The Net Positions chart shows a reduction in net short pressure — a warning sign for those still heavily short.
Summary:
The weekly engulfing is a technical signal not to underestimate.
We are trading within a strong monthly demand zone.
COT data suggests a decrease in bearish pressure, although not yet a full sentiment reversal.
However, caution is necessary: a firm break below 5,450 would invalidate the bullish signal and reopen the path toward corrections at 5,200 and 5,000.
Current Strategy:
Slight bullish bias above 5,500.
Short-term target: 5,600 → 5,650.
Next targets: 5,837 and 6,023.
Invalidation level: weekly close below 5,450.
Watching the price action around key resistance levels will be crucial: the market will decide whether this rebound consolidates or becomes just a trap for new buyers.

SPX500 I Bearish Drop Based on the H4 chart analysis, we can see that the price has just reacted off our sell entry at 5522,70, which is an overlap resistance.
Our take profit will be at 5371.29, an overlap support level.
The stop loss will be placed at 5685.38, which is an overlap resistance level.
High Risk Investment Warning
Trading Forex/CFDs on margin carries a high level of risk and may not be suitable for all investors. Leverage can work against you.
Stratos Markets Limited (tradu.com):
CFDs are complex instruments and come with a high risk of losing money rapidly due to leverage. 63% of retail investor accounts lose money when trading CFDs with this provider. You should consider whether you understand how CFDs work and whether you can afford to take the high risk of losing your money.
Stratos Europe Ltd (tradu.com):
CFDs are complex instruments and come with a high risk of losing money rapidly due to leverage. 63% of retail investor accounts lose money when trading CFDs with this provider. You should consider whether you understand how CFDs work and whether you can afford to take the high risk of losing your money.
Stratos Global LLC (tradu.com):
Losses can exceed deposits.
Please be advised that the information presented on TradingView is provided to Tradu (‘Company’, ‘we’) by a third-party provider (‘TFA Global Pte Ltd’). Please be reminded that you are solely responsible for the trading decisions on your account. There is a very high degree of risk involved in trading. Any information and/or content is intended entirely for research, educational and informational purposes only and does not constitute investment or consultation advice or investment strategy. The information is not tailored to the investment needs of any specific person and therefore does not involve a consideration of any of the investment objectives, financial situation or needs of any viewer that may receive it. Kindly also note that past performance is not a reliable indicator of future results. Actual results may differ materially from those anticipated in forward-looking or past performance statements. We assume no liability as to the accuracy or completeness of any of the information and/or content provided herein and the Company cannot be held responsible for any omission, mistake nor for any loss or damage including without limitation to any loss of profit which may arise from reliance on any information supplied by TFA Global Pte Ltd.
The speaker(s) is neither an employee, agent nor representative of Tradu and is therefore acting independently. The opinions given are their own, constitute general market commentary, and do not constitute the opinion or advice of Tradu or any form of personal or investment advice. Tradu neither endorses nor guarantees offerings of third-party speakers, nor is Tradu responsible for the content, veracity or opinions of third-party speakers, presenters or participants.

S&P 500: Key Levels and Potential ScenariosThis analysis of S&P500 will explore both bullish and bearish scenarios, incorporating key levels and considering possible market and crowd psychology.
Bullish Scenario: Potential Uptrend Resumption
From a bullish perspective, if the S&P 500 maintains a position above the 5482 level, it could suggest a potential end to the current correction and a resumption of the major uptrend. A hold above 5482 might reinforce bullish sentiment, encouraging further buying activity, as traders may view this as confirmation of renewed strength. The index could then potentially retest the 5801 level, where it's possible that the index may encounter resistance on the first attempt. A successful break above 5801 would then open the path towards the 6135 zone, which represents a key upside target.
Bearish Scenario: Potential Retest of Support Zones
Conversely, if the S&P 500 fails to hold above the 5482 support level might trigger increased selling pressure, as traders liquidate positions. The index could then potentially retest the 5092 to 4833 support zone. This zone represents a critical area where buyers may step in, but a break below it would signal further weakness.
Concluding Remarks
In conclusion, the S&P 500's price action around the identified key levels will be crucial in determining its short- to medium-term direction. A sustained hold above 5482 could favor a bullish continuation towards 5801 and potentially 6135, while a break below 5482 might lead to a retest of the 5092 to 4833 support zone.

Will the EUR/USD find support and rally or give up it's run?In this video I go over EUR/USD, GBP/USD, USD/JPY, NVDA & SPX.
With an overall bearish outlook on the U.S. Dollar, I'm watching for support to hold above 1.1200 on the EUR/USD in order to continue the rally.
Although a pullback was expected after an aggressive up move over the span of 3 weeks, this will be interesting with a good amount of economic data set to release beginning on Tuesday.
We'll see if Bulls hold up or if Bears decide to show some strength.
As always, Good Luck & Trade Safe.

S&P 500 Daily Chart Analysis For Week of April 25, 2025Technical Analysis and Outlook:
In this week's trading session, the Index did steady to higher prices, distancing itself from the rendered obsolete Mean Resistance level of 5455 and targeting the next significant mark identified as Outer Index Rally 5550. This trend lays the groundwork for a continued upward movement; however, there is also a considerable risk of a sharp pullback to the Mean Support level of 5370 after reaching the Outer Index Rally at 5550.
Contrariwise, it is essential to acknowledge the possibility of upward momentum continuation resulting in meeting the primary target Outer Index Rally 5550 by challenging the Mean Resistance of 5672 and extending toward additional levels: Mean Resistance 5778 and Outer Index Rally 5945.

$SPELL/USDT Breakout Alert!🚀 $SPELL/USDT Breakout Alert!
SPELL has broken out of a symmetrical triangle on the 4h chart, confirming a strong bullish move!
• Entry: CMP
• TP: 0.0008612
• SL: 0.0005143 for risk management.
Momentum looks after consolidation — eyes on continuation if volume stays strong!
DYOR, NFA

S&P 500 E-mini Futures: Bullish Momentum Meets Key Resistance📈 Technical Analysis: S&P 500 E-mini Futures (ES1!) – April 2025
🚀 Market Structure & Price Action for US500
The daily chart shows the S&P 500 E-mini Futures in a bullish recovery after a significant correction. The recent rally has pushed price back toward previous swing highs, an area likely to contain resting buy-side liquidity. This move suggests that the market is currently in a markup phase, but is now approaching a critical resistance zone where profit-taking and counter-trend activity may emerge.
🧠 Wyckoff Perspective
From a Wyckoff methodology standpoint, the recent price action resembles a classic accumulation-to-markup transition. The sharp selloff in March and early April appears to have formed a selling climax (SC) followed by an automatic rally (AR) and a secondary test (ST). The current advance could be interpreted as a sign of strength (SOS), but the proximity to previous highs raises the risk of an upthrust (UTAD) or a bull trap if supply emerges.
🌊 Liquidity & Potential Pullback
As price trades into the prior highs, it is likely "eating" buy-side liquidity—triggering stops and breakout orders. This process often leads to a liquidity sweep, where price briefly exceeds resistance before reversing as large players offload positions. If the market fails to sustain above these highs, a pullback or even a reversal could be initiated, especially if volume and momentum wane.
🌐 Market Sentiment & Fundamentals
Current sentiment remains cautiously optimistic, with the S&P 500 E-mini trading above 5,500 and recent sessions showing resilience despite mixed earnings and macroeconomic uncertainty. The broader market is supported by expectations of stable Fed policy and robust corporate earnings, but there are persistent concerns about inflation and global growth. According to Markets Insider, the ES futures are up 0.59% recently, reflecting a positive but not euphoric tone. However, as noted by Investing.com, there are signs the market could be setting up for a reversal if bulls fail to maintain momentum.
🛠️ Trade Ideas
🟢 Bullish Scenario: If price breaks and holds above the previous highs with strong volume and closes, consider a long entry targeting the next psychological resistance (e.g., 5,700–5,800). Place stops just below the breakout level to manage risk. This would confirm continued demand and a potential extension of the markup phase.
🔴 Bearish Scenario: If price fails to hold above the highs and forms a reversal pattern (e.g., bearish engulfing, upthrust), look for a short entry targeting the first support zone (e.g., 5,300–5,200). Stops should be placed above the failed breakout. This would align with a Wyckoff upthrust after distribution and a likely liquidity sweep.
⚠️ Disclaimer
This analysis is for informational purposes only and does not constitute financial advice. Trading futures involves significant risk and may not be suitable for all investors. Please conduct your own research and consult with a licensed financial advisor before making any trading decisions.

Could The Stock Market Crash? - WARNING 🚨MartyBoots here , I have been trading for 17 years and sharing my thoughts on SPX .🚨
🚨 SP:SPX Could It Crash?🚨
Lets look into it deeper, very interesting chart but also a dangerous one. Need to see buyers soon or this is could be worse than people expect. 5-10% drop minimum and extreme bear could drop 40% total🚨
Watch video for more details

WolfIn a premature stage but if the price sustain at the level of around 3$ then the potential targets around 3.5 and above.

Bearish WXY Model Forming at Key Resistance – Caution at the TopSP:SPX just crossed the Monthly High, but the structure resembles a bearish WXY correction, and we’re now approaching critical levels.
🔍 Key Levels to Watch:
5481–5572: Weekly FVG resistance + 61.8% Fib Extension – potential top of the rally.
5293: The 50% retracement from the Apr 20 low – a break below confirms the bearish WXY and opens the door to new lows.
📌 Scenario Outlook:
✅ Bullish case: Room for upside toward 5685–5750, but only if we close above 5572 Weekly to invalidate the FVG.
⚠️ Bearish case: Current price action aligns with divergence (as seen with DJI) + WXY model. Caution advised — rallies may be fading.
💬 Chart attached shows the WXY structure forming with key divergences.

SPY/QQQ Plan Your Trade For 4-25 : Inside Breakaway patternToday's Pattern is an Inside Breakaway pattern. I suggest this pattern could play a pivotal role in how the markets setup for the May 2 Major Bottom pattern I'm expecting.
You'll see in this video how any move to the upside could present a broadening of the consolidation range - resulting in even bigger price volatility going forward.
Yet, I believe the markets will stall and roll a bit downward/sideways today. Possibly resulting in a move back into the lower consolidation range as we ROLL off resistance.
As I suggested last weekend, I see no reason to assume the markets are "cleared for take-off" yet. Tariffs and political concerns are still driving uncertainty.
I think we are seeing Q1 earnings inflate the markets while the fundamental elements of the global markets are still somewhat unsettled.
I urge traders to HEDGE any open trades going into this weekend. If the markets don't make any clear moves today, hedge any positions you hold into next week.
Gold & Silver are showing signs of minor panic selling. I see that as traders wanting to retest the $3300/$33 levels for Gold/Silver.
I still believe Gold/Silver will skyrocket higher. But, probably not going to happen today.
BTCUSD is making an interesting move higher. Potentially invalidating the previous EPP pattern and/or setting up a very broad consolidation range.
It will be interesting to see how BTCUSD continues to trend over the next few months.
Remember, I'm hopefully helping all of you find ways to improve your trading and find better results.
Get some..
#trading #research #investing #tradingalgos #tradingsignals #cycles #fibonacci #elliotwave #modelingsystems #stocks #bitcoin #btcusd #cryptos #spy #gold #nq #investing #trading #spytrading #spymarket #tradingmarket #stockmarket #silver

S&P 500 tests key resistance as trade uncertainty continuesTrump continues to say positive things - just now suggesting that they are very close to a deal with Japan on tariffs. But it is China where the bulk of uncertainty lies. He has been quite upbeat this week, but China continues to push back against the optimism.
European indices extended their gains, buoyed by the previous day’s upbeat mood, while US futures have given up their earlier gains. The shift likely linked to an interesting interview US President Donald Trump gave to Time Magazine.
While Trump claimed Chinese President Xi had personally rung him — and insisted that negotiations with Beijing were progressing — it was his remark that he’d consider “50% tariffs a year from now” to be a success that seemed to spook investors. Unsurprisingly, that struck a more hawkish tone, nudging some traders to lock in profits.
Earlier in the session, risk appetite had been given a lift after reports surfaced that China was weighing tariff exemptions for select US imports. This, combined with upbeat comments from Trump the day before and a solid set of earnings from Alphabet, helped extend the rally in equities.
Gold, meanwhile, gave back some ground — dipping below the $3,300 mark — as safe haven demand cooled in response to the renewed optimism. Yet, beneath the surface, caution remains palpable. Trump’s off-the-cuff comment about 50% tariffs a year from now served as a stark reminder that nothing is set in stone, and that the trade saga is far from over.
As such, while some of the worst risk-off flows may be behind us, it’s far too soon to declare an end to the market turmoil. A period of consolidation — both in equities and gold — may now be on the cards.
Meanwhile the S&P 500 has entered a key area of resistance between 5490 to 5550 area. A bearish trend line also comes into play. A clean break should be positive from a short-term point of view, while a sharp rejection is what the bears would be looking for.
By Fawad Razaqzada, market analyst with FOREX.com

S&P500 INTRADAY resistance at 5510Global Trade & Geopolitics
China may suspend steep tariffs on some U.S. imports, like medical equipment and ethane, to ease pressure on key industries—hinting at a more pragmatic trade stance.
Apple plans to shift most U.S. iPhone production to India by late next year, while Walmart is helping Chinese exporters sell locally—both reflecting efforts to reduce reliance on China.
U.S.-Russia-Ukraine: The U.S. will push for Russia to recognize Ukraine’s right to its own military in any peace deal. However, Trump suggests Ukraine may have to cede some territory. Meanwhile, reduced U.S. aid is increasing Ukraine’s exposure to Russian cyberattacks.
Market Impact:
Watch for shifts in trade-sensitive sectors, supply chain plays (especially in tech), and defense stocks as geopolitical risk evolves.
Key Support and Resistance Levels
Resistance Level 1: 5510
Resistance Level 2: 5660
Resistance Level 3: 5790
Support Level 1: 5110
Support Level 2: 4950
Support Level 3: 4815
This communication is for informational purposes only and should not be viewed as any form of recommendation as to a particular course of action or as investment advice. It is not intended as an offer or solicitation for the purchase or sale of any financial instrument or as an official confirmation of any transaction. Opinions, estimates and assumptions expressed herein are made as of the date of this communication and are subject to change without notice. This communication has been prepared based upon information, including market prices, data and other information, believed to be reliable; however, Trade Nation does not warrant its completeness or accuracy. All market prices and market data contained in or attached to this communication are indicative and subject to change without notice.

April 25, 2025 - Trump’s Tango, Tech, and Insider DramaHello everyone, it’s April 25, 2025. We’re closing in on Trump’s 100-day mark back in the White House, and if there’s one word to sum up his impact on markets: chaos. With 137 executive orders signed already, he’s turned global markets into a high-stakes rollercoaster though this week saw signs of recovery, confidence remains fragile, and volatility is still running the show.
The main trigger? You guessed it: Trump and his tariff diplomacy. After weeks of U-turns, threats, and NYSE:TWTR meltdowns, he’s finally announced that talks with China have begun. That was enough to send the AMEX:SPY up 2%, pull the CME_MINI:NQ1! out of correction territory (+2.74%), and ignite a 5.63% jump in the Philadelphia Semiconductor Index, even though it’s still miles below its all-time high.
OANDA:XAUUSD is sitting at $3,332, BLACKBULL:WTI hovers around $63.21, and INDEX:BTCUSD has skyrocketed to $93,200. Not bad for a week that started in total disarray.
Now here’s where things get fishy: US indices started climbing before Trump’s announcement—classic “somebody knew something.” Insider trading? Just your average Thursday. And while Trump claims talks are underway, the Chinese side played coy, denying any ongoing negotiations. Either someone’s lying, or the talks are happening over dim sum in DC.
Beyond geopolitics, NASDAQ:GOOG crushed earnings expectations and added a juicy dividend and GETTEX:70B in buybacks, exploding 6% after-hours. Meanwhile, NASDAQ:INTC flopped—flat profits, poor outlook, and a CEO trying to turn cost-cutting into a growth story. The market wasn’t buying it: down 5.7% after-hours.
NYSE:NOW , though, is living its best life. Strong results, AI momentum, and federal contracts boosted shares 15%. Other names like NASDAQ:PEP , NYSE:PG , and NASDAQ:AAL warned on the future thanks to—you guessed it—political and economic uncertainty.
On the macro front, ECONOMICS:USIJC (US jobless claims) ticked higher, inflation seems to be cooling, and if next week’s PCE and employment data confirm the slowdown, the Fed might just blink and cut rates in May. Market hopes are pinned on Powell holding steady—unless, of course, Trump decides to live-tweet through it.
Futures are up 0.37% ( CME_MINI:ES1! ) this morning, signaling optimism—possibly misplaced—in Trump’s “friendly” overtures toward China. Let’s just say we’re one golf game away from another market tantrum.
Enjoy your weekend, stay alert, and cross your fingers for a quiet Sunday tweet-wise.

S&P500 Index End of Day Trend AnalysisS&P 500 Index Outlook:
The index may experience bearish momentum starting around April 25th or 28th, with key support at 5160. If this level holds and bearish confirmation does not emerge, the bullish trend is expected to continue toward the target of 6109.
Traders should wait for a confirmed short signal before considering bearish positions. Otherwise, the ongoing bullish momentum is likely to persist. The MastersCycle indicator has signaled a buy, with a suggested stop-loss at 5100.
Disclaimer: This is a personal market view. Traders are encouraged to rely on their own technical analysis and always trade with an appropriate stop-loss.

SPX on threshold of bullish breakout? I am cautiously bullishNations may be lining up to kiss Trump's a??? but SPX has come to kiss a confluence of trendline resistance as well as POC
Also markets we approaching month end. You only need to look at the past month ends and see what happens to the price, yes they tend to reverse very often if not always, specially if the prices are below 200 ema as it is now.
I would be watching how the market behaves next week. Soft economic data are pointing to weaker economy and the underlying problem of highly leveraged Hedge Funds remain. I wonder if they begin to deleverage some more at this level.
Any future decline would be a good entry point
