SPY/QQQ Plan Your Trade Update : EPP Flag Setup CompleteI created this video to highlight the current EPP Flag setup in the SPY/ES.
It is my opinion that the market are about ready to ROLL OVER into a downward trend because of this current EPP setup.
Once the FLAG forms (in this case a BULLISH FLAG), the next phase is a BREAKDOWN INTO CONSOLIDATION.
It is my belief the current FLAG will prompt a breakdown in price - moving into a lower consolidation range.
I'm highlighting this EPP pattern to help everyone learn how to use them more efficiently.
Get ready. If I'm right, we're going to see a big move downward over the next 2-4+ days.
Get some...
#trading #research #investing #tradingalgos #tradingsignals #cycles #fibonacci #elliotwave #modelingsystems #stocks #bitcoin #btcusd #cryptos #spy #gold #nq #investing #trading #spytrading #spymarket #tradingmarket #stockmarket #silver
S&P 500 (SPX500)

SPY/QQQ Plan Your Trade for 4-24 : Carryover PatternToday's Carryover pattern suggests we'll see similar price action today to what we saw yesterday.
We will very likely see a little support in early trading today, followed by a moderate meltdown-type trend.
I'm not expecting much to happen today - but we could get some news or other data that may prompt some type of bigger move in the markets.
Yesterday evening, I shared an "Update" video with everyone. In that video, I highlighted some of my active trades.
I've gotten a few messages from followers asking if I can share more data related to my trades. I'm sorry, but that won't happen in these FREE Plan Your Trade videos.
I shared some of my trades yesterday to highlight how I had moved into a moderate Short/PUT position, trying to stay ahead of the bigger market trend.
In other words, I'm not chasing the nickels. I'm setup to try to profit from the DOLLARS.
Gold and Silver may stay somewhat muted over the next 48 hours. But, I do expect them to try to melt upward.
BTCUSD appears to be setting up a BULL TRAP. I, personally, don't trust this upward price move because it is counter to the EPP price structure. I could be wrong.
But right now, I just don't trust the upside move in BTCUSD, knowing the SPY/QQQ should move into a deeper MAJOR LOW in early May.
Again, these videos are designed to help you build your skills and find your own style of trading.
I really do hope all of you are benefiting from my continued work to deliver these videos.
GET SOME...
#trading #research #investing #tradingalgos #tradingsignals #cycles #fibonacci #elliotwave #modelingsystems #stocks #bitcoin #btcusd #cryptos #spy #gold #nq #investing #trading #spytrading #spymarket #tradingmarket #stockmarket #silver

S&P500 INTRADAY resistance at 5510Stocks are pulling back after Wednesday’s rally, pressured by renewed trade tensions. China stated that no deal talks are underway, and Treasury Secretary Scott Bessent expressed scepticism over resolving the trade dispute. US futures slipped, the dollar weakened, and gold rose as investors sought safety.
Jefferies strategist Christopher Wood warned that US equities, Treasuries, and the dollar may face further downside, noting the market has likely peaked. Deutsche Bank also trimmed its S&P 500 target, citing the negative impact of ongoing tariffs on US companies.
It’s a packed earnings day: PepsiCo, Procter & Gamble, and American Airlines report before the open, while Alphabet and Intel are set to release results after the close.
Key Support and Resistance Levels
Resistance Level 1: 5510
Resistance Level 2: 5660
Resistance Level 3: 5790
Support Level 1: 5110
Support Level 2: 4950
Support Level 3: 4815
This communication is for informational purposes only and should not be viewed as any form of recommendation as to a particular course of action or as investment advice. It is not intended as an offer or solicitation for the purchase or sale of any financial instrument or as an official confirmation of any transaction. Opinions, estimates and assumptions expressed herein are made as of the date of this communication and are subject to change without notice. This communication has been prepared based upon information, including market prices, data and other information, believed to be reliable; however, Trade Nation does not warrant its completeness or accuracy. All market prices and market data contained in or attached to this communication are indicative and subject to change without notice.

US500 - Will the stock market go up?!The index is located between the EMA200 and EMA50 on the four-hour timeframe and is trading in its descending channel. If the index moves down towards the specified demand zone, we can look for the next Nasdaq buying positions with an appropriate risk-reward ratio. The channel breakdown and the index entering the supply zone will provide us with its next selling position.
The chief economist at Citigroup has stated that the imposition of tariffs in the United States constitutes a stagflationary shock to the economy. According to his estimates, there is a 40% to 45% chance of a recession. It is expected that GDP will increase in the second quarter, as consumers rush to make purchases ahead of the new tariffs. However, the most significant negative impact on U.S. economic growth is projected to unfold in the second half of the year.
You may have noticed that recent economic statistics are no longer moving markets. The reason is simple: markets are forward-looking and trade on expectations rather than past data. Economic figures reflect what has already occurred, while market pricing focuses on what lies ahead.
At this stage, current data has yet to fully reflect the impact of tariffs and trade tensions. Even if weaker numbers emerge, markets may have already priced in the potential resolution of the trade war and an eventual recovery.
Experienced traders understand that today’s developments are already factored into prices. What matters now is the outlook for the coming months—the real driver of market direction.
Ryan Petersen of Flexport noted yesterday that, three weeks after the U.S.imposed heavy tariffs on Chinese imports, bookings for ocean freight containers have dropped more than 60% industry-wide. He explained that the U.S. imports around $600 billion worth of goods annually from China, with those items valued at approximately $2 trillion at the retail level.
He stated that the first ships carrying goods fully subject to the new tariffs arrived on Monday, and shipping volumes are expected to decline in the coming weeks. However, due to high inventory levels, the impact on the retail sector may be delayed.
Petersen also expressed concern that a potential rollback of tariffs could introduce a new set of challenges. With ships currently being repositioned globally, a sudden wave of new orders could disrupt logistics networks—especially if markets perceive the suspension of tariffs as only temporary.
In my view, no one really knows how this situation will evolve, as a large portion of imports consists of intermediate goods and components used in final products. My guess is that this could lead to a surge in transshipment and even smuggling, though it could just as easily echo the unexpected consequences seen during the COVID era. We are truly venturing into uncharted territory.
Petersen concludes: “This is a strange era for global logistics, as we must simultaneously prepare for the unimaginable—like full U.S. self-sufficiency—while also planning for a return to something closer to normal trade relations.”

GOLD Goes "Buy The Dip", Following 200-hour SMA Major SupportGold prices have experienced significant volatility over the last days, with conflicting reports on the current trend. According to some sources, gold prices have increased, with spot gold reaching $3,500 per troy ounce, new all the history high on Tuesday, April 22, 2025.
The $3,500 milestone has sparked increased interest from investors and market analysts, meaning that Gold spot doubled in price over the past 5 years, 3rd time in history ever.
Despite the short-term volatility, gold has shown a strong performance since the beginning of 2025, with an increase of approximately 30-35% year-to-date. Market analysts remain bullish on gold, with some forecasting prices to reach $ 4'000 per ounce in the near term.
The main 1-hour Gold spot OANDA:XAUUSD graph indicates on 200-hours SMA technical support, with further upside opportunity due to forming on the chart descending triangle (flat bottom/ descending top) breakthrow.
--
Best #GODL wishes,
💖 Your Beloved @PandorraResearch Team

SP500 remains very bearish overall📈 In my previous post, I highlighted the confluence support zone and the potential for a bounce — and we got it. SP500 rallied around +10% off the lows.
But let’s not get too comfortable...
❓ I s the worst behind or is this just a trap before the next leg down?
From my perspective, the correction is not over.
The current bounce looks more like a bear market rally than a true reversal.
📉 Why I expect another drop:
1. Technically, as long as SP500 is trading below 5500-5600 zone, the structure remains bearish
2. Fundamentally, the backdrop hasn’t improved — if anything, it’s getting worse
3. Price is approaching a major resistance zone, which I plan to sell into
📌 My Plan:
I’m watching this zone for signs of weakness.
If momentum fades, I’ll look to short, targeting at least 5k, potentially even a new local low.
Disclosure: I am part of Trade Nation's Influencer program and receive a monthly fee for using their TradingView charts in my analyses and educational articles.

US500 Day Trade Setup: Liquidity Pools, Gaps & What’s Next?The US500 (S&P 500) 4-hour chart recently showed a gap up, followed by a strong move into the previous range highs. This price action likely triggered buy stops and tapped into buy-side liquidity above the prior swing highs. After this liquidity sweep, the market has pulled back and is now consolidating just above a visible gap, which sits slightly below the current price level.
From a Wyckoff perspective, this resembles an upthrust after distribution, where price runs stops above resistance before reversing. The current pullback suggests a potential test of the gap area, which often acts as a magnet for price, especially if there’s unmitigated liquidity left behind.
Using ICT (Inner Circle Trader) concepts, the recent move above the range high can be seen as a raid on buy-side liquidity, followed by a retracement. The gap below current price represents an imbalance, and ICT traders often look for price to revisit such inefficiencies before resuming the trend.
🌐 Fundamental & Sentiment Backdrop
Recent data shows the S&P 500 has experienced a sharp correction in April, with a monthly drop of about 5.75% from the previous month, but it remains up 6.8% year-over-year (YCharts). The market has been volatile, with sentiment shifting due to macroeconomic concerns, including renewed trade tensions (notably new tariffs), a mixed earnings season, and questions about the Federal Reserve’s next moves (IG).
Wall Street analysts have recently revised their year-end targets lower, citing increased risks from tariffs and slowing earnings growth (Yahoo Finance). The VIX is elevated (28.45), and the put/call ratio is above 1, indicating heightened hedging and caution among market participants (YCharts).
🏦 Wyckoff & ICT Concepts in Play
🏗️ Wyckoff: The recent rally into the highs and subsequent pullback fits the upthrust after distribution narrative. If the market fails to reclaim the highs, a move back into the gap (potentially as a sign of weakness) is likely.
💧 ICT: The gap below current price is a clear area of interest. If price trades down to fill this gap, watch for a reaction—either a bounce (if demand steps in) or a continuation lower if the gap fails to hold.
💡 Day Trade Idea (Not Intra-day)
Scenario: If price trades down to fill the gap just below the current level (around 5,300–5,320), monitor for a bullish reaction (such as a strong daily close, a bullish order block, or a clear rejection wick).
Trade Plan:
🕵️♂️ Wait for price to fill the gap and show a bullish daily signal.
🎯 Enter a day trade long at the next day’s open if confirmation is present (e.g., a bullish daily candle close or a break above the previous day’s high).
🛑 Place a stop loss just below the gap or the most recent swing low.
📈 Target the previous high near 5,400 for a day trade, or consider scaling out if momentum continues.
Alternative: If price fails to hold the gap and closes below it on the daily chart, consider a day trade short the following day, targeting the next liquidity pool below (e.g., 5,200).
⚠️ Disclaimer
This analysis is for educational purposes only and does not constitute financial advice. Trading involves risk, and you should do your own research or consult with a professional before making any trading decisions. Past performance is not indicative of future results.

SPY/QQQ Plan Your Trade Update For 4-23 : Rally-111 PatternToday's pattern really showed up pre-market.
Where was the rally today? It happened before the US markets opened for business.
The SPY/QQQ had already moved up into my upper resistance area on strong buying overnight.
I knew I had to run my father around most of the day, so I booked my profits this morning and tried to catch one little SPY rally (that didn't work out).
So, I started taking some positions for next week's potential downtrend, and I thought, "How much risk am I taking on these trades if the markets continue to move upward?"
I realized I would be taking about $1000 to $1400 in total risk, but my expiration date is near May 16. So my target for any profit really needs to be before May 10th or so.
If the markets do what I expect, I'll be sitting back, watching my profits grow as the markets trend downward into my May 2 Major Bottom (I hope).
I created this video to highlight the now partially confirmed inverted EPP pattern that setup the Ultimate High in early trading today.
Now that we've completed the inverted EPP pattern, we should be looking for the ES/SPY/QQQ to move downward, shift into a sideways/upward price flag. Then, break down into the new Consolidation phase.
Essentially, if my EPP patterns play out well, I timed my move away from longs/calls and into shorts/puts almost perfectly. Now, I just need to sit back and wait for the markets to make a move.
This is what trading is all about. You can't kick the markets to do what you want them to do. You have to learn to take what the markets give you and fall in line with market trends.
When you do that well, profits start to fall into your lap (if you are patient).
Follow along as I break down these market trends and learn how to develop your own skills.
GET SOME.
#trading #research #investing #tradingalgos #tradingsignals #cycles #fibonacci #elliotwave #modelingsystems #stocks #bitcoin #btcusd #cryptos #spy #gold #nq #investing #trading #spytrading #spymarket #tradingmarket #stockmarket #silver

S&P 500 | SPX500USD: Bulls Find Support — But Is It Enough?SPX500USD 12H TECHNICAL ANALYSIS 🔍
OVERALL TREND
📈 UPTREND (Tentative) — Market structure appears to be attempting a reversal from a recent pivot low. However, the macro trend remains under pressure unless price clears the key resistance range above 5,950.
📉RESISTANCE
🔴 6,152.5000 — PIVOT HIGH | Dynamic Resistance Level
🔴 6,086.2943 — SELL ORDER II
🔴 5,952.1652 — SELL ORDER I
📊ENTRIES & TARGETS
🎯 5,884.4400 — EXIT BUY | TP 4
🎯 5,640.5683 — BUY ORDER | TP 3
🎯 5,482.3500 — BUY ORDER | TP 2 | Mid-Pivot
🎯 5,254.5432 — BUY ORDER | TP 1
📈SUPPORT
🟢 5,021.6218 — BUY ORDER
🟢 4,879.2150 — BUY ORDER II
🟢 4,812.2000 — PIVOT LOW | Dynamic Support Level
📊OSCILLATOR SUMMARY
🧭 RSI (14): 51.98 — Neutral
📉 MACD Level: -41.34 — Buy Bias Forming
🚀 Momentum (10): -36.21 — Positive Divergence Developing
📊 ADX (14): 21.08 — Early Trend Formation
📉 Awesome Oscillator: -87.21 — Bearish but Flattening
🧮MOVING AVERAGE SUMMARY
✅ 10/20/30 EMA & SMA — All Showing Buy Signals
❌ 50/100/200 EMA & SMA — Still Bearish, Suggesting Long-Term Pressure
📊 VWMA (20): 5,289.90 — Bullish Price Reaction Above VWMA
📏 Ichimoku Base Line: 5,158.19 — Neutral, Needs Further Validation
🤓STRUCTURAL NOTES
Current price is battling between 5,300–5,400 resistance range — a break and close above 5,482 could trigger further upside
Significant bullish reversal candle formed near the last pivot low at 4,812
Volume profile suggests re-accumulation; price attempting to reclaim 5,300 structure
Momentum indicators show signs of shifting bullish, but not yet in strong confirmation territory
TRADE OUTLOOK 🔎
📈 Bullish bias above 5,254 with targets at 5,482 / 5,640 / 5,884
📉 Bearish pressure reactivates if price rejects 5,482 and closes below 5,021
👀 Monitor ADX for trend confirmation — under 25 = caution; above 25 = trend validation
🧪STRATEGY RECOMMENDATION
CONSERVATIVE APPROACH (Reversal Play):
— Entry: 5,254.54
— Targets: 5,482.35 / 5,640.56 / 5,884.44
— SL: Below 5,021.62
HIGH-RISK SCALP (Resistance Fade):
— Sell Order near 5,952.16 or 6,086.29
— Targets: 5,640 / 5,482
— SL: Above 6,152.50
“Discipline | Consistency | PAY-tience™”

SPY/QQQ Plan Your Trade For 4-23 : Rally-111 PatternToday's RALLY pattern suggests the SPY/QQQ will continue to push higher, possibly breaking upper resistance near $550/493.
As I suggested in this video, I believe the upward price trend bias will continue into Friday (4-25) and suddenly shift into a BEARISH price trend/bias early next week.
The May 2-5 Major Bottom cycle low, my research predicts, will happen and should prompt a fairly strong downward price trend as we near the end of April and head into early May.
Gold and Silver will likely consolidate a bit over the next 24-48 hours. So, this is a great time to pick lower entry price levels for LONGS/CALLS.
Ultimately, I'm still expecting Gold to rally above $3750 before the end of May and attempt to target $4500++ before the end of June.
BTCUSD is moving into a potential "INVALIDATION" phase. Although I'm currently estimating the probability of that invalidation at about 20-30%, it is still a valid price trend.
I believe BTCUSD will shift into a downward price trend as the markets continue to unwind excesses through the May, July, and October lows, according to my cycles.
The big opportunity for traders over the next 48 hours is playing the upward trend bias in the SPY/QQQ - then moving into a mode of preparation for next week's breakdown/downward price trend in the SPY/QQQ.
So, play it smart. Follow the chart and don't try to be a superhero.
Play what is in front of you and prepare for the bigger price swings headed into next week and beyond.
Get some.
#trading #research #investing #tradingalgos #tradingsignals #cycles #fibonacci #elliotwave #modelingsystems #stocks #bitcoin #btcusd #cryptos #spy #gold #nq #investing #trading #spytrading #spymarket #tradingmarket #stockmarket #silver

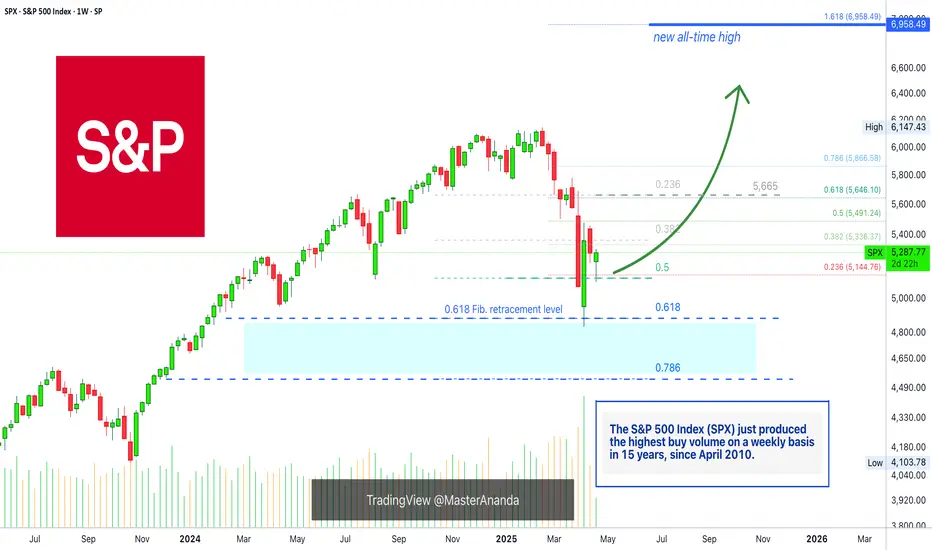
The SPX On Track To A New All-Time High In 2025 (6,958— Soon!)Do not let anybody distract you, do not allow yourself to be deceived. Know that the market is very resilient and this has been true for the longest time ever. The catastrophe that everybody is always expecting and is always due is never true. Ok, there was a correction, but that's it, from now on the market grows. That's just how it works.
Very, very strong bull markets, and the bear markets weak and short.
The S&P 500 Index (SPX) looks great right now and nothing can surpass the wisdom that comes from a chart. A chart cannot lie nor can mislead you in any way.
The charts have pure raw data, you can make your own interpretation of this data but there are no mistakes.
Here the chart shows a very strong higher low. The 0.5 Fib. retracement level was tested and it holds. Now, saying a "new All-Time High" might be speculation, but saying that prices will rise is simply how technical analysis works.
A low first pierced 0.5 and challenged 0.618 fib. The candle closed above and full green, the highest volume since 2010 and that is a clear signal that the correction reached its end.
The SPX is bullish now of course.
The next week we get a red week and this led to the present day, a higher low. A higher low is bullish and notice, the 0.618 level is no longer relevant. The correction that happened was really strong, there is absolutely no need for more.
So a strong correction developed and what comes next?
Prepare for a major rise, a new impulsive bullish wave.
The minimum target starts at 5,665. This is the resistance where the drop got started, this level needs to be tested based on TA. Depending on how this level is handled, we can extract how the market will continue to behave.
» I will make a prediction, the SPX will hit a new All-Time High in the coming months.
Thank you for reading.
Namaste.
April 22st Trade Journal & Stock Market Analysis** April 22st Trade Journal & Stock Market Analysis**
EOD accountability report: +325
Sleep: 3 hour, Overall health: tired
**Daily Trade Signals based on VX Algo System**
— 9:00 AM Market Structure flipped bullish on VX Algo X3!
10:20 AM VXAlgo NQ X1 Sell Signal
10:30 AM VXAlgo ES X1 Sell Signal
10:51 AM VXAlgo ES X1 Sell Signal
11:20 AMVXAlgo ES X1 Sell Signal (Triple signal) C+ set up
1:12 PM VXAlgo NQ X3 Sell Signal (Double X3 signal)
1:30 PM Market Structure flipped bearish on VX Algo X3!
3:00 PM Market Structure flipped bullish on VX Algo X3!
3:10 PM VXAlgo ES X1 Sell Signal (Triple signal) C+ set up


SPY/QQQ Plan Your Trade Update For 4-22 : EPP StructuresThis video highlights why the Excess Phase Peak pattern is so important for traders to understand and follow.
Imagine being able to see into the future and to be able to plan/project price action in a way that is like putting together building blocks (or Leggos).
That is what the Excess Phase Peak pattern represents for all traders.
Once you understand it and learn to use it, you'll see how it presents very clear opportunities for you to plan and execute fantastic trades in any market.
Fibonacci Price Theory, Energy Cycles, & The Excess Phase Peak patterns are really the core structures of price.
Elliot Wave is fantastic for "after the fact" type of analysis. IMO, you don't really know how the EW count is truly structured until after the current major wave structure is complete (meaning you are 2-3 waves into the new (counter-trend) structure.
Watch this video and try to think about how I'm taking the EPP patterns to learn to plan out opportunities for price based on STRUCTURE - not indicators or averages.
This is how the markets work.
Pay attention and GET SOME.
#trading #research #investing #tradingalgos #tradingsignals #cycles #fibonacci #elliotwave #modelingsystems #stocks #bitcoin #btcusd #cryptos #spy #gold #nq #investing #trading #spytrading #spymarket #tradingmarket #stockmarket #silver

S&P500 Index Intraday Trend Analysis for April 22, 2025Intraday Trend is Bullish with Resistance1 @ 5410 and Resistance2 @ 5507. Market Timing tool is bullish for the day and other indicators are in the green. Overall the S&P500 Index intraday trend is Bullish.
This is my view but not a recommendation to buy or sell. Traders are advised to do their own technical study before entering into the trade with proper risk management.

Smart investor strategyS&P 500: Percentage of Stocks Above the 20-Day Moving Average
This indicator shows the percentage of S&P 500 stocks trading above their 20-day moving average. It visually reflects short-term market strength or weakness and helps identify potential reversal points.
🔻 Sell / Open Shorts Zones:
Levels above 85–90% (marked in red) indicate an overheated market — when most stocks are trading above their short-term averages, a correction often follows.
🟢 Buy / Open Longs Zones:
Levels below 20–25% (marked in green) signal an oversold market — pressure is high, and the probability of a rebound increases.
Historically:
Each strong rally towards the 4500–4600 levels in the S&P 500 index was accompanied by overheated indicator values (85–90%).
Declines towards the 3500–3900 levels were marked by deep drops in the percentage of stocks above the 20 MA (below 20%).
Conclusion:
This indicator performs well within a sideways range and can serve as a leading signal for spotting local extremes. Currently, the reading has dropped below 15% — historically, this is a strong zone to look for long opportunities. I also showed the price of bitcoin at the moment in yellow.
Best regards EXCAVO
_____________________
Disclosure: I am part of Trade Nation's Influencer program and receive a monthly fee for using their TradingView charts in my analysis.

SPY Plan Your Trade For 4-22 : Breakaway In Counter TrendToday's pattern suggests the markets are moving in a counter-trend mode and that we may see a Breakaway type of price bar.
The current trend is Bearish. Thus, I believe the current Counter-Trend is Bullish.
As many of you already know. I picked up some Calls off the lows yesterday after noticing a complete EPP pattern (Ultimate Low) setup about 75 minutes before the end of the regular trading day on 4-21.
My opinion, overall, is that we are still stuck within a consolidation phase. But that doesn't mean we can't see the SPY/QQQ move higher (toward the upper consolidation high) or roll back downward (toward the lower consolidation low).
I do believe we are moving into a moderate upward price trend over the next 3-4+ days where price will attempt to retest the 525-535+ level on the SPY, then ROLL into a top and start a sharp downtrend.
This volatility presents an incredible opportunity for traders. Staying ahead of these trends is key to improved success.
The SPY Cycle Patterns are fairly clear. We've moved into consolidation, and the price is very volatile. The Counter Trend pattern today may setup a 3-4+ day minor rally in the SPY/QQQ.
But, ultimately, I believe the SPY/QQQ will roll downward into the May Cycle lows - just as I have been predicting for the past 45+ days.
Don't get greedy. Play the immediate trend and learn to identify the EPP patterns on 5-minute charts.
Today should be a very good day for traders.
Get some.
#trading #research #investing #tradingalgos #tradingsignals #cycles #fibonacci #elliotwave #modelingsystems #stocks #bitcoin #btcusd #cryptos #spy #gold #nq #investing #trading #spytrading #spymarket #tradingmarket #stockmarket #silver

S&P500 INTRADAY resistance retest US stock futures are pointing higher after Monday's sharp selloff. Despite the bounce, safe-haven demand remains strong — gold hit a new record, and the yen strengthened past 140/USD for the first time since September.
Donald Trump called for immediate Fed rate cuts, warning that the economy could slow without action. He argued inflation is not a concern, citing falling energy and food prices, and criticized Fed Chair Jerome Powell once again.
The US reported “significant progress” on a trade deal with India after talks between VP JD Vance and PM Modi. The roadmap aims to ease trade tensions and potentially shield India from future US tariffs.
Key Support and Resistance Levels
Resistance Level 1: 5509
Resistance Level 2: 5660
Resistance Level 3: 5787
Support Level 1: 5110
Support Level 2: 4947
Support Level 3: 4816
This communication is for informational purposes only and should not be viewed as any form of recommendation as to a particular course of action or as investment advice. It is not intended as an offer or solicitation for the purchase or sale of any financial instrument or as an official confirmation of any transaction. Opinions, estimates and assumptions expressed herein are made as of the date of this communication and are subject to change without notice. This communication has been prepared based upon information, including market prices, data and other information, believed to be reliable; however, Trade Nation does not warrant its completeness or accuracy. All market prices and market data contained in or attached to this communication are indicative and subject to change without notice.

S&P 500: This Pattern Could EmergeThey say recession is imminent...
This is how it can emerge on the S&P 500 chart
in shape of Head & Shoulders
Its visual speculation, so let's leave it here and return in 2026-2032
to check if it played out

Plan Your Trade Update For 4-21 : Waiting For The EPP SetupThis video is, hopefully, going to help many of you learn to use the Excess Phase Peak (EPP) pattern more efficiently.
For months, I've been trying to teach all of you to use this pattern to efficiently identify and trade some of the biggest price moves.
Remember, price only does TWO THINGS - TREND or FLAG.
These components are essential to the EPP pattern setup.
First, price must TREND into a peak or trough.
Second, price must pullback from the peak or trough.
Third, price must move into a SIDEWAYS/FLAGGING formation.
Forth, price must break away from the sideways/flagging formation and attempt to TREND into the new consolidation phase.
Fifth, once the new consolidation phase starts, price will trend and flag within the consolidation range for a period of time - before...
Sixth, price will attempt to break up or down to the Ultimate High/Low.
This chart of the ES/SPY will show you how I used my analysis to "front-load" my positions before the Easter holiday weekend.
I've been telling all of you the markets would likely attempt to move a little bit higher, trying to target 525-535 (if we are lucky). Then, price would roll into a topping formation and move downward towards my May 3-6th low (estimate).
Last Thursday, I decided to throw on two positions to protect against any big news that may cause the markets to collapse over the holiday weekend.
I picked up :
4 SDS CALL options @ $23 expiring on May 16
3 XLF PUT options @ $47 expiring on May 16
Both of those trades worked out perfectly this morning. I booked 2 of the XLF and 2 of the SDS for profits near 1030 AM PT. Lovely.
Next, in between phone calls and loading up my car for a short trip, I noticed a beautiful EPP pattern setting up in the ES, and that EPP pattern has already reached what I believe to be the Ultimate Low.
I tried to get into 2 SPY Call options @ $512 and held my breath to see if I timed the entry well.
NOT.
I took a $280+ loss on those two Calls.
I waited a bit longer to see what price did, and after the price setup a base below $510 on the SPY, I loaded up on two more SPY Calls @ $510 and two SSO calls @ $67 about 70-80 minutes before the end of trading.
The way I looked at it, I already had my downside trades placed from last Thursday, and I just added some upside exposure while my downside trades were profitable.
I didn't know if the SPY would rally or not, but the EPP Ultimate Low setup suggested NOW is the time to buy.
So, I kept both downside and upside trades active to protect my account overnight.
The SPY rallied into the close, and I ended up making some nice profits off that EPP Ultimate Low.
Now, I'm going to wait to see what happens tomorrow morning and try to BOOK my upside trades in profits while letting my longer-term downside trades play out into early/mid May.
This is trading. The entire purpose of trading, like I trade, is to position for the best opportunities and try to catch the GIFTS the market throws at you as often as possible.
Nothing is guaranteed, but price ultimately shows us everything we need to know.
Watch this video to see if you understand the EPP Ultimate Low that prompted me to buy my CALLS today.
If so, then you are starting to GET IT, and that is a very big step towards improving your trading skills.
Get some.
#trading #research #investing #tradingalgos #tradingsignals #cycles #fibonacci #elliotwave #modelingsystems #stocks #bitcoin #btcusd #cryptos #spy #gold #nq #investing #trading #spytrading #spymarket #tradingmarket #stockmarket #silver

S&P 500 Pullback Nearing End? Hammer + Elliott Wave Say Rebound!The S&P 500 Index ( FOREXCOM:SPX500 ) is one of the most important indexes in the financial market these days , with the cryptocurrency market and especially Bitcoin ( BINANCE:BTCUSDT ) having a strong correlation with this index .
After Donald Trump suspended tariffs on 90 countries (except China) , the S&P 500 Index started to rise and seems to have managed to break through the Resistance zone($5,284-$5,094) and is pulling back to this zone .
One of the signs of a reversa l of the S&P 500 Index can be the formation of the Hammer Candlestick Pattern , which announces the end of the pullback .
In terms of Elliott Wave theory , it seems that the S&P 500 Index is completing a corrective wave that could be in the form of a main wave 4 ( it is correcting both in time and price ).
I expect the S&P 500 Index to resume its upward trend in the coming hours, if nothing special is released , and to reach the Resistance zone($5,680-$5,500) and Yearly Pivot Point . If this happens, today's Bitcoin analysis could also be correct .
Note: In the worst case, if the S&P 500 Index touches $5,050, we should expect a further decline in the S&P 500 Index and Bitcoin.
Do you think the S&P 500 Index will return to an upward trend, or is this increase temporary?
Please respect each other's ideas and express them politely if you agree or disagree.
S&P 500 Index Analyze (SPX500USD),1-hour time frame.
Be sure to follow the updated ideas.
Do not forget to put a Stop loss for your positions (For every position you want to open).
Please follow your strategy and updates; this is just my Idea, and I will gladly see your ideas in this post.
Please do not forget the ✅' like '✅ button 🙏😊 & Share it with your friends; thanks, and Trade safe.

S&P500 - The Correction Is Over Now!S&P500 ( TVC:SPX ) is retesting massive support:
Click chart above to see the detailed analysis👆🏻
Over the past couple of days, we have been seeing a quite harsh stock market "crash" with an overall correction of about -20%. However, as we are speaking the S&P500 is already retesting a major confluence of support and if we see bullish confirmation, this drop might be over soon.
Levels to watch: $4.900
Keep your long term vision,
Philip (BasicTrading)

Tears of Liberty. Lets Make America Sell Again.Over the past decade, the U.S. stock market has significantly outperformed global stock markets excluding the United States. This divergence in returns has been one of the defining features of global investing since 2015, with U.S. equities—especially large-cap technology stocks—driving much of the outperformance.
Annualized Returns (2015–2025)
AMEX:SPY , S&P 500 Index(U.S.):
The S&P 500 delivered an average annualized return of 13.8% over the past ten years.
NASDAQ:ACWX , MSCI All World ex U.S. (Rest of World):
Global stocks outside the U.S. returned an average of 4.9% annually over the same period
Year-by-Year Breakdown
Year | SPX | World ex U.S. | U.S. Surplus
2024 23.9% 4.7% +19.2%
2023 23.8% 17.9% +5.8%
2022 -19.6% -14.3% -5.4% (!)
2021 26.6% 12.6% +14.0%
2020 15.8% 7.6% +8.2%
2019 30.4% 22.5% +7.9%
2018 -6.6% -14.1% +7.5%
2017 18.7% 24.2% -5.5% (!)
2016 9.8% 2.7% +7.1%
2015 -0.7% -3.0% +2.3%
Key Drivers of Performance
U.S. Outperformance
The U.S. market’s dominance was driven largely by the rapid growth of technology giants (such as Apple, Microsoft, Amazon, and Alphabet), which benefited from strong earnings growth, global market reach, and significant investor inflows.
International Underperformance
Non-U.S. markets faced headwinds such as multiply choking sanctions and tariffs, slower economic growth, political uncertainty (notably in Europe), a stronger U.S. dollar, and less exposure to high-growth technology sectors.
Valuation Gap
By 2025, U.S. stocks are considered relatively expensive compared to their international counterparts, which may offer more attractive valuations going forward.
Recent Shifts (2025 Trend):
As of early 2025, international stocks have started to outperform the S&P 500, with European and Asian equities seeing renewed investor interest. Factors include optimism over economic recovery in China and strong performance in European defense and technology sectors.
Long-Term Perspective
Historical Context
While the past decade favored U.S. equities, this has not always been the case. For example, during the 2000s, international stocks outperformed the U.S. following the dot-com bust.
Market Weight
The U.S. accounts for roughly 60% of global stock market capitalization and about 25% of global GDP, so its performance has a substantial impact on global indices.
Conclusion
From 2015 to 2025, the U.S. stock market delivered nearly triple the annualized returns of global markets excluding the U.S., primarily due to the outperformance of large-cap technology stocks.
While this trend has persisted for most of the decade, early 2025 shows signs of a potential shift, with international equities beginning to close the performance gap. Investors should remain aware of valuation differences and the cyclical nature of global market leadership.
The main technical chart for U.S./ ex U.S. ratio indicates the epic reversal is in progress.
