Long-Term Trend Still Intact for S&P 500The S&P 500 is falling, but despite the sharp negative moves in recent weeks, the longer-term trend remains positive.
The uptrend that began with the 2020 dip is still intact, and it appears the market has used this trend as an opportunity to buy the dips in the last two weeks.
If you zoom out from the current economic turmoil, the broader positive outlook for the U.S. market remains. U.S. stocks have become slightly more affordable following the recent selloff. If the U.S. manages to avoid a deep recession, this market pullback could create a huge opportunity for those who missed out on the 2023–2024 rally.
However, risks are notably higher now, especially with the introduction of new tariffs that are likely to weigh on growth.
As long as the long-term trend holds, downward moves into the 4600–4800 zone could offer compelling long-term buying opportunities.
S&P 500 (SPX500)

SPY/QQQ Plan Your Trade For 4-21 : Inside Breakaway PatternToday's Inside Breakaway pattern may not show up as I would expect.
An Inside Breakaway pattern suggests the OPEN will be within the Body range of the previous bar - I don't see that happening today.
The Breakaway portion of the pattern is much more likely to happen today with Gold/Silver moving much higher and BTCUSD moving slightly higher today. It appears Safe-Haven assets are THE THING right now.
That would suggest the US Dollar and US-Dollar based assed would continue to fall (move downward) as devaluation and contraction in the global economy continues to play out.
If you watched my video (posted late last night), you already know my data suggests there is almost no reason for the markets to mount a rally right now. The only thing I can see that would drive a big rally from these lows would be some incredible news that the world is immediately going back to somewhat normal in terms of GCB spending and Global Trade. I don't see that happening.
I know there are a lot of emotions related to these Tariff wars and global trade. Heck, almost anything that goes on in the world right now is full of emotions.
I urge all traders to STEP BACK. Think of the markets like an engine that runs on the quality of AIR, FUEL, SPARK, LUBRICATION, STRUCTURAL MECHANICAL PARTS, & INTAKE/OUTPUT CAPACITY.
If you start to think about the markets (global markets) as a big engine, while thinking of individual economies (by country) as smaller engines, it starts to make a little more sense (at least in my mind).
Every country runs its own engine (see the components above). If some of those components are failing, then that country's economy will falter a bit.
And that faltering economy may put additional pressure on the global economy/engine.
It takes a lot to destroy a functional economy. I mean A LOT. War, Total Destruction of government/law/society. Maybe even some type of internal conflict.
But, even then, the economy will still have roots and will fall back to core elements.
So, don't worry about all of these people telling you "the world is going to CRASH in the next 2 years because of Trump". That is highly unlikely.
What is more likely is that the world will "re-settle expectations" related to future growth and output. Strengthening economies where needed and building up the core elements of global trade/economies over many months.
So, if you are worried or don't know what to do right now, move your positions into CASH and wait it out a bit.
There will be lots of opportunities for you to pick the right time to start trading again.
There is no reason why you have to try to FORCE the markets to adhere to your wants (they never do that anyway).
Just wait it out, keep learning, and plan/time your trade efficiently.
Get some...
#trading #research #investing #tradingalgos #tradingsignals #cycles #fibonacci #elliotwave #modelingsystems #stocks #bitcoin #btcusd #cryptos #spy #gold #nq #investing #trading #spytrading #spymarket #tradingmarket #stockmarket #silver

Solid Q1 Earnings amid Tariff Turbulence Spike S&P500 VolatilityAs Q1 earnings roll in, Wall Street is digesting a rare divergence: strong fundamentals across much of corporate America paired with deepening investor anxiety. While companies are largely beating expectations, looming tariff shocks and tech sector fragility are suppressing sentiment—and returns.
Tactical positioning is crucial at times like this. This paper describes the outlook for the coming earnings season and posits options strategies that astute portfolio managers can deploy to generate solid yield with fixed downside.
Resilient Earnings Growth in the Current Season
The Q1 2025 earnings season is underway, and early results show resilient growth despite an unsettled backdrop. According to a Factset report , with about 12% of S&P 500 firms reporting so far, 71% have beaten earnings estimates and 61% have topped revenue forecasts.
Blended earnings are tracking about +7.2% year-over-year, on pace for a seventh-straight quarter of growth. However, only two sectors have seen improved earnings outlook since the quarter began (led by Financials), while most others have faced modest downgrades.
Forward guidance is also skewing cautious – roughly 59% of S&P companies issuing full-year EPS forecasts have guided below prior consensus, reflecting corporate wariness amid macro uncertainty.
Source: Factset as of 17/April
Financials Front-Load the Upside
The first wave of reports was dominated by major banks, which largely delivered strong profits and upside surprises. Volatile markets proved a boon to trading desks: JPMorgan’s equities trading revenue surged 48% to a record $3.8 billion, and Bank of America’s stock traders hauled in a record $2.2 billion as clients repositioned portfolios around tariff news.
Source: Factset as of 17/April
These tailwinds – along with still-solid net interest income – helped lenders like JPMorgan and Citigroup post double-digit profit growth (JPM’s Q1 earnings up 9% to $5.07/share; Citi’s up 21% to $1.96). FactSet notes that positive surprises from JPMorgan, Goldman Sachs, Morgan Stanley and peers have boosted the Financials sector’s blended earnings growth rate to 6.1% (from 2.6% as of March 31), making it a key contributor to the S&P 500’s overall gains.
Even so, bank executives struck a wary tone. JPMorgan’s CEO Jamie Dimon cautioned that “considerable turbulence” from geopolitics and trade tensions is weighing on client sentiment. Wells Fargo likewise warned that U.S. tariffs could slow the economy and trimmed its full-year net interest income outlook to the low end of its range. Across Wall Street, management teams indicated they are shoring up reserves and bracing for potential credit headwinds if import levies drive up inflation or dent growth.
Tech Titans Under Scrutiny
Attention now turns to the yet-to-report mega-cap tech firms, which face a very different set of challenges. Stocks like Apple, Amazon, Microsoft, and Alphabet – collectively heavyweights in the index – have been battered by the escalating trade war, eroding some of their premium valuations.
Apple’s share price plunged over 20% in early April on fears that new tariffs could jack up the cost of an iPhone to nearly $2,300, underscoring these companies’ exposure to global supply chains.
The tech sector’s forward P/E remains about 23 (well above the market’s 19), leaving little room for error if earnings guidance disappoints. With Washington’s tariff barrage and retaliatory threats casting a long shadow, Big Tech finds itself on the front line of the global trade war, suddenly vulnerable on multiple fronts. Any cautious outlook from these giants – which account for an outsized share of S&P 500 profits – could heavily sway overall forward earnings sentiment.
Market Context and Reaction
Despite solid Q1 fundamentals, equity markets have been whipsawed by macro headlines. The S&P 500 slid into correction territory, falling roughly 10% since the start of April and about 14% below its February peak, as investors de-rated stocks in anticipation of tariff fallout and a potential economic slowdown. Consumer inflation expectations have skyrocketed with risk delaying rate cuts in the near-term.
This pullback has tempered valuations somewhat – the index’s forward P/E has eased to ~19 (down from ~20 at quarter-end) – even though consensus earnings estimate for 2025 have only inched down. Notably, the high-flying “Magnificent Seven” mega-cap stocks that led last year’s rally are all sharply lower year-to-date (Alphabet –20%, Tesla –40%), a stark reversal that has dented market breadth and sentiment.
Source: Factset as of 17/April
Investors are rewarding only the strong earnings winners: for instance, Bank of America’s stock jumped over 4% after its earnings beat, and JPMorgan rose 3% on its results. Such reactions imply the market is discriminating – strong execution is being acknowledged even as the broader mood remains cautious.
Source: Factset as of 17/April
Hypothetical Trade Setup
Solid corporate performance is offset by significant macro risks, warranting a nimble and selective approach. While recent positive earnings may provide a short-term boost, downbeat sentiment and concerns over future tech earnings could limit gains.
In this uncertain environment, investors may adopt a fundamentally driven view that the S&P 500 could rise in the near term due to strong earnings. However, the upside appears limited, supporting the case for a bullish call spread.
Earnings release dates for the Super 7
With major tech firms set to report earnings in early May, investors can consider the 2nd May MES Friday weekly options. A narrow bull call spread offers a higher probability of profitability. In this hypothetical setup, the long call is at 5,250 and the short call at 5,390, resulting in a breakeven point of 5,312 at expiry. This position requires net premium of USD 315/contract (USD 62.5/index point x 5). The position returns a max profit of USD 385/contract for all strikes > 5,390 and a max loss of USD 315/contract for all strikes < 5,250.
This strategy is most successful when the S&P 500 rises slowly. A simulation of this scenario using the CME QuikStrike Strategy Simulator has been provided below.
MARKET DATA
CME Real-time Market Data helps identify trading set-ups and express market views better. If you have futures in your trading portfolio, you can check out on CME Group data plans available that suit your trading needs tradingview.com/cme .
DISCLAIMER
This case study is for educational purposes only and does not constitute investment recommendations or advice. Nor are they used to promote any specific products, or services.
Trading or investment ideas cited here are for illustration only, as an integral part of a case study to demonstrate the fundamental concepts in risk management or trading under the market scenarios being discussed. Please read the FULL DISCLAIMER the link to which is provided in our profile description.

QQQ, Weekly RSI has reached oversold territory just 4 other timeIt's also came at or near a long-term bottom.
If you're a long-biased trader looking for high-probability entries, this setup deserves your attention.
The weekly RSI just hit oversold territory — something that’s only happened 4 times in the last 10 years. Each of those times? It marked a major bottom or the start of a strong bullish trend.
We’re also bouncing near long-term horizontal support (~$420) and holding above a rising trendline that’s defined the bull market since 2018.
If price continues to hold this zone and RSI starts curling back up, I’ll be looking to go long.
Stop below $420. Reward-to-risk looks solid if momentum confirms.
Not calling the exact bottom — just positioning where the risk makes sense.

21/04/25 Weekly OutlookLast weeks high: $86,492.19
Last weeks low: $83,112.72
Midpoint: $84,802.45
Is the market finally showing its hand?
After President Trumps escalation of the tariff trade war, BTC saw huge volatility swings in line with Tradfi, the panic led to de-risking and as a result BTC hit $74,500. Then after a small bounce another revisit of the exact same area resulted in a much more substantial reversal back up into the $80K's. A double bottom and rally despite the tariff situation ongoing suggests huge support/strength in that area on the HTF, I am now satisfied that BTC has closed the area of imbalance caused by the US election pump, confirming support. This event also coincided with SPX bouncing off the 1D 200 EMA.
Since then Bitcoin has rallied back to the upper limit of the downtrend channel (see my previous posts on this structure) which also has the 4H & 1D 200 EMA placed there. For a bullrun to sustain itself these moving averages are important to maintain momentum, time spent under these MA's kill the bullish trend and weaken sentiment around the move.
Last week we saw a very tight trading range of only 4%, that is compared to 15.4% the week previous. My theory was that this compression of price around a key area (4H & 1D 200 EMA + trend channel high) leads to a much bigger impulse move, the only question was in which direction?
The minute the weekly bar closed BTC exploded above both of these MA's and out of the downtrend, so it looks like the question is answered when it comes to direction of the impulse move. The next question is, will it stick?
I do find the timing of the move somewhat suspicious as the majority of Europe are on a public holiday, could this be a MM taking advantage of thin order books? the SPX pre-market is fairly neutral and so I believe tomorrow will tell the true story of where BTC really is.

SPX500 H1 | Approaching a multi-swing-low supportSPX500 is falling towards a multi-swing-low support and could potentially bounce off this level to climb higher.
Buy entry is at 5,206.22 which is a multi-swing-low support.
Stop loss is at 5,045.00 which is a level that lies underneath a swing-low support and the 61.8% Fibonacci retracement.
Take profit is at 5,490.31 which is a swing-high resistance.
High Risk Investment Warning
Trading Forex/CFDs on margin carries a high level of risk and may not be suitable for all investors. Leverage can work against you.
Stratos Markets Limited (tradu.com):
CFDs are complex instruments and come with a high risk of losing money rapidly due to leverage. 63% of retail investor accounts lose money when trading CFDs with this provider. You should consider whether you understand how CFDs work and whether you can afford to take the high risk of losing your money.
Stratos Europe Ltd (tradu.com):
CFDs are complex instruments and come with a high risk of losing money rapidly due to leverage. 63% of retail investor accounts lose money when trading CFDs with this provider. You should consider whether you understand how CFDs work and whether you can afford to take the high risk of losing your money.
Stratos Global LLC (tradu.com):
Losses can exceed deposits.
Please be advised that the information presented on TradingView is provided to Tradu (‘Company’, ‘we’) by a third-party provider (‘TFA Global Pte Ltd’). Please be reminded that you are solely responsible for the trading decisions on your account. There is a very high degree of risk involved in trading. Any information and/or content is intended entirely for research, educational and informational purposes only and does not constitute investment or consultation advice or investment strategy. The information is not tailored to the investment needs of any specific person and therefore does not involve a consideration of any of the investment objectives, financial situation or needs of any viewer that may receive it. Kindly also note that past performance is not a reliable indicator of future results. Actual results may differ materially from those anticipated in forward-looking or past performance statements. We assume no liability as to the accuracy or completeness of any of the information and/or content provided herein and the Company cannot be held responsible for any omission, mistake nor for any loss or damage including without limitation to any loss of profit which may arise from reliance on any information supplied by TFA Global Pte Ltd.
The speaker(s) is neither an employee, agent nor representative of Tradu and is therefore acting independently. The opinions given are their own, constitute general market commentary, and do not constitute the opinion or advice of Tradu or any form of personal or investment advice. Tradu neither endorses nor guarantees offerings of third-party speakers, nor is Tradu responsible for the content, veracity or opinions of third-party speakers, presenters or participants.

SPY/QQQ Plan Your Trade For The Week Of April 20-25 : CautionI want to thank all of you for the great comments and questions over the past few months.
I'm very impressed by all of you and how well many of you are picking up my techniques to improve your trading results.
This video is more of a Pre-Week review - telling you why I expect the markets to trade/trend a certain way over the next 5 to 25+ days (or longer).
Additionally, I want to remind all of you my research goes much deeper (behind the scenes) than what you see in these Plan Your Trade videos.
I know many of you rely on my morning videos and some of you have messaged me about how important my videos are in helping you prepare for the day's price range/trend.
Ultimately, I started doing these Plan Your Trade videos to highlight my SPY Cycle patterns and to prove my research is accurate and helpful. Obviously, if my technology/techniques were failures, I would be hearing about it from lots of people by now.
But that is not the case. It appears my SPY Cycle Patterns and other techniques/tools are very well appreciated and are really helping traders learn to build better skills for greater success.
And that is what this is all about.
Remember, I've been lucky enough to rub shoulders with some of the greatest traders/minds on the planet for the past 35+ years. Sometimes, we would sit down for Coffee and share ideas. Sometimes, they would hire me to explore something they thought was important (coding/research). At other times, we would simply show up at an event together and chat about life and the markets.
I was lucky.
I got into this industry in the late 1980s (a long time ago) and have continued to learn new things and build my skills over the past 35+ years.
Now, I'm trying to share some of that knowledge with all of you so you can carry this information forward and make a real difference in your life (finding success while trading).
One of the biggest things I continue to try to teach all of you is PATIENCE.
Right now, the markets are in a unique phase (consolidation in a downward trend). You are going to have to learn to WAIT for the best trade setups and try not to force the markets do to what you want.
If you are not sure what to trade, sit on the CASH until you see a better opportunity.
OK. This week, after Easter, should be fairly quiet. Tax day and Easter usually fall fairly close to one another. This year, they were on the same week.
The markets are usually very flat near Tax Day - so don't expect much in terms of trending.
Volatility is still elevated. So, we may see some wild price action this week. Trade smaller amounts if you are still unsure about direction/setups.
Get some...
#trading #research #investing #tradingalgos #tradingsignals #cycles #fibonacci #elliotwave #modelingsystems #stocks #bitcoin #btcusd #cryptos #spy #gold #nq #investing #trading #spytrading #spymarket #tradingmarket #stockmarket #silver

The Brightest Metal Right NowGold isn’t just shining, it’s on fire, burning through resistance levels as investors seek shelter from global chaos.
Figure 1: Gold Prices Climbing to New Highs
Gold surged past $3,000 per ounce this March, setting 16 record highs this year alone. While it took more than a decade for gold to gain 1,000 points previously, this time it took less than two years.
Figure 2: Correction in the Equities and Cryptocurrencies
In stark contrast, the S&P 500 has dropped 10% since its February peak, marking its first correction since 2023. Bitcoin has also plunged to $81,000, a 25% decline since U.S. President Donald Trump’s inauguration. The AI-driven momentum that propelled tech stocks and the broader equity market higher in 2024 appears to have faded.
Figure 3: Historical Reactions to Crisis
The correction in equities and crypto stands in sharp contrast to gold’s rally—an outcome that should come as no surprise given gold’s reputation as a safe-haven asset. Historically, financial crises and major market pullbacks have consistently triggered capital flows into gold as investors seek refuge from economic uncertainty.
This time, gold’s outperformance is driven by a “perfect storm” of prolonged geopolitical tensions, escalating trade disputes, political uncertainty under Trump’s second term, and a weakening U.S. dollar.
The CNN Business Fear & Greed Index, a widely used measure of market sentiment, has remained in the “fear” and “extreme fear” zones. This stems largely from Trump’s protectionist policies, which have sparked swift retaliation from U.S. trading partners. With new tariff headlines surfacing almost daily, the future of economic policy and inflation has become increasingly uncertain, injecting heightened volatility into global markets. This has, in turn, strengthened gold’s appeal as a hedge against instability.
Figure 4: Gold’s Demand is not Limited to Investors
According to the World Gold Council, investment demand for gold doubled year-over-year in 2024. However, central banks have been the real drivers of demand, purchasing over 1,000 tons of gold for three consecutive years; accounting for 21% of global demand in 2024.
The rising U.S. budget deficit and Trump’s "America First" policies have created additional risks for central banks holding large reserves of U.S. Treasuries. The ongoing tariff war not only undermines confidence in the U.S. as a reliable trade partner but also raises concerns about the U.S. dollar’s long-term stability as a safe-haven asset. This has accelerated the de-dollarization process, prompting many central banks to stockpile gold as a hedge against dollar exposure.
Unlike investors who may hesitate to buy gold at record highs, central banks operate based on mandates, making them less price-sensitive. They are willing to continue accumulating gold at elevated levels, reinforcing sustained demand for the precious metal.
Figure 5: A Weakening Dollar
Since most gold futures contracts are denominated in U.S. dollars, a weaker dollar makes gold relatively cheaper for non-U.S. buyers, supporting its price. This negative correlation between the two assets has been a key driver of gold’s recent surge.
The Trump administration has long argued that the U.S. dollar’s global dominance has kept it too strong for too long, hurting American manufacturers and contributing to deindustrialization. Further, a strong dollar reduces the price competitiveness of U.S. exports and has widened the trade deficit, leading the administration to pressure the Federal Reserve to cut interest rates.
While the Fed maintains its independence and data-driven approach, inflation trends continue to justify further easing. The market has already priced in three quarter-point rate cuts for this year, with expectations that the first cut could come as early as June.
Gaining Access to Gold
Historically, the London over-the-counter (OTC) market, operated by the London Bullion Market Association (LBMA), has been the largest gold trading center. Traders use the LBMA gold price as the global benchmark for gold transactions, including central bank purchases.
On the other hand, the futures market is the preferred choice for hedge funds, bullion dealers, refineries, and mints to hedge against price fluctuations. Retail investors also typically gain exposure to gold through futures contracts, most commonly via the COMEX gold futures market.
However, executing arbitrage strategies between the OTC and futures markets is capital-intensive and logistically challenging. Traditional arbitrage requires buying physical gold in the LBMA market at a lower price while simultaneously selling COMEX futures at a higher price. This involves storing, insuring, and shipping gold to COMEX-approved vaults, making it difficult to determine the fair value of the spread.
Figure 6: B3 Gold Futures Contract
A more accessible alternative is emerging: Brazil’s B3 Exchange will soon list a new gold futures contract referencing the LBMA gold price.
This new contract offers several advantages:
Easier arbitrage execution: Traders can capitalize on price discrepancies between the B3 contract and COMEX futures.
Lower capital requirements: The contract size is just one troy ounce, 1/100th of the standard COMEX contract, allowing for greater flexibility in position sizing and risk management.
Financial settlement: Both the B3 and COMEX one-ounce contracts are cash-settled, eliminating the logistical challenges of physical delivery.
Putting into Practice
Case Study 1: Arbitrage Strategy
Figure 7: Current Available Gold Futures
A comparison of the existing gold futures contracts highlights key differences in specifications, including fineness, contract size, and settlement methods. While these variations cater to the diverse needs of hedgers managing different gold inventories, they pose challenges for traders looking to establish arbitrage strategies due to mismatches in contract structures.
The introduction of B3’s new gold futures contract addresses these limitations by aligning closely with the COMEX 1-ounce gold contract. This structural similarity simplifies the process of determining fair value in spread pricing, making arbitrage strategies more feasible. The primary distinction between the two lies in their price settlement methods, which, interestingly, also forms the basis of arbitrage opportunities between futures and spot prices.
Additionally, traders can now take advantage of price discrepancies between the two LBMA daily fixing prices by utilizing the B3 Gold and TFEX Gold Online futures contracts. This expands the range of arbitrage opportunities and enhances market efficiency for gold traders.
Case Study 2: Directional Strategy
By considering all the factors – gold’s safe-haven appeal, geopolitical tensions, central banks accumulation, and a weakening dollar – we believe that this is not the end of the gold rally. An investor looking to express a bullish view on gold could do so by buying the B3 one-ounce futures contract, gaining exposure to gold’s price movements in a more accessible and cost-effective manner.
Conclusion
As global uncertainties mount, gold’s resilience remains undeniable. Whether as a hedge against inflation, a refuge from geopolitical turmoil, or a tool for strategic trading, gold continues to prove its value in times of crisis. With central banks stockpiling at record levels, the metal’s rally may still have room to run. For investors navigating today’s volatile landscape, gold is not just a safe-haven, it’s a strategic asset poised for continued strength. It is extremely timely to have new trading instruments like B3’s gold futures providing more accessible opportunities for investors.
For traders looking to enhance liquidity and capitalize on bid-ask spread, B3 also offers a market-making program. Interested participants can reach out to the exchange for further details.

Weekly Market Forecast: Stocks Markets Are Stalled! Patience!In this video, we will analyze the S&P 500, NASDAQ, and DOW JONES futures for the week of April 21 - 25th
The Markets are stalled! No bullish follow through from the previous week. Last week failed to break the previous weekly high. This stall out looks consolidative and unclear. Wait for clarity! Let the markets break the high or low of the range convincingly... and trade accordingly.
Enjoy!
May profits be upon you.
Leave any questions or comments in the comment section.
I appreciate any feedback from my viewers!
Like and/or subscribe if you want more accurate analysis.
Thank you so much!
Disclaimer:
I do not provide personal investment advice and I am not a qualified licensed investment advisor.
All information found here, including any ideas, opinions, views, predictions, forecasts, commentaries, suggestions, expressed or implied herein, are for informational, entertainment or educational purposes only and should not be construed as personal investment advice. While the information provided is believed to be accurate, it may include errors or inaccuracies.
I will not and cannot be held liable for any actions you take as a result of anything you read here.
Conduct your own due diligence, or consult a licensed financial advisor or broker before making any and all investment decisions. Any investments, trades, speculations, or decisions made on the basis of any information found on this channel, expressed or implied herein, are committed at your own risk, financial or otherwise.

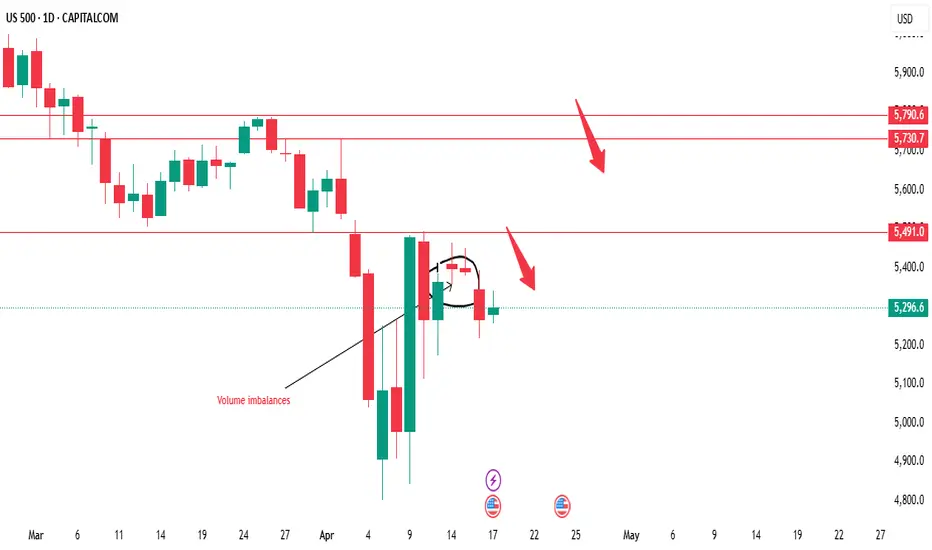
US500's performance this week will be crucial in determiningUS500 Weekly Analysis
The US500 index is currently exhibiting bearish tendencies, but a crucial level to monitor is $5491. This level has the potential to act as a resistance point, and we're looking for a possible selling opportunity around this area. However, if the market breaks above $5491, it could signal a shift in bias towards bullish territory, potentially leading to a significant upward move.
Key Levels to Watch:
1. Sell Zone: $5491 - This level is critical in determining the next move. We'll be watching for confirmation to sell, such as bearish candlestick patterns or trend indicators.
2. Resistance Area: $5730 - $5790 - A strong resistance zone that could potentially cap upward movements.
Trading Strategy:
1. Wait for Confirmation: We'll wait for the market to reach the $5491 level and look for confirmation to sell. This could include bearish candlestick patterns, trend indicators, or other technical signals.
2. Breakout Scenario: If the market breaks above $5491, we'll reassess the bullish potential and look for opportunities to buy.
3. Risk Management: It's essential to manage risk effectively, setting stop-losses and take-profits according to our trading plan.
Market Outlook:
The US500's performance this week will be crucial in determining the next direction. We'll be monitoring the market closely, analyzing price action, and providing updates on any developments. Stay tuned for our analysis and guidance on potential trading opportunities.
By keeping a close eye on these key levels and waiting for confirmation, we can make more informed trading decisions and navigate the markets effectively.
S&P 500 Daily Chart Analysis For Week of April 17, 2025Technical Analysis and Outlook:
In the recent shortened trading session, the Index recorded steady to lower prices, distancing itself from the Mean Resistance level of 5455, as indicated in the previous week's Daily Chart analysis. This trend establishes a foundation for continuing the downward trajectory, targeting the Mean Support level 5140. Should this downward momentum persist, further declines may extend to the next Mean Support level of 4970 and ultimately reach the completed Outer Index Dip at 4890.
Conversely, it is essential to acknowledge the possibility of upward momentum at the current price level, which may challenge the Mean Resistance of 5455 and extend toward the Outer Index Rally at 5550.

Are US Tariffs Similar To The COVID-19 Global DisruptionThis video is in response to a question asked by one of my followers on TradingView.
He specifically asked if the current US Tariffs create a similar situation to the COVID-19 supply disruptions and how it may result in longer-term market disruptions.
In this video, I try to answer these questions and highlight the differences I see related to what is happening now vs. the COVID-19 shutdown.
It is an interesting question.
I certainly see similarities, but I also see vast differences in terms of how the global markets are attempting to address the US tariff issues.
First, the current tariff issues are somewhat self-inflicted, not something like COVID-19 (unavoidable).
Second, the global central banks acted in concert to present immense liquidity to support a global shutdown with COVID. I don't see that happening right now.
Supply-side disruptions are evident, but we'll see how they play out over the next 60- 90+ days.
Longer-term, I hope these tariff issues are resolved before the global economy moves into a deeper recession. I will state that hard assets are likely to take a hit over the next 60-90+ days across the globe.
Any moderate (think 15 to 35%) slowdown in production, shipping, and consumption across the globe is going to be felt all over the planet. It is not going to be isolated to just one or two areas.
This is the smackdown that I don't believe anyone is really ready for. And that creates the urgency to resolve the tariff issues asap.
Hope this helps.
Get Some.
#trading #research #investing #tradingalgos #tradingsignals #cycles #fibonacci #elliotwave #modelingsystems #stocks #bitcoin #btcusd #cryptos #spy #gold #nq #investing #trading #spytrading #spymarket #tradingmarket #stockmarket #silver

Daily Price Action: S&P500 Emini Futures ES1!In this video, we will be looking into the potential price action of ES1!.

SPY/QQQ Plan Your Trade Video For 4-17 : Another BLANK dayToday's BLANK pattern in counter-trend mode is nothing to worry about.
As I research and document these patterns, there are patterns that appear frequently on the Daily price chart and there are others that appear more infrequently.
If I have not already marked these patterns and documented them, they have not appeared anywhere in the 11+ years of the Daily price data I use within the Lookup Engine.
Therefore, these are VERY RARE types of patterns - Extremely infrequent.
I will add that the secondary looking criteria show yesterday and today could be similar to "key top/bottom" types of price rotation. So, I do believe the current price level on the SPY (520-535) could prove to be very critical support/resistance going forward.
Tomorrow is Good Friday (no trading). So if you are going to take any trades today, make sure you remember to plan your exits for TODAY or NEXT WEEK (or later). You will not be able to exit stock/ETF trades tomorrow (sorry).
Gold is moving into a Momentum Rally, and I really want to see how that pattern plays out before the long holiday weekend.
Fingers crossed we see a BIG RALLY again today.
BTCUSD is still rolling into a downward price trend based on my EPP pattern structure. This downward trend aligns with my May 2 Major Bottom pattern for the SPY/QQQ. So I would expect BTCUSD to start to roll downward sometime near the middle/end of next week.
Remember, this weekend should be about your family, your friends, and your beliefs.
Relax and enjoy.
Get some...
#trading #research #investing #tradingalgos #tradingsignals #cycles #fibonacci #elliotwave #modelingsystems #stocks #bitcoin #btcusd #cryptos #spy #gold #nq #investing #trading #spytrading #spymarket #tradingmarket #stockmarket #silver #xauusd

S&P INTRADAY key resistance at 5509
Donald Trump said there was “big progress” in trade talks with Japan, easing fears of higher tariffs. This boosted the Nikkei 225, as traders grew less concerned about U.S. pressure for a stronger yen.
Meanwhile, U.S. stock futures pointed to a rebound after Wednesday’s selloff. The drop was sparked by Fed Chair Jerome Powell, who struck a cautious tone on tariffs and signaled no rush to cut rates, disappointing markets looking for quicker support.
Key Support and Resistance Levels
Resistance Level 1: 5509
Resistance Level 2: 5660
Resistance Level 3: 5787
Support Level 1: 5110
Support Level 2: 4947
Support Level 3: 4816
This communication is for informational purposes only and should not be viewed as any form of recommendation as to a particular course of action or as investment advice. It is not intended as an offer or solicitation for the purchase or sale of any financial instrument or as an official confirmation of any transaction. Opinions, estimates and assumptions expressed herein are made as of the date of this communication and are subject to change without notice. This communication has been prepared based upon information, including market prices, data and other information, believed to be reliable; however, Trade Nation does not warrant its completeness or accuracy. All market prices and market data contained in or attached to this communication are indicative and subject to change without notice.

S&P 500 - Key Levels and April 7-11 Weekly Candle StructureApril 7-11 will easily be remembered in 2025 as one of the craziest weeks in modern history.
Intraday swings were face ripping all from a Monday "fake news" becoming Wednesday "real news" with the US pausing tariffs for 90 days
5500 major resistance on S&P
4800 major support on S&P
I believe the market will struggle to provide any clear direction in the coming weeks without some shift in narrative (for better or worse). I'm sure most traders are hoping for an optimistic tone but be prepared to be disappointed as the world's alliances and economies are being strained with massive uncertainty and angst.
There are trading opportunities in the short-term, but I'm not taking any major risks. If I can survive, the upside will be easier and a pleasant surprise.
I expect the weekly candles to dance inside the April 7-11 low and high levels and hopefully it provides some ventilation to a VIX > 30

Non-US ETFs outperform during trade warNon-US markets are showing resilience during this year's remarkable volatility.
While NASDAQ:QQQ and AMEX:SPY are down more than 10%, AMEX:VEA (non-U.S. Developed Markets ETF) is up nearly 5%...
AMEX:IEMG (tracking Emerging Markets) is negative so far, but less severe than others. Will Trump's volatile trade war lead to further outflow from the U.S. financial system?
Meanwhile, gold has been rallying to record highs as the world seeks an alternative to the dollar.

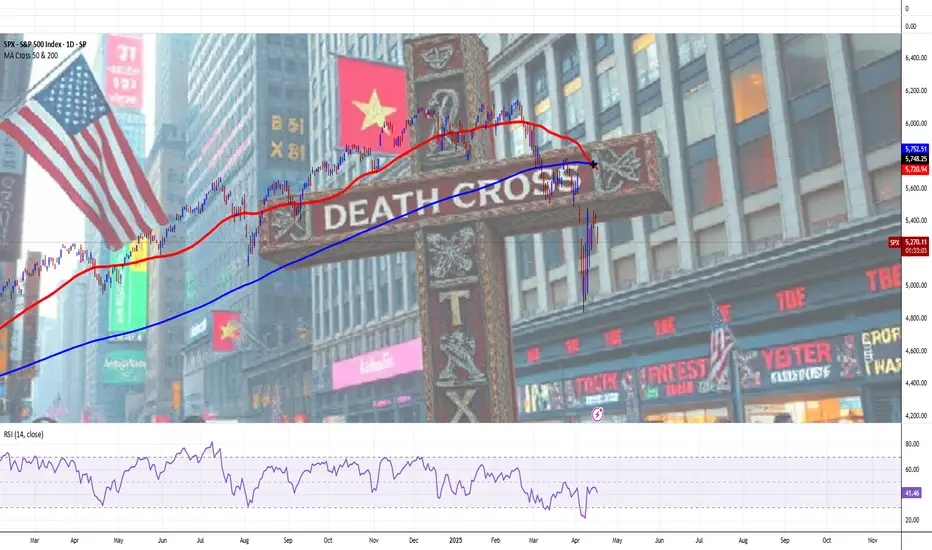
S&P 500 Index Goes 'Death Crossed' Again, Due To Unruly EconomyThe "Death Cross" is a technical chart pattern signaling potential bearish momentum in the US stock market, occurring when a short-term moving average (typically the 50-day) crosses below a long-term moving average (usually the 200-day).
Despite its foreboding name, historical data shows its implications are often less dire than perceived, serving as a coincident indicator of market weakness rather than a definitive predictor of collapse.
Historical Examples and Market Impact
The death cross gained notoriety for preceding major market downturns:
2000 Dot-Com Bubble: The Nasdaq Composite’s death cross in June 2000 coincided with the burst of the tech bubble, leading to a prolonged bear market.
2008 Financial Crisis: The S&P 500’s death cross in December 2007 foreshadowed the 2008 crash, with the index losing over 50% of its value by early 2009.
2020 COVID-19 Crash: The S&P 500, Dow Jones, and Nasdaq 100 all formed death crosses in March 2020 amid pandemic-driven panic, though markets rebounded sharply within months.
2022 Ukraine's War Crisis: The S&P 500, Dow Jones, and Nasdaq 100 all formed death crosses in March 2022 due to proinflationary surge on Ukraine's war and Arab-Israel conflict, leading to a prolonged bear market within next twelve months, up to March quarter in the year 2023.
These examples highlight the pattern’s association with extreme volatility, but its predictive power is inconsistent. For instance, the 2022 death cross in the S&P 500—its first in two years—occurred amid Fed rate hikes and geopolitical tensions, yet the market stabilized within weeks rather than entering a prolonged downturn.
Perspectives on Reliability and Use Cases
While the death cross reflects deteriorating short-term momentum, its utility depends on context:
Lagging Nature: As a lagging indicator, it confirms existing trends rather than forecasting new ones. The 50-day average crossing below the 200-day often occurs after prices have already declined.
False Signals: Post-2020 data shows the S&P 500 gained an average of 6.3% one year after a death cross, with Nasdaq Composite returns doubling typical averages six months post-cross.
Combined Analysis: Traders pair it with metrics like trading volume or MACD (Moving Average Convergence Divergence) to validate signals. Higher selling volume during a death cross strengthens its bearish case.
Strategic Implications for Investors
For market participants, the death cross serves as a cautionary tool rather than a standalone sell signal:
Short-Term Traders: May use it to hedge long positions or initiate short bets, particularly if corroborated by weakening fundamentals.
Long-Term Investors: Often treat it as a reminder to reassess portfolio diversification, especially during elevated valuations or macroeconomic uncertainty.
Contrarian Opportunities: Historical rebounds post-death cross—such as the 7.2% Nasdaq gain three months after the signal—suggest potential buying opportunities for risk-tolerant investors.
Fundamental Challenge
Stocks Extend Drop as Powell Sees Economy ‘Moving Away’ From Fed Goals
Powell sees economy ‘moving away’ from job, price goals due to Trump's tariff chainsaw.
Fed well positioned to wait for policy clarity. Strong jobs market depends on price stability, he adds.
Stocks extend declines, bonds rally as Fed chair speaks.
Conclusion
The "Death Cross" remains a contentious yet widely monitored pattern. Its dramatic name and association with past crises amplify its psychological impact, but empirical evidence underscores its role as one of many tools in technical analysis. Investors who contextualize it with broader market data—such as earnings trends, interest rates, and macroeconomic indicators—are better positioned to navigate its signals.
While it may foreshadow turbulence, its historical track record emphasizes resilience, with markets often recovering losses within months of the pattern’s appearance.
--
Best wishes,
Your Beloved @PandorraResearch Team 😎
// Think Big. Risk Less

SPY/QQQ Plan Your Trade For 4-15 : BLANK pattern day.As I stated in this video, last night I looked through the data and could not find any reference for this pattern going back more than 11 years. Same thing for tomorrow's pattern.
That means these are very RARE pattern setups and we'll have to watch to see how price action plays out today.
If there were no reference points over 11+ years of Daily price data (more than 2500 Daily Price Bars), then this is something very unique.
I believe today will act like a Reversal Bar. Potentially rallying off a lower opening price and setting up a type of Gap Lower Rally type of pattern - but that is just a guess.
At this point, trade smaller quantities until we see how price reacts this morning.
Gold and Silver make a BIG MOVE overnight - breaking above the $3300/$33 levels I suggested were critical psychological levels.
This is an INCREDIBLE rally in metals (thanks, China).
At this point, if you were long metals like I was, you can thank me all you want.
Be aware that metals will likely pause a bit above this psychological level, then start to move higher again.
The next big target is $3600-$3750 for Gold.
Bitcoin is doing exactly what I stated it would do - rolling into a top as demand for BTCUSD wanes. I believe the next low for BTCUSD will be closer to $60k-$63k. Pay attention.
Going to be a good day for everyone holding Gold/Silver/Miners CALLS (like I kept suggesting).
GOT SOME.
#trading #research #investing #tradingalgos #tradingsignals #cycles #fibonacci #elliotwave #modelingsystems #stocks #bitcoin #btcusd #cryptos #spy #gold #nq #investing #trading #spytrading #spymarket #tradingmarket #stockmarket #silver

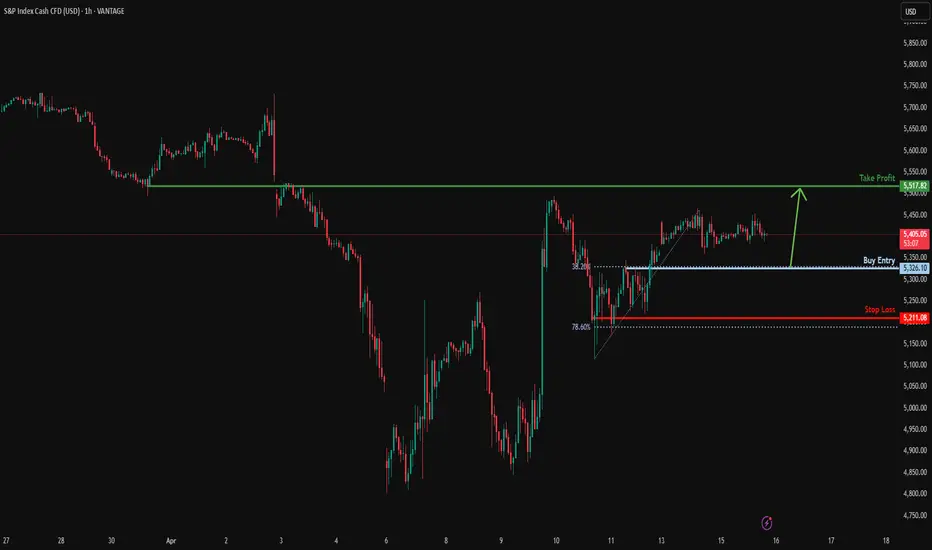
Bullish bounce off pullback support?S&P500 is falling towards the support level which is a pullback support that lines up with the 38.2% Fibonacci retracement and could bounce from this level to our take profit.
Entry: 5,326.10
Why we like it:
There is a pullback support level that aligns with the 38.2% Fibonacci retracement.
Stop loss: 5,211.08
Why we like it:
There is a pullback support level that lines up with the 78.6% Fibonacci retracement.
Take profit: 5,517.82
Why we like it:
There is an overlap resistance level.
Enjoying your TradingView experience? Review us!
Please be advised that the information presented on TradingView is provided to Vantage (‘Vantage Global Limited’, ‘we’) by a third-party provider (‘Everest Fortune Group’). Please be reminded that you are solely responsible for the trading decisions on your account. There is a very high degree of risk involved in trading. Any information and/or content is intended entirely for research, educational and informational purposes only and does not constitute investment or consultation advice or investment strategy. The information is not tailored to the investment needs of any specific person and therefore does not involve a consideration of any of the investment objectives, financial situation or needs of any viewer that may receive it. Kindly also note that past performance is not a reliable indicator of future results. Actual results may differ materially from those anticipated in forward-looking or past performance statements. We assume no liability as to the accuracy or completeness of any of the information and/or content provided herein and the Company cannot be held responsible for any omission, mistake nor for any loss or damage including without limitation to any loss of profit which may arise from reliance on any information supplied by Everest Fortune Group.
Daily Price Action: Futures S&P500 Emini ES1! Tuesday 4/15/2025 In this video, we are looking into the potential daily price action of ES1!.

Daily Price Action: S&p500 SPX Tuesday 4/15/2025 In this video, we are looking into the potential daily price action of SPX.
