S&P 500 for 100 yearsThis is probably really dumb, but I thought it looked cool, appreciate any feedback
#longterm
#trend
S&P 500 (SPX500)

Apparatchik Trump Says 'No.. More Pain' Ahead of Amazon EarningsPresident Trump's new tariffs have had a significant negative impact on Amazon's stock performance, revenue, and earnings, primarily due to increased costs and supply chain disruptions.
Here below is a detailed analysis of these effects.
Impact on Amazon's Stock Performance
Amazon's stock has seen substantial declines following the announcement of Trump's tariff plan. The company's shares dropped nearly 7% within two days of the announcement and are down nearly 21% year-to-date. These tariffs have exacerbated existing challenges for Amazon, which was already struggling in early 2025 with a 13% decline in stock value during the first quarter. The broader market also suffered, with technology stocks experiencing sharp declines as investors reacted to fears of higher costs and inflation.
Revenue Challenges
Amazon's reliance on Chinese suppliers for merchandise has made it particularly vulnerable to the newly imposed tariffs. Over 50% of Amazon's top third-party sellers are based in China, and many of their products are subject to hefty import taxes, including a 34% tariff on Chinese goods. These tariffs increase landed costs for a significant portion of Amazon's inventory, forcing sellers to either absorb the additional expenses or pass them on to consumers through higher prices. This could lead to reduced consumer demand, as higher prices may deter shoppers from purchasing goods on Amazon's platform.
Additionally, the elimination of duty exemptions on minor imports—previously advantageous for discount platforms such as Temu and Shein—has disrupted Amazon's competitive pricing strategy. While this change may level the playing field among e-commerce platforms, it also raises operational costs for Amazon's marketplace vendors who had relied on these exemptions.
Earnings Pressure
The tariffs are projected to slash Amazon's annual operating profits by $5 billion to $10 billion due to increased merchandise costs. Goldman Sachs estimates that these costs could rise by 15% to 20%, further straining profitability. While Amazon has historically maintained lower prices compared to competitors, absorbing these increased expenses without raising prices significantly may be unsustainable in the long term.
Moreover, fears of inflation resurgence due to Trump's trade policies could further dampen consumer purchasing power. This would likely lead to lower sales volumes and additional pressure on profit margins across Amazon's retail operations.
Potential Mitigation Strategies
To counteract these challenges, Amazon may implement several measures:
Vendor Negotiations. The company could negotiate with suppliers to share the burden of increased input costs rather than bearing them entirely.
Price Adjustments. Selective price increases on certain products may help offset rising costs without alienating customers entirely.
Supply Chain Diversification. Shifting sourcing away from heavily tariffed regions like China or focusing more on domestic suppliers could reduce exposure to trade disruptions.
Focus on Services. Amazon’s cloud division, AWS, contributes significantly to its operating income (58% in Q4 2024) and remains largely unaffected by tariffs. Increased emphasis on AWS could help mitigate losses from retail operations.
Technical challenge
The main technical graph indicates on Bearish market in development, with nearly 30% potential to further decline, down to major 10-year average support.
Conclusion
Trump’s tariffs have created substantial headwinds for Amazon by driving up costs and disrupting its supply chain. These challenges have led to stock declines, reduced revenue potential, and significant earnings pressure. While Amazon is exploring mitigation strategies such as vendor negotiations and diversification, the long-term impact will depend on how effectively the company adapts its operations amidst ongoing trade tensions.
--
Best 'Apparatchik' wishes,
PandorraResearch Team 😎

SPY/QQQ Plan Your Trade Update 4-8 : Counter Trend Bottom/RallyThis video was created to help you better understand why it is important to WAIT for the SPY Cycle Patterns to setup efficiently.
It is critically important that all of you learn the three basic rules of trading.
1. Never try to force a position/trade. If your research tells you some type of price event/trend is likely - don't jump into the trade too early. Wait for confirmation and wait for price to confirm your analysis is correct.
2. Start with a small position. Never GO BIG on your initial trade. If you are wrong, you can manage the trade with a small win/loss. If price moves in the direction you expect, you can add more once you get confirmation the trend will continue (potentially).
3. BOOK PROFITS early and keep BOOKING PROFITS as the trend continues higher. You can always get back into the trade with CALL/PUT options - but if you don't learn to BOOK PROFITS EARLY (20-30% profits in the trade), then you'll very likely FAIL to build your account efficiently.
(Trust me, #3 is VERY IMPORTANT)
Beyond these three simple concepts, one of the most important aspects of trading with my SPY cycle patterns is to learn to WAIT for the pattern to setup efficiently.
Today is a great example.
The BOTTOM/Rally Start pattern was in Counter-trend mode. Thus, I expected it to be INVERTED - turning it into a TOP/Selloff Start pattern.
In order for that pattern to play out, we needed to see the markets open higher (and potential trend higher for a bit of time), then roll over into a top pattern. After that tops pattern setup, the markets should continue to move into a moderate selloff trend (downward).
Think about it. Were you smart trying to SELL INTO the rally this morning or were you smart to wait for the ROLLOVER and sell into the breakdown trend?
IMO, smart traders waited for the top to setup/confirm and started selling as we got into the breakdown trend phase.
Again, I'm trying to help you learn to become a better trader.
I hope this video helps.
Get some.
#trading #research #investing #tradingalgos #tradingsignals #cycles #fibonacci #elliotwave #modelingsystems #stocks #bitcoin #btcusd #cryptos #spy #gold #nq #investing #trading #spytrading #spymarket #tradingmarket #stockmarket #silver

Has SPX formed a bottom?SPX500USD - 24h expiry
Price action looks to be forming a bottom.
A Doji style candle has been posted from the base.
Setbacks should be limited to yesterday's low.
We look to buy dips.
Risk/Reward would be poor to call a buy from current levels.
We look to Buy at 4900.5 (stop at 4767.5)
Our profit targets will be 5295.5 and 5365.5
Resistance: 5219.6 / 5350.0 / 5500.0
Support: 5100.0 / 5000.0 / 4812.2
Risk Disclaimer
The trade ideas beyond this page are for informational purposes only and do not constitute investment advice or a solicitation to trade. This information is provided by Signal Centre, a third-party unaffiliated with OANDA, and is intended for general circulation only. OANDA does not guarantee the accuracy of this information and assumes no responsibilities for the information provided by the third party. The information does not take into account the specific investment objectives, financial situation, or particular needs of any particular person. You should take into account your specific investment objectives, financial situation, and particular needs before making a commitment to trade, including seeking advice from an independent financial adviser regarding the suitability of the investment, under a separate engagement, as you deem fit.
You accept that you assume all risks in independently viewing the contents and selecting a chosen strategy.
Where the research is distributed in Singapore to a person who is not an Accredited Investor, Expert Investor or an Institutional Investor, Oanda Asia Pacific Pte Ltd (“OAP“) accepts legal responsibility for the contents of the report to such persons only to the extent required by law. Singapore customers should contact OAP at 6579 8289 for matters arising from, or in connection with, the information/research distributed.

SPY/QQQ Plan Your Trade For 4/8 : Bottom/Rally Start - CounterFirst off, today's pattern is in a COUNTER TREND mode. Think of that as the pattern being INVERTED to the current price trend.
Next, the Bottom/Rally Start pattern is usually a base/bottom type of pattern that prompts a fairly strong bullish/rally phase in price.
This time, because it is inverted (in Counter-trend mode) and is forming within the broad consolidation phase of the current EPP pattern, I believe this Bottom/Rally Start pattern will really be a Top/Selloff start type of pattern.
Where price will find resistance in early trading, form a rollover top, and start to move back downward towards the 500-505 level on the SPY.
I don't believe this downward price move will attempt to break below 480-485 today. I believe today's move will be a moderate pullback in the trend.
Although any BIG news could disrupt the current support near $480, so be aware that any big news event could crush the markets (again) and send the SPY trying to retest the $480 support level.
Gold and Silver appear to be basing - perfect. I'm watching for Metals to really start to reflect the FEAR in the markets and rally above $3200 (Gold)/$39 (Silver).
BTCUSD appears trapped in the breakdown stage of the current EPP Consolidation phase and the new CRADLE pattern. No matter how I try to identify if I'm wrong with BTCUSD, I keep seeing the breakdown as the more dominant trend.
Get some.
#trading #research #investing #tradingalgos #tradingsignals #cycles #fibonacci #elliotwave #modelingsystems #stocks #bitcoin #btcusd #cryptos #spy #gold #nq #investing #trading #spytrading #spymarket #tradingmarket #stockmarket #silver

S&P INTRADAY oversold bounce backTrump threatened a 50% import tax on China, adding confusion over his global tariffs. China promised to hit back and moved to support its markets.
Stocks bounced slightly as investors looked for bargains, but uncertainty around U.S. trade policy remains. U.S. Treasuries rose after falling on Monday.
Wall Street is getting more cautious. BlackRock downgraded U.S. stocks, and Goldman Sachs warned the selloff could turn into a longer bear market.
Key Support and Resistance Levels
Resistance Level 1: 5273
Resistance Level 2: 5379
Resistance Level 3: 5510
Support Level 1: 4815
Support Level 2: 4700
Support Level 3: 4585
This communication is for informational purposes only and should not be viewed as any form of recommendation as to a particular course of action or as investment advice. It is not intended as an offer or solicitation for the purchase or sale of any financial instrument or as an official confirmation of any transaction. Opinions, estimates and assumptions expressed herein are made as of the date of this communication and are subject to change without notice. This communication has been prepared based upon information, including market prices, data and other information, believed to be reliable; however, Trade Nation does not warrant its completeness or accuracy. All market prices and market data contained in or attached to this communication are indicative and subject to change without notice.

SPX bounce is dueSPX RSI hasn't been so oversold since the Corona crash, plus bouncing from the 2022 ATH
Relief is due

Are we done with the slide, or not? US indices are suffering right now, but is there light at the end of the tunnel?
Let's dig in!
MARKETSCOM:US500
MARKETSCOM:US100
MARKETSCOM:US30
Let us know what you think in the comments below.
Thank you.
77.3% of retail investor accounts lose money when trading CFDs with this provider. You should consider whether you understand how CFDs work and whether you can afford to take the high risk of losing your money. Past performance is not necessarily indicative of future results. The value of investments may fall as well as rise and the investor may not get back the amount initially invested. This content is not intended for nor applicable to residents of the UK. Cryptocurrency CFDs and spread bets are restricted in the UK for all retail clients.

BTC, GOLD, DXY & S&P comparison - Who won yesterdayI have not posted this chart for a while.
For me, I find it an excellent way of looking at the general Market sentiment.
And I see determination to NOT fail.
And interestingly, It is the $ that won out yesterday ( Monday 7 April 2025 )
The charts are 4 hour.
The DXY got a Boost as other currencies fell in value against the $, so making the $ the winner.
Also interesting to see how the British £ continued to dive against the Euro, despite the lower Tariff %
But today,. Tuesday 8 April, we see the DXY is Dropping steeply as other currencies pick each other up. Going to be interesting to see how this plays out this week.
The 2nd strongest was BITCOIN with a Solid but cautious recovery.
Again, today we are seeing a pause as PA comes up under resistance.
However, the MACD is in such good shape now and the Histogram currently showing a softening of the Bear with a white candle...
This is the weekly MACD chart
We are still in early week, so we need to watch this
On the 4 hour, MACD has bounced off the OVERSOLD line and has a LOT of room to move higher, and the ability to do so. BTC PA is now like a coiled Srping...
GOLD was a surprising Looser with sharp drops and a slow sluggish recovery.
The MArket Cap on Gold is HUGE and so moving PA is tough but for me, just the fact that the "safe Haven" has been selling off shows us all that Gold is exhausted after its recent, slow, methosical rise to ATH. It is Overbought, as IIIIIIIII mentioned in a previous post when compared to BTC.
As we can see, Gold is currently Under a line of Local resistance that could prove strong enough to reject it again. We need to watch this and if it sells off, find out where the Money is going.
S&P500, like many marketd, eventually began recovering but Slowly.
The Biggest Losers and still to show recovery are London and European.
]
The chart is the London stock excahnge 4 hour. As you can see, a recovery was attempted but so far has failed. The Europeon is slightly better.
Over All, Trumps plan is working, Boosting the $ internationally against foreign currencies and Bitcoin has picked up the real money. We have yet to see the full results and things can change quickly.
To many extents, this is good timing as to upset the worlds Economies ( when gauged against he $) in Spring allows foer the dust to settle before Summer sets in and the Markets settle for the Sumer holidays ( in the northern hemisphere )
Interesting days ahead

Bulls are not of the woods, not by far1. What happened yesterday?
In my weekend analysis covering US indices , I mentioned that US500 (SP500) could drop and test the ascending trend line starting back at the pandemic low. This line is confluent with the horizontal support level given by January 2022 ATH, offering a good opportunity for traders to open long positions.
Indeed, at least on CFDs and futures, this trend line was touched, and the price rebounded strongly from there.
2. Key Question:
Will we have a full V-shape recovery, or will the price drop back below 5k in the coming sessions?
3. Why I expect a continuation of the correction:
🔸 Strong Resistance: The US500 has established a robust ceiling around the 5350-5400 zone(also a gap there)
🔸 Lack of Building Momentum on Support: There's no clear indication that this resistance will be broken anytime soon with the lack of accumulation under 5k
🔸 Potential for Further Decline: Given the current market structure, a drop below 5k remains a realistic possibility in the upcoming sessions.
4. Trading Plan:
🎯 My Strategy: Playing the range.
✅ Buy near the 4800 support.
✅ Sell into the resistance zone between 5350 and 5400.
5. Conclusion:
I’m watching for market confirmations and will continue applying this range strategy until there’s a clear directional change. 🚀
Disclosure: I am part of Trade Nation's Influencer program and receive a monthly fee for using their TradingView charts in my analyses and educational articles.

This is my point of view regarding the S&P 500This is my point of view regarding the S&P 500. Will it play out exactly like this? Probably not, but as a general picture, I think there will be similarities.

$SPY short term top downside from $521 to $481AMEX:SPY is looking like it put in a short term top here. I originally only thought that we had the potential to fall to $545 or so, but now looking at the chart, I think we have the possibility of falling farther.
The two targets that I'm looking for on the downside are $524.35 and 481.18.
Let's see if they get hit over the coming weeks.
If they hit, it'll be the ultimate buying opp as I think from there, we're likely to see SPY over $700 in the coming year or two.

S&P500 vs Unemployment vs Yield CurveI'd be surprised if that was the bottom in equities. 10yr/2yr is still coming out of inversion which historically is followed by a recession and a decline in equities, and we have unemployment remaining stubbornly low with only one direction to go from current levels. Market selloffs usually mean investors lose money while main street loses jobs so we should start to see the unemployment rate begin to rise from here assuming that the tariff war isn't over.
Trump proved today that he has no intention of relenting on the new tariffs; when China retaliated with 34% tariffs on US goods, he immediately hit them with 50% tariffs. Not sure which side will cave first, but as long as there is uncertainty around US/China trade the risk for further declines in equities remains.
The previous two times the yield curve inverted, we saw 50%+ declines in equities and rising unemployment when the curve came out of inversion. There was also a short-lived inversion in 2019 with a spike in unemployment and falling equity prices due to Covid, but the Federal Reserve lowering interest rates to 0% and printing trillions of dollars kept that bear market short and sweet.
We currently have a Federal Reserve that needs higher rates to fight inflation while at the same time we have a president who wants lower rates to stimulate growth. Catch-22 for the Fed: if they lower rates, they risk reigniting inflation. If they raise rates or keep them flat during a market decline it will speed up the decline in equities. Trump knows this which is why I don't think that the tariff war and market decline are over.

SPY/QQQ Plan Your Trade EOD Review : POP PatternToday's pattern played out perfectly.
I'm really amazed that the SPY rallied up to my resistance level ($520-525) and stalled/bottomed exactly near my $480 support.
Absolutely PERFECT reflection of the data I presented this morning and from my research over the weekend.
Now, if my analysis is correct, we move into a sideways consolidation pattern for the next 3+ weeks where price will attempt to establish a range (moving slightly downward in trend) before we get to the late-June breakdown (setting up the July 2025 low), then another big breakdown in October 2025.
I can't tell you how pleased I am with the comments and messages I get every day. Some of you are KILLING IT and I'm so happy to be able to help.
Remember, we are all trying to find the best way to profit from these market trends. So remember to share your success with others and let them know how to find the best tools for trading (on TradingView).
Now, let's get busy trying to get ready for the next phase of this market trend (which will come in June).
I'll keep you updated.
Get some.
#trading #research #investing #tradingalgos #tradingsignals #cycles #fibonacci #elliotwave #modelingsystems #stocks #bitcoin #btcusd #cryptos #spy #gold #nq #investing #trading #spytrading #spymarket #tradingmarket #stockmarket #silver

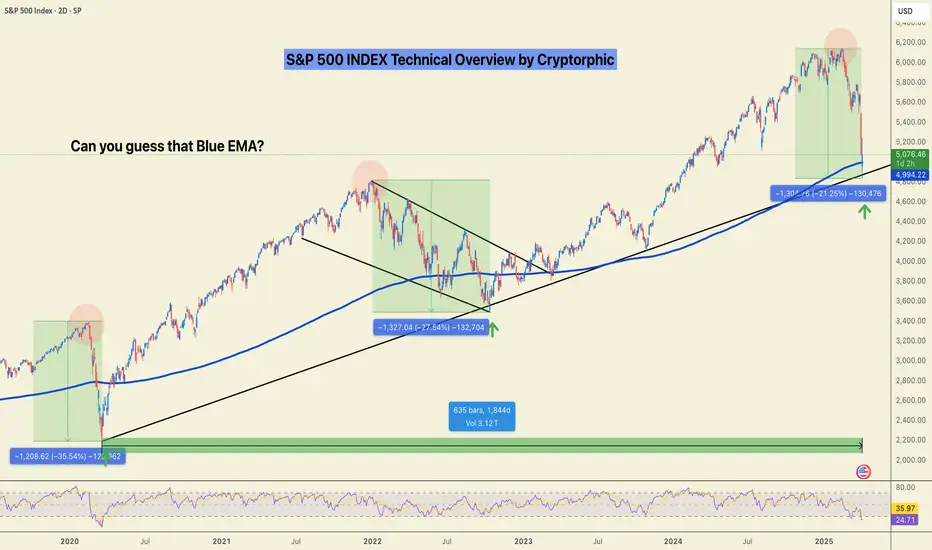
S&P 500: Valuation Correction or the Start of a Breakdown?Valuation Correction or the Start of a Breakdown?
Zoom out. Clear the noise.
We might still sweep the lows, but when viewed on the weekly timeframe, this current S&P 500 move looks more like a healthy valuation correction than a structural breakdown.
Let’s break it down by the numbers using fractal analysis:
🟩 March 2020 (COVID Crash):
▪️~35% drop
▪️V-shaped recovery
▪️Oversold RSI bounce
🟨 2022 Bear Market:
▪️~27% correction
▪️Multi-month wedge consolidation
▪️Eventually led to an upside breakout
🟦 Now (2025):
▪️~21% correction so far
▪️Retesting long-term trendline
▪️RSI in familiar oversold zone
📊 Fractal Math:
- From 35% to 27% = 22.86% decrease
- From 27% to 21% = 22.22% decrease
Both legs show a consistent ~22% drop in correction depth suggesting bearish momentum is weakening with each cycle. Currently bouncing off the1844 days of support.
Is this the bottom? Will there be relief?
🔁 If this pattern holds:
- We could see a short-term sweep or deviation under recent lows.
- But structure favours a potential recovery from this zone, unless the trendline breaks decisively.
📌 Watch levels closely. Timing matters.
🧠 What’s your take, is this another “buy the dip” moment?
Do hit the like button if you liked this update and share your views in the comment section.
$SPX Flirting With a Bear Market alongside $QQQ NASDAQ fell another 4% touching down 26%
S&P 500 walking a tight rope falling 21% to play with the idea of a Bear Market, but has rebounded a bit.
NASDAQ:QQQ did have a stronger response from buyers than SP:SPX
Nonetheless, we would need several WEEKLY closes sub 20% losses to enter a textbook Bear Market.

SPX WEEKLY 7TH APRIL 2025Welcome to SPX weekly. I have deeply discussed the price action here. If you have any doubts, feel free to leave a message or comment below.
NOTE:DO NOT SHORT

SPY/QQQ Plan Your Trade For 4-7 : POP In Counter Trend ModeToday's POP pattern in Counter Trend mode suggests the markets will find support and attempt to POP upward a bit.
I expect the SPY to attempt to reach levels above 505 today. Possibly trying to peak near 510.
The same thing will happen with the QQQ - a potential rally (POP) higher targeting the 420-425 level.
Watch this video TWICE if you really want to understand what is taking place in the markets right now.
The tariff issue will settle over the next 15+ days. The SPY/QQQ are moving into the EPP Consolidation Phase (just like I've been telling you for months now).
BTCUSD is moving into a BREAKDOWN phase and will likely target $63k over the next 30+ days.
Gold and Silver reacted to the breakdown of the SPY/QQQ as they always do - PANIC SELLING.
Now that the panic selling pressure appears to be subsiding, Gold and Silver should build a base and begin an explosive move higher - targeting $4200-4500 for gold and targeting $41-44 for silver.
We live in exciting times and I still believe the US markets will DOUBLE or TRIPLE over the next 5-10+ years.
Get Some.

S&P INTRADAY futures point to lower open Global stocks sold off sharply on Monday as investors rushed into safe-haven assets, driven by growing concerns over U.S. President Donald Trump’s tariffs. The market reaction is forcing Wall Street analysts to dial back their bullish outlook on U.S. equities.
Despite the market turmoil, Trump and his team downplayed fears of inflation and recession, remaining confident that strong economic growth lies ahead.
In response, China’s policymakers met over the weekend to discuss potential steps to support the economy, including speeding up planned stimulus measures, according to sources.
Meanwhile, traders are now expecting the Federal Reserve to cut interest rates this year, with some even betting on an emergency rate cut before the Fed’s next scheduled meeting, as recession fears mount.
Oil prices dropped for a third day, with Saudi Arabia cutting the price of its main crude grade by the most in over two years, adding to the bearish sentiment.
Key Support and Resistance Levels
Resistance Level 1: 5273
Resistance Level 2: 5379
Resistance Level 3: 5510
Support Level 1: 4815
Support Level 2: 4700
Support Level 3: 4585
This communication is for informational purposes only and should not be viewed as any form of recommendation as to a particular course of action or as investment advice. It is not intended as an offer or solicitation for the purchase or sale of any financial instrument or as an official confirmation of any transaction. Opinions, estimates and assumptions expressed herein are made as of the date of this communication and are subject to change without notice. This communication has been prepared based upon information, including market prices, data and other information, believed to be reliable; however, Trade Nation does not warrant its completeness or accuracy. All market prices and market data contained in or attached to this communication are indicative and subject to change without notice.

spx 5100 targetAfter warning of 200 pnts drop yesterday for monday, the futures opened 200 pnts lower at 4800
But expect to see a green bar during the day or tomorrow with 5100 as target to fill some gap and many short sellers taking profit. 4800 is at 2022 peak so technically a strong support
5100 hundred would be a resistance for further downside
If it goes over 5100 and stays there, the trendline break rule fails. Then I will have to review my further downside targets and start being medium term neutral/bullish from bearish and consider 5300 as next target and 4800 as target for double bottom for being bullish

Modified Count to Reflect Recent DeclineIn truth, the levels we're seeing this morning when the SPX cash market opens, I was not anticipating seeing till the 3rd quarter of this year. Mid last week, we had positive MACD divergences on the intraday charts and was setting up to be almost a textbook bottom.
Nonetheless, the SPX cash market will not hold the must hold zone when it opens this morning. This means we will get a retracement higher in a minor wave B that should last some time. This will represent one the final opportunities traders will have to relieve themselves of excess portfolio leverage and risk.
We very well may spend the summer months retracing higher...but there is no doubt some of you reading this will assume this will result in the resumption of the previous bull market.
It will not be.

S&P 500: Historic Crash or Just Another Chance?Let’s be real: What’s happening with the S&P 500 right now is rare. This is only the fourth time in history that the index has dropped more than 10% in two days (technically three, including today’s Monday session). The other times? October 1987, November 2008 during the financial crisis, and March 2020 during the pandemic crash.
And now? We’re seeing a similar drop, this time triggered by a global tariff war , stoked by the U.S. and other governments playing chicken to see who folds first.
Yeah, it sucks. It hurts. But it could also be a hell of an opportunity.
We just tagged the 4,800 level —a place many didn’t expect to see this quickly. Neither did I. But here we are. The untapped VWAP got hit, and this might very well be the start of Wave A. Could we go lower? Absolutely. There’s a monthly Fair Value Gap around $4,500, and a drop to $4,250 isn’t out of the question either.
But here’s the thing: it depends entirely on your perspective.
If you’re trading on the 30-minute chart, this is a full-blown crisis. But zoom out to the daily, weekly, or monthly chart—and it’s just market noise.
Pull up the log chart from 1953 to 2025 in the top left corner. We’ve seen this before. A handful of times. And on that scale? Nobody cares.
If you’re in the game to build long-term wealth, this moment is just another temporary shakeout. If you’re doing dollar-cost averaging, this is exactly where you want to be adding—not panicking.
The market doesn’t care about your plan. It forces you to adapt. You can’t fight it, only flow with it.
And if you’re in it for the long haul? This is just noise. Ignore it, zoom out – and stay the course.

Cleveland-Cliffs (CLF) BUY SETUPlooking for a strong recovery on us steel sector in 2025 and 2026.
trade carefully.
good luck.
