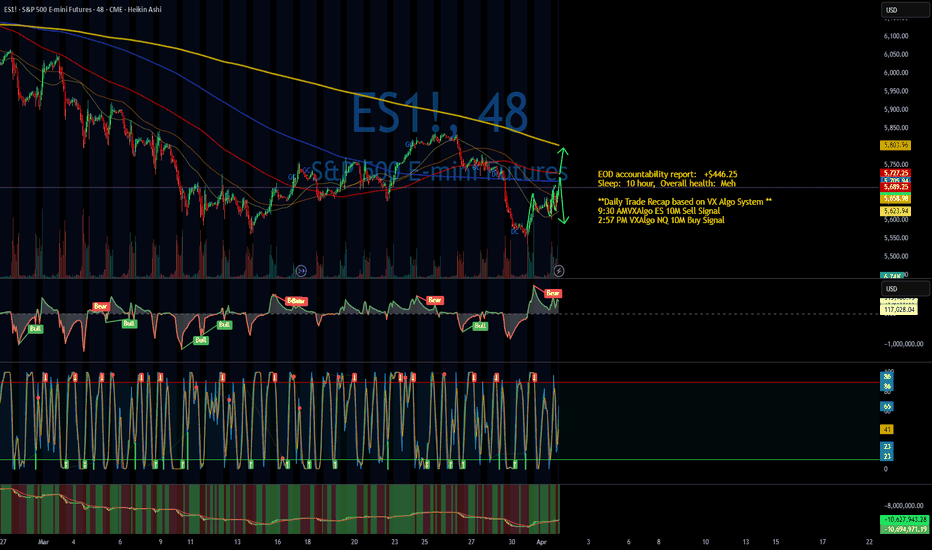
Stocks jittery as markets await tariffs Volatility was again the name of the game in equity markets as investors braced for President Donald Trump’s impending tariff announcement, which promises to reshape global trade dynamics. With uncertainty swirling around the scope and impact of his so-called reciprocal tariffs, there remains little consensus on how markets will react as the final deliberations unfold.
A few headlines that have come out:
Trump administration official has confirmed that Amazon has put in a bid to buy TikTok
Tesla Inc. jumped 5% on hopes Elon Musk will refocus on the carmaker as a news report suggested his time as a top adviser to Trump may end soon.
US tariffs will be in bands of 10%, 15% and 20% -- Sky News
The bands will differ by both country and industry depending on how the White House views barriers to trade.
CNBC: TRUMP ADMINISTRATION CONSIDERING REVOCATION OF TARIFF EXEMPTIONS FOR CHEAP SHIPMENTS FROM CHINA - SOURCE
Trump auto tariffs due to take effect at midnight - Reuters
The key resistance area to watch today is between 5670 to 5695 - as shaded in yellow on the chart. This zone was previously support and has now turned into a bit of resistance, capping today's gains. Will the selling pressure resume from here or do we go back above it?
It all depends on severity of tariffs.
In the event we go lower, then the area between 5500 to 5550 is the key support zone to watch.
In the event the market go higher, and break through 5670 to 5695 zone, then the 200-day average and prior resistance near 5770-5787 will come into focus next.
By Fawad Razaqzada, market analyst with FOREX.com
S&P 500 (SPX500)
S&P 500 Short Setup – Key Resistance in Focus!🔥 I’m watching this critical resistance zone on the S&P 500 (US500)! A rejection at this level could spark strong bearish momentum. A clear reaction at resistance is key for confirmation.
📍Entry: 5,726.50 USD – just below the key resistance, but only after rejection is confirmed
🎯Targets:
TP1: 5,645.00 USD
TP2: 5,610.00 USD
TP3: 5,585.00 USD
⛔Stop-Loss: 5,768.00 USD
⚡ Patience is crucial, waiting for confirmation reduces risk and boosts accuracy! Would you take this trade? Let me know below! 👇
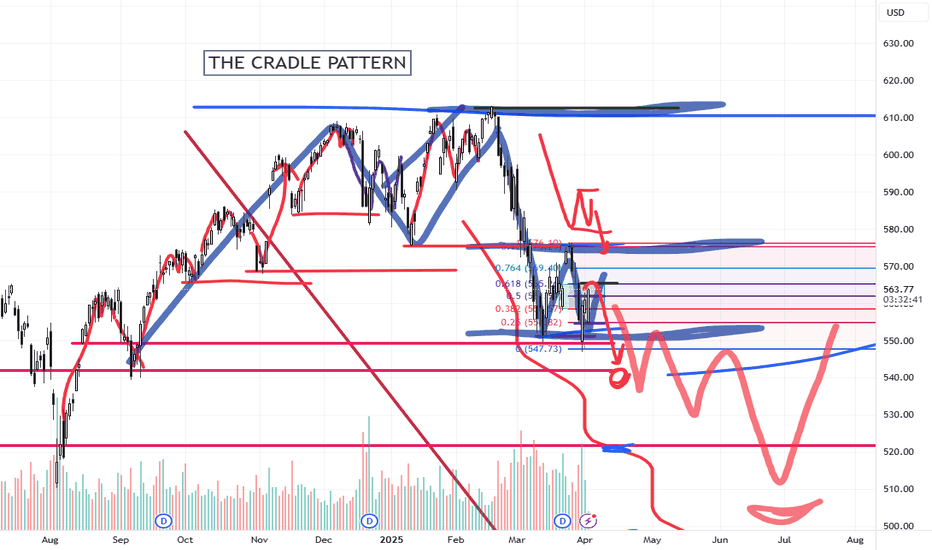
Using The CRADLE Pattern To Time/Execute TradesThis simple video highlights one of my newest pattern definitions - the Cradle Pattern.
In addition to the many other patterns my technology identified, this Cradle Pattern seems to be a constant type of price construct.
I'm sharing it with all of you so you can learn how to identify it and use it for your trading.
Ideally, this pattern represents FLAGGING after a trend phase.
It is a consolidation of price within a flag after a broad trending phase.
It usually resolves in the direction of the major trend, but can present a very solid reversal trigger if the upper/lower pullback range is broken (see the examples in this video).
Learn it. Use it.
Price is the ultimate indicator.
Learn to read price data more efficiently to become a better trader.
Get some.
#trading #research #investing #tradingalgos #tradingsignals #cycles #fibonacci #elliotwave #modelingsystems #stocks #bitcoin #btcusd #cryptos #spy #gold #nq #investing #trading #spytrading #spymarket #tradingmarket #stockmarket #silver
S&P500 will start to riseAsper Elliott wave forecasting the current 4th wave ended this week.
A new wave will begin as 'c5' during 1'st week of April and it may be the climax rally.
Validity of this wave count holds good as long as last weeks low respected.
Traders can initiate long with 5500 as strict stop.
The target will be reached swiftly
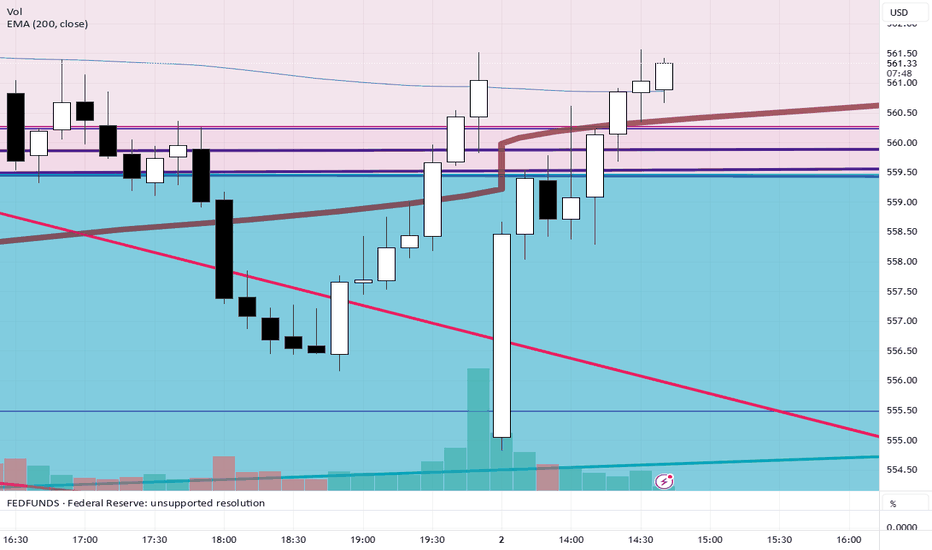
SPY/QQQ Plan Your Trade Update Update For 4-2 : ConsolidationThis quick update shows why I believe the SPY/QQQ will struggle to make any big move as long as we stay within the 382-618 "Battle Zone".
The SPY continues to rally up into this zone and stall out. If the SPY stays within this zone, I believe the markets will simply roll around in a tight range and go nowhere today.
Thus, I published this article to warn traders not to expect any big trends until we breakout - away from this Fibonacci "Battle Zone".
You can't kick the markets to make it go anywhere. And, unless you are trading very short-term swings in price - you are probably better off sitting on the sidelines waiting for a broad market trend to establish.
This is a warning. As long as we stay in the Fibonacci "Battle Zone", price will struggle to build any major trend.
So, play your trades accordingly - or just take a break from trading while you wait for the markets to roll out of the "Battle Zone".
Get some.
#trading #research #investing #tradingalgos #tradingsignals #cycles #fibonacci #elliotwave #modelingsystems #stocks #bitcoin #btcusd #cryptos #spy #gold #nq #investing #trading #spytrading #spymarket #tradingmarket #stockmarket #silver
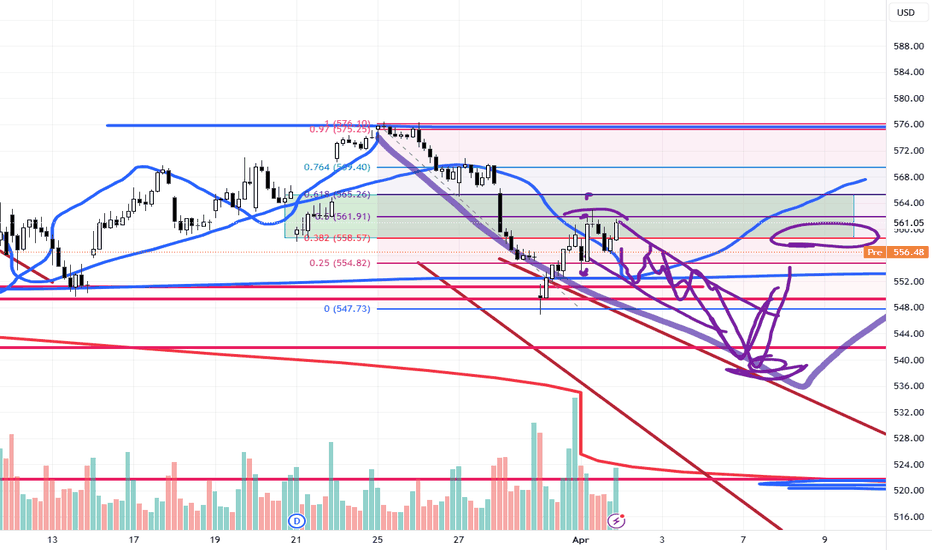
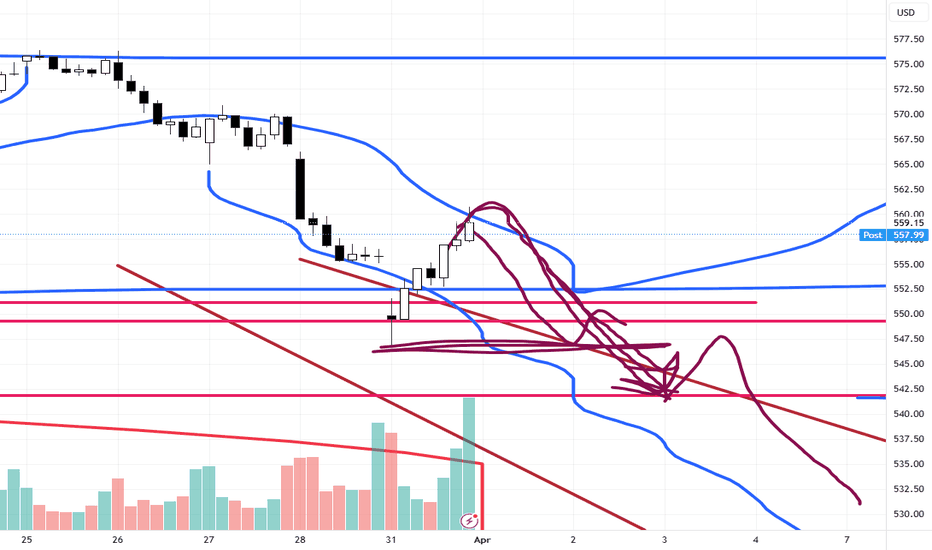
SPY/QQQ Plan Your Trade For 4-2 : GAP Reversal Counter TrendToday's pattern suggests price may attempt to move downward in early trading, trying to find support near recent lows, then potentially roll a bit higher.
I do expect price to move into a downward price trend - attempting to break below the 549 price level and targeting the 535-545 target Fib level this week.
Today, Thursday, and Friday are all GAP/Breakaway types of patterns. So we should be entering an expansion of price trend and I believe that trend will be to the downside.
Gold and Silver are nearing a Flag Apex level. Very exciting for a potential breakout rally driving Gold up above $3250 and Silver up above $36.
I personally believe there is nothing stopping Gold and Silver in this rally phase until Gold reaches levels above $4500. GET SOME.
BTCUSD had a very interesting spike low. I still believe BTCUSD will roll downward - targeting the $76-78k level, then break downward towards the $60k level. Time will tell.
The rest of this week should be very exciting with the Breakaway and GAP patterns.
Get some.
#trading #research #investing #tradingalgos #tradingsignals #cycles #fibonacci #elliotwave #modelingsystems #stocks #bitcoin #btcusd #cryptos #spy #gold #nq #investing #trading #spytrading #spymarket #tradingmarket #stockmarket #silver
SPX to find sellers at previous resistance?SPX500USD - 24h expiry
Daily signals are bearish.
Short term bias has turned negative.
Previous resistance located at 5700.
20 1day EMA is at 5699.8.
5705.4 has been pivotal.
We look to Sell at 5699.5 (stop at 5743.5)
Our profit targets will be 5585.5 and 5565.5
Resistance: 5630.0 / 5658.9 / 5700.0
Support: 5602.4 / 5564.3 / 5495.3
Risk Disclaimer
The trade ideas beyond this page are for informational purposes only and do not constitute investment advice or a solicitation to trade. This information is provided by Signal Centre, a third-party unaffiliated with OANDA, and is intended for general circulation only. OANDA does not guarantee the accuracy of this information and assumes no responsibilities for the information provided by the third party. The information does not take into account the specific investment objectives, financial situation, or particular needs of any particular person. You should take into account your specific investment objectives, financial situation, and particular needs before making a commitment to trade, including seeking advice from an independent financial adviser regarding the suitability of the investment, under a separate engagement, as you deem fit.
You accept that you assume all risks in independently viewing the contents and selecting a chosen strategy.
Where the research is distributed in Singapore to a person who is not an Accredited Investor, Expert Investor or an Institutional Investor, Oanda Asia Pacific Pte Ltd (“OAP“) accepts legal responsibility for the contents of the report to such persons only to the extent required by law. Singapore customers should contact OAP at 6579 8289 for matters arising from, or in connection with, the information/research distributed.
Wall Street vs GoldZilla. The End of 'Irrational Exuberance' Era"Irrational exuberance" is the phrase used by the then-Federal Reserve Board chairman, Alan Greenspan, in a speech given at the American Enterprise Institute during the dot-com bubble of the 1990s. The phrase was interpreted as a warning that the stock market might be overvalued.
Origin
Greenspan's comment was made during a televised speech on December 5, 1996 (emphasis added in excerpt)
Clearly, sustained low inflation implies less uncertainty about the future, and lower risk premiums imply higher prices of stocks and other earning assets. We can see that in the inverse relationship exhibited by price/earnings ratios and the rate of inflation in the past. But how do we know when irrational exuberance has unduly escalated asset values, which then become subject to unexpected and prolonged contractions as they have in Japan over the past decade?
Greenspan wrote in his 2008 book that the phrase occurred to him in the bathtub while he was writing a speech.
The irony of the phrase and its aftermath lies in Greenspan's widely held reputation as the most artful practitioner of Fedspeak, often known as Greenspeak, in the modern televised era. The speech coincided with the rise of dedicated financial TV channels around the world that would broadcast his comments live, such as CNBC. Greenspan's idea was to obfuscate his true opinion in long complex sentences with obscure words so as to intentionally mute any strong market response.
The phrase was also used by Yale professor Robert J. Shiller, who was reportedly Greenspan's source for the phrase. Shiller used it as the title of his book, Irrational Exuberance, first published in 2000, where Shiller states:
Irrational exuberance is the psychological basis of a speculative bubble. I define a speculative bubble as a situation in which news of price increases spurs investor enthusiasm, which spreads by psychological contagion from person to person, in the process amplifying stories that might justify the price increases, and bringing in a larger and larger class of investors who, despite doubts about the real value of an investment, are drawn to it partly by envy of others' successes and partly through a gamblers' excitement.
The main technical graph represents a value of S&P500 Index in Gold troy ounces (current value 1.81 at time of writing this article), indicates that effusive Bull stock market goes collapsing.
--
Best wishes,
Your Beloved @PandorraResearch Team 😎
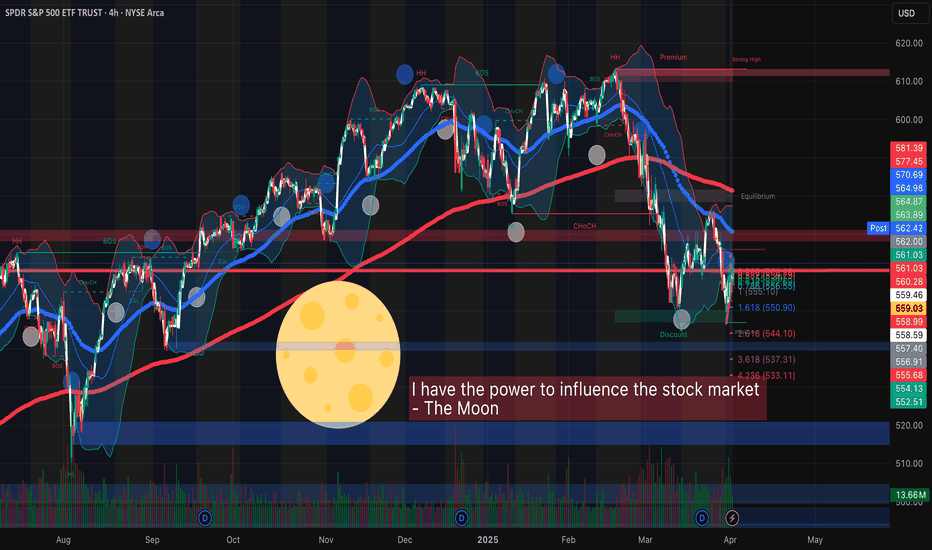
FULL MOON and SPYHello traders! One of the great legends, OSHO, explains that if the moon has enough power to cause turbulence in the oceans, then why can't it affect human beings thinking and behaviors when the human body is made up of roughly 60% water? OSHO further explains that in history many people have been enlightened and many become mentally disturbed on days like a FULL MOON, and he explained that there must be a connection between planets positions and human behaviors.
Now, if it comes to trading SPY based on the moon phases, then I have backtested a few full-moon dates, and I have found something interesting that makes me think of incorporating a full-moon strategy while trading SPY/SPX or any other major index. I am not promoting astrology or abnormal ideas, but I want to share my research with you all because I found a connection and patterns in the behavior of SPY and the full moon. You are not forced to think about astrology in trading, but having knowledge and the ability to see patterns in the world can help you build your intuitive thinking and deep subconscious knowledge.
This year, taking Los Angeles as a reference, full moon dates were on Jan 13, Feb 12, and March 13. On January 13, the price showed a bullish run all day with low and high points of about 575.36 and 581.69, respectively. The similar bullish run was observed on February's full moon day, i.e., on 12th February, when SPY showed a low of 598.41 and a high of 604.52, making the market bullish all day. In contrast, we have observed a sharp decline in SPY on March 13, 2025 (full moon), which could seem to invalidate the full-moon strategy, but in the long run, SPY and the SPX Index remain bullish most of the time.
Carefully observing previous year (2024) full-moon dates, I have found that SPY opened 4 times gap-up on full moon dates (May 23 2024, July 21 2024 (market off but gap-up next session), October 17 2024, December 15 2024 (market off but gap-up next trading session). 5 times out of 12 were classified as bullish to strongly bullish: January 20 2024 (Bullish after 11:00 AM PST), March 25 2024 (sideways market but bullish overall), April 23 2024 (Bullish), August 19 2024 (bullish), and September 18 2024 (bullish after 9:00 AM PST). The market remains gap-down and bearish two times on February 24 2024, and on November 15 2024.
Now, since I have found that the SPX Index remains bullish on most of the FULL MOON dates, and the chances of a gap-up opening on or the next day of the FULL MOON (in case the market is closed on the FULL MOON) are very high based on the results obtained from the PY 2024 and 2025 previous months. The next FULL MOON is on Saturday, 12th April 2025, and the market is closed on this date; therefore, on 14th April 2025, if the market repeats itself, then I can expect SPY to open gap-up, and it would be interesting to see if FULL MOON really has the power to influence the stock market. Let’s give it a try, and on 11th April, 2025, if the market gives signs of huge buying pressure, then I will be buying some calls expiring April 14th, 2025, to test the full moon strategy.
I am the only writer of this article, so there are high chances that I might have made some mistakes while publishing. Therefore, I would be happy to see if you can correct me if I'm wrong or if you can share your own knowledge and insights about the relationship between MOON and SPY. Thoughts and comments?
SPY/QQQ Plan Your Trade For 4-1-25 : Temp Bottom PatternToday's pattern suggests the SPY/QQQ will attempt to find temporary support near recent lows or a bit lower.
I'm not expecting much in terms of price trending today. I do believe the downward price trend will continue today with the SPY attempting to move down to the 548-550 level trying to find support.
The QQQ will likely attempt to move downward toward the 458-460 level trying to find the support/base/bottom level today.
Gold and Silver are in a moderate consolidation phase that I believe is transitioning through a Flag-Trend-Flag-Trend-Flag-Trend type of phase. Ultimately, the trend will continue to push higher through this phase as metals have moved into the broad Expansion phase. This phase should see gold attempt to move above $4500+ before the end of May/June 2025.
BTCUSD is rolling within the 0.382 to 0.618 Fibonacci price levels related to the last price swing. I see this middle Fib level and the "battle ground" for price. I expect price to stall, consolidate, and roll around between these levels trying to establish a new trend.
Thus, I believe BTCUSD will move downward, attempting to move back down to the $78,000 level.
Nothing has really changed in my analysis except that we are experiencing a 48-96 hour consolidation phase before we move back into big trending.
Play smart. Position your trades so that you can profit from this rolling price trend and prepare for the bigger price move downward (targeting the bigger base/bottom near April 15, 2025).
Get some.
#trading #research #investing #tradingalgos #tradingsignals #cycles #fibonacci #elliotwave #modelingsystems #stocks #bitcoin #btcusd #cryptos #spy #gold #nq #investing #trading #spytrading #spymarket #tradingmarket #stockmarket #silver
S&P INTRADAY awaits tariffs clarity capped by 5711Resistance Level 1: 5711
Resistance Level 2: 5788
Resistance Level 3: 5863
Support Level 1: 5487
Support Level 2: 5412
Support Level 3: 5262
This communication is for informational purposes only and should not be viewed as any form of recommendation as to a particular course of action or as investment advice. It is not intended as an offer or solicitation for the purchase or sale of any financial instrument or as an official confirmation of any transaction. Opinions, estimates and assumptions expressed herein are made as of the date of this communication and are subject to change without notice. This communication has been prepared based upon information, including market prices, data and other information, believed to be reliable; however, Trade Nation does not warrant its completeness or accuracy. All market prices and market data contained in or attached to this communication are indicative and subject to change without notice.
ES1 2025-03-31 SPOOZ 15minOBHello everyone, I hope you won, stayed out, or learned something form the market today 😂.
Today was a easy grab.
Drawdown: 17. Tics
TP: 111. Tics Grabbed (out of 438)
Spooz Open Manipulation,
Broke near high,
Retraced to 15min Order Block,
TP Hit at 3 equal Highs (volume).
If you found this inciteful, join our group discussion! (link in bio)
SPY/QQQ Plan Your Trade EOD Update : Rejecting The BreakdownDoes this big rejection bar mean the selling trend is over?
I doubt it.
In my opinion and experience, big rejection bars like this reflect a critical price level where the markets will attempt to REVISIT in the near future.
Normally, when we get a big rejection bar, like today, we are testing a critical support/resistance level in price and you can see the difference between the SPY, DIA and QQQ charts.
The QQQ price data is already below the critical support level and barely trying to get back above the rejection level. Whereas the SPY and DIA are still above the rejection lows.
I see this as a technology driven breakdown and because of the continued CAPTIAL SHIFT, we may move into a broader WAVE-C breakdown of this current trend.
I see the SPY already completing a Wave-A and Wave-B. If this breakdown plays out like I expect, we'll see a bigger breakdown in price targeting $525-535, then possibly reaching $495-505 as the immediate ultimate low.
If you follow my research, there is a much lower level near $465-475 that is still a likely downward target level, but we'll have to see how price reacts over the next 2+ days before we can determine if that level is still a valid target.
Watch for more support near recent lows tomorrow, then a potential breakdown in the SPY/QQQ/DIA.
Get some.
#trading #research #investing #tradingalgos #tradingsignals #cycles #fibonacci #elliotwave #modelingsystems #stocks #bitcoin #btcusd #cryptos #spy #gold #nq #investing #trading #spytrading #spymarket #tradingmarket #stockmarket #silver
S&P500 INTRADAY down 1% in pre market tradingS&P 500 futures are down 1%, with global markets falling on US tariff concerns and tech weakness (Nasdaq 100 -1.4%, Nvidia & Tesla -3% premarket). The S&P 500 is down 5.1% for Q1, its worst quarter since 2022, as uncertainty over Trump’s tariff plans (starting April 2) and a potential Russian oil ban weigh on sentiment.
Key Support and Resistance Levels
Resistance Level 1: 5711
Resistance Level 2: 5788
Resistance Level 3: 5863
Support Level 1: 5487
Support Level 2: 5412
Support Level 3: 5262
This communication is for informational purposes only and should not be viewed as any form of recommendation as to a particular course of action or as investment advice. It is not intended as an offer or solicitation for the purchase or sale of any financial instrument or as an official confirmation of any transaction. Opinions, estimates and assumptions expressed herein are made as of the date of this communication and are subject to change without notice. This communication has been prepared based upon information, including market prices, data and other information, believed to be reliable; however, Trade Nation does not warrant its completeness or accuracy. All market prices and market data contained in or attached to this communication are indicative and subject to change without notice.
SPY/QQQ Plan Your Trade For 3-31 : Carryover PatternToday's pattern suggests the SPY/QQQ will attempt to carryover Friday's selling trend.
I do believe the SPY/QQQ will attempt to find some support as we move into a Temp Bottom pattern tomorrow. So be aware that the SPY/QQQ may attempt to find support near 535-540/450-455 over the next few days.
I would also urge traders to not get very aggressive in terms of trying to pick a bottom in this downtrend.
In my opinion, I don't see any reason why anyone should be buying into this breakdown unless you are prepared to take a few big lumps. Just wait it out - wait for a base/bottom to setup.
Gold and Silver are moving higher and I believe this trend will continue for many weeks/months.
BTCUSD should continue to move downward - trying to establish the Consolidation Phase range.
As we move into trading this week. Be aware that Tuesday/Wednesday of this week are more ROTATION type days. They may be wide-range days - but they are still going to be ROTATIONAL.
Get some.
#trading #research #investing #tradingalgos #tradingsignals #cycles #fibonacci #elliotwave #modelingsystems #stocks #bitcoin #btcusd #cryptos #spy #gold #nq #investing #trading #spytrading #spymarket #tradingmarket #stockmarket #silver
How low will it go? The S&P Bear MarketI don't believe the market has bottomed yet. There is more to come.
Trump's tariffs will continue to cause uncertainty and as economic figures confirm a US slowdown, stock markets could fall further.
From a technical perspective, I will be looking to buy between 4700 and 5200. This is based on evident weekly horizontal levels, bullish channel support, and 100 and 200 SMA's.
VANTAGE:SP500 PEPPERSTONE:US500 ICMARKETS:US500 OANDA:SPX500USD
SPX500 Long at 55301. All timeframes are massively oversold due to the huge sell-off on Friday night
2. It is the start of the week, and it opened at the low, which tends to mean there would be some strength to go up
3. Unfortunately, I cannot check if there is a harmonic pattern due to technical difficulties.
4. This is at excellent support as it is at the year low
5. There is a lot of divergence due to this not being a long consolidation try to exit at M15 overbought
6. Stop loss below 5500
Stock Markets Decline Amid Trump Tariff NewsStock Markets Decline Amid Trump Tariff News
Comparing the approximate difference between last week's opening and closing prices on stock index charts:
➝ The US S&P 500 (US SPX 500 mini on FXOpen) fell by 2.4%.
➝ The European Euro Stoxx 50 (Europe 50 on FXOpen) dropped by 2%.
Why Are Stocks Falling?
The bearish sentiment in stock markets is largely driven by news surrounding White House tariff policies, as reflected in Federal Reserve statements late last week:
➝ Boston Fed President Susan Collins stated that tariffs will "inevitably" fuel inflation, at least in the short term.
➝ Richmond Fed President Thomas Barkin noted that rapid shifts in US trade policy have created uncertainty for businesses.
US developments are also weighing on European stock markets, which were already under pressure following President Donald Trump’s announcement of a 25% tariff on foreign cars. Trump has also threatened further tariffs on the EU and Canada, heightening trade tensions.
Today, the Euro Stoxx 50 index opened with a bearish gap, hitting its lowest level since early 2025, falling below the previous yearly low of 5,292. This reflects growing market concerns ahead of 2 April, when Trump is expected to confirm the implementation of new tariffs.
Technical Analysis of the Euro Stoxx 50 Index (Europe 50 on FXOpen)
Since late 2024, the price has been moving within an ascending channel (marked in blue), but today, it has fallen below the lower boundary—suggesting the channel is losing relevance. Bearish dominance is evident through the following signals:
➝ The 5,550 level proved to be an insurmountable resistance for bulls.
➝ The median of the blue channel acted as resistance (marked by a red arrow).
➝ The 5,406 level shifted from support to resistance (marked by black arrows).
If the bearish trend persists, the Euro Stoxx 50 index (Europe 50 on FXOpen) could continue fluctuating within a descending channel (outlined in red).
This article represents the opinion of the Companies operating under the FXOpen brand only. It is not to be construed as an offer, solicitation, or recommendation with respect to products and services provided by the Companies operating under the FXOpen brand, nor is it to be considered financial advice.
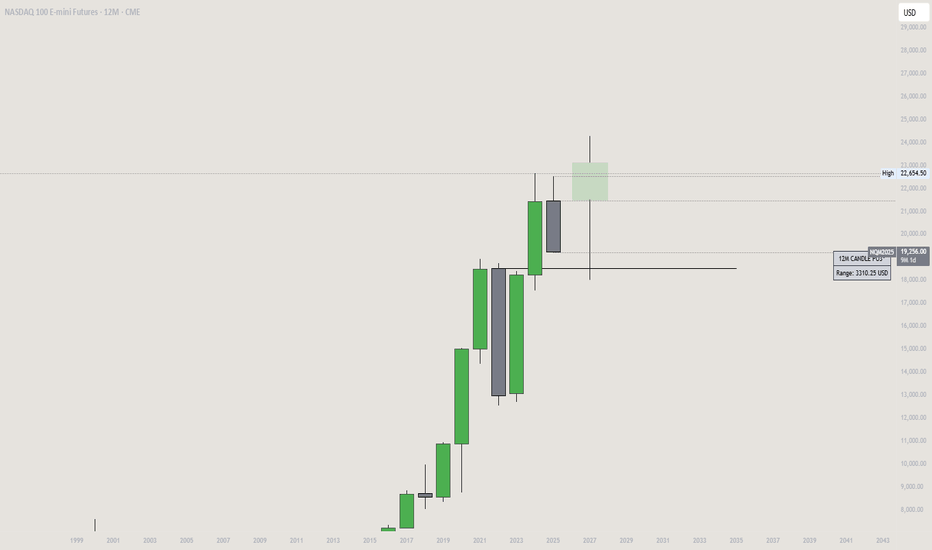
Yearly Candle on NQ 2025I believe what we're seeing right now is simply the market printing the “open low” of the yearly candle. The recent dip seems driven by short-term fear surrounding the new tariffs, but in my view, this is just noise. Long-term, this sets up a bullish scenario.
Businesses won’t adjust overnight—it takes time to shift operations away from high-tariff regions. But as that transition unfolds, we’ll likely see improved margins and stronger fundamentals emerge.
From a technical standpoint, I’m watching for a key reversal after price revisits the order block. If we get that reaction, it could mark the beginning of a broader move higher. This looks like manipulation, not distribution.
OLHC
- Gavin
NFA, DYOR
Update about my previous warning about a crash of the SPX500📉 SPX500 Major Correction: Scenario 1 or 2?
In my previous analysis, I explained a scenario that could mimic the 2022 crash (Scenario 1):
🔗
However, the price action dropped much faster than in 2022, accelerating the correction.
Now, on the daily timeframe, we already have a bullish MACD crossover, signaling a potential bullish trend for several days:
🔗
Could This Invalidate the Bearish Trend?
✅ Yes, absolutely.
In June 2023 (Scenario 2), a similar situation occurred:
A bearish MACD reset was interrupted mid-course by a violent dump
This triggered a strong rebound, breaking through resistance levels
There are now strong signs that Scenario 2 might play out again.
What Does This Mean for Crypto & TradFi?
📈 If this bullish reversal holds, it could sync Crypto & TradFi, with both gaining bullish momentum on the weekly timeframe, peaking around May 2025.
Two Possible Outcomes:
1️⃣ Scenario 1 – The reversal collapses, and the correction continues 📉
2️⃣ Scenario 2 – The reversal holds, leading to a rally 📈
Let’s monitor this closely to see which scenario unfolds.
🔍 DYOR!
#SPX500 #StockMarket #Crypto #Trading #BullishReversal #BearishTrend #MACD #MarketAnalysis #Investing


