TESLA is up 47X vs the SPX. Can it do another 6.9X?An extraordinary unicorn enterprise, or a collection of companies and intellectual properties, led by the most prominent CEO in the history of public companies.
TESLA and ELON are impossible to overlook, and this chart has kept many observers on the sidelines for over 14 years. In the initial 6 to 9 years, Wall Street analysts and commentators failed to grasp the bigger picture, focusing excessively on the balance sheet and evaluating the company merely as an automaker. They completely missed the groundbreaking technologies being developed and advanced.
Today, we stand on the brink of fully autonomous vehicles becoming commonplace, artificial intelligence integrating into our everyday lives, and affordable space exploration becoming a reality, not to mention the myriad of other innovative technologies emerging from this remarkable company.
Individuals often enjoy predicting market peaks and labeling stocks as overvalued.
However, this chart comparing Tesla to the S&P 500 indicates that the stock may be gearing up for another surge to new heights.
Picture 10 million robotaxis cruising through our streets.
Envision a fleet of vehicles that not only generates income but also undergoes upgrade cycles, in contrast to traditional cars that face maintenance cycles, and are bogged down by Human operator's.
This development is poised to significantly transform the self-hailing ride-sharing market and the food delivery sector, potentially eliminating the role of human drivers.
In fact, Uber could very well become Tesla's largest client!
S&P 500 (SPX500)

SPY Price Projection: Mid-2025 TargetRevealing Market Trends: Logarithmic Regression Analysis Indicates Bullish Path for SPY
In the ever-evolving realm of financial analysis, the search for reliable predictions remains ongoing. Logarithmic scale regression analysis, coupled with potent indicators, has emerged as a promising tool for discerning trends, particularly regarding assets like the SPY.
This analysis delves into the utilization of logarithmic scale regression alongside two robust indicators, offering insights into the potential trajectory of the SPY's price movement. It's essential to note that the interpretations and predictions presented are based on my analysis alone and should not be construed as financial advice. As with any market analysis, uncertainties persist, and actual outcomes may diverge from projections.
Logarithmic scale regression accounts for the exponential nature of price movements, providing a nuanced perspective on long-term trends. When combined with indicators such as moving averages or momentum oscillators, the analysis gains depth, revealing not only the direction but also the strength of the trend.
After meticulous examination of historical data and the application of analytical tools, our analysis suggests a bullish trajectory for the SPY, with a projected price nearing 620 EUR by mid-2025. This projection implies a significant uptrend from the current date, with a potential increase of approximately 20% over the specified timeframe.
However, it's crucial to approach such forecasts with caution, recognizing the inherent risks associated with financial markets. While our analysis indicates a positive outlook, market conditions can change rapidly, leading to deviations from expected trends.
In summary, logarithmic scale regression analysis, supported by robust indicators, offers valuable insights into market trends and potential price movements. While our analysis suggests a bullish sentiment for the SPY, investors should conduct thorough research and seek professional advice before making investment decisions.
Disclaimer: The analysis provided is based on personal interpretation and should not be considered financial advice. Investing in financial markets carries risks, and actual outcomes may differ. Readers are encouraged to conduct their own research and consult with financial professionals before making investment decisions.

S&P 500 Daily Chart Analysis For Week of March 28, 2025Technical Analysis and Outlook:
During this week's trading session, the Index gapped higher, passing our completed Inner Index Rally of 5712 and setting a Mean Resistance of 5768. This target was accompanied by considerable reversal, ultimately causing a downward movement. On the final trading day of the week, the Index underwent a pronounced decline, resulting in a substantial drop that surpassed the critical target of Mean Support set at 5603. The Index is positioned to retest the completed Outer Index Dip level of 5520. An extended decline is feasible, with the possibility of targeting the subsequent Outer Index Dip at 5403 before resuming an upward rally from either of these Outer Index Dip levels.

The possibility of the upward correction ending and the decline Considering the zone marked on the chart and considering that the price has seen a lower low, it seems that the upward correction in the price will end soon and we should wait for a new downward movement. Targets and stop loss of my position are marked on the chart.

SPY/QQQ Plan Your Trade For 3-28-25 EOD Review : Brutal SellingI sure hope all of you were able to profit from this big selling trend today.
And I also hope you didn't get trapped in the potential for a base/bottom rally off the recent lows.
This move downward reminds me of the 2022-2023 downward trending pattern when the Fed was raising rates.
What Trump is doing with tariffs is very similar. It is slowing the economy in a way that will not break it - but it will result in slower, more costly, economic function.
Watch this video and I sure hope all of you have great (profitable) stories to share with me today.
I know I do. And, I'm positioned for the weekend. Ready to profit no matter what the markets do.
Get some.
#trading #research #investing #tradingalgos #tradingsignals #cycles #fibonacci #elliotwave #modelingsystems #stocks #bitcoin #btcusd #cryptos #spy #gold #nq #investing #trading #spytrading #spymarket #tradingmarket #stockmarket #silver

S&P to find buyers at current market price?US500 - Intraday
Closed the day little net changed.
An overnight negative theme in Equities has led to a lower open this morning.
Immediate signals are hard to interpret.
Bespoke resistance is located at 5853.
Bespoke support is located at 5536.
Dips continue to attract buyers.
We look to Buy at 5609 (stop at 5572)
Our profit targets will be 5719 and 5853
Resistance: 5719 / 5737 / 5853
Support: 5616 / 5607 / 5536
Risk Disclaimer
The trade ideas beyond this page are for informational purposes only and do not constitute investment advice or a solicitation to trade. This information is provided by Signal Centre, a third-party unaffiliated with OANDA, and is intended for general circulation only. OANDA does not guarantee the accuracy of this information and assumes no responsibilities for the information provided by the third party. The information does not take into account the specific investment objectives, financial situation, or particular needs of any particular person. You should take into account your specific investment objectives, financial situation, and particular needs before making a commitment to trade, including seeking advice from an independent financial adviser regarding the suitability of the investment, under a separate engagement, as you deem fit.
You accept that you assume all risks in independently viewing the contents and selecting a chosen strategy.
Where the research is distributed in Singapore to a person who is not an Accredited Investor, Expert Investor or an Institutional Investor, Oanda Asia Pacific Pte Ltd (“OAP“) accepts legal responsibility for the contents of the report to such persons only to the extent required by law. Singapore customers should contact OAP at 6579 8289 for matters arising from, or in connection with, the information/research distributed.

SPY/QQQ Plan Your Trade For 3-28-25 : Carryover in Counter TrendToday's pattern suggests the SPY/QQQ will attempt to move downward in early trading. The SPY may possibly target the 564-565 level before finding support. The QQQ may possibly attempt to target the 475-476 level before finding support.
Overall, the downward trend is still dominant.
I believe the SPY/QQQ may find some support before the end of trading today and attempt to BOUNCE (squeeze) into the close of trading.
Gold and Silver are RIPPING higher. Here we go.
Remember, I've been telling you of the opportunities in Gold/Silver and other market for more than 5+ months (actually more than 3+ years). This is the BIG MOVE starting - the BIG PARABOLIC price rally.
BTCUSD has rolled downward off the FWB:88K level - just like I predicted. Now we start the move down to the $78k level, then break downward into the $58-62k level looking for support.
Love hearing all of your success stories/comments.
GET SOME.
Happy Friday.
#trading #research #investing #tradingalgos #tradingsignals #cycles #fibonacci #elliotwave #modelingsystems #stocks #bitcoin #btcusd #cryptos #spy #gold #nq #investing #trading #spytrading #spymarket #tradingmarket #stockmarket #silver

S&P 500 Struggling Ahead of Key Economic ReportsThe S&P 500 is showing signs of weakness as it approaches a critical juncture ahead of tomorrow’s economic reports. After a sharp V-shaped recovery, the index is now facing resistance and struggling to maintain upward momentum. If key support levels fail to hold, we could see further downside in the coming sessions.
Key Levels to Watch:
5,700 - 5,720: A significant resistance zone where recent rallies have stalled. A break above this level could signal renewed bullish momentum.
5,650 - 5,670: A minor support area that previously acted as a pivot. Losing this level could increase selling pressure.
5,520 - 5,504: A major support zone that must hold to prevent further downside. If broken, it could trigger a larger sell-off.
5,350 - 5,400: A potential next area of support if the index continues to slide. This level aligns with previous consolidation zones.
4,790 - 4,800: A worst-case scenario target if market sentiment deteriorates significantly.
Technical Breakdown:
The current price action suggests a potential reversal if support levels do not hold. The index has failed to reclaim key resistance and is now at risk of breaking down further. Volume has increased during recent selling, indicating stronger downside pressure.
The next move will likely be dictated by tomorrow’s reports. If economic data comes in weaker than expected, it could fuel concerns of a slowdown, leading to further selling. Conversely, stronger-than-expected data may provide temporary relief, but resistance levels still need to be reclaimed for the uptrend to resume.
Market Sentiment and Strategy:
A break below 5,504 could trigger a wave of selling, making downside targets more likely.
If support holds and we see a strong bounce, it could offer a short-term buying opportunity.
Given increased volatility, traders should be cautious and monitor key levels closely.
With economic data on the horizon, the S&P 500 is at a critical decision point. The next 24-48 hours will determine whether the recent recovery holds or if further downside is ahead.

SPX a brear flag complete?SPX is going to finish a bear flag and could break down. The Vix is also showing slight upward strength but not much yet. Based on that I don't think we have much downside now in next 2/3 months. However the overall trend of VIX is trending upwards similar to 2022 making higher bottoms since Dec 24, So we could have a year with big swings like we did in 2022

SPX - Where Rebound?Possible reversal level is at the lower boundary of the channel in wave 4 of the upper order

Daily Trade Recap based on VX Algo SystemEOD accountability report: +$786.25
Sleep: :ok: Overall health: Day 1 of fasting, edgy as f
I finally got to test Caffeine and lions mane on an empty stomach and it was crazy, really sharp focus but jumpy as well.
We started the day off pretty scary, Huge drop to 5720 and instant recovery to the top. Traded a bit on one of my APEX evals that renewed today but
Didn't really touch the funded account until 11:20 when we hit the 48m resistance and got a 10m signal.
Overall day was pretty decent, 10m and 5 m chart worked really well.
Daily Trade Recap based on VX Algo System
9:50 AM VXAlgo ES 10M Buy signal 2x
11:10 AM VXAlgo ES 10M Sell Signal 2x
12:24 PM Market Structure flipped bearish on VX Algo X3!

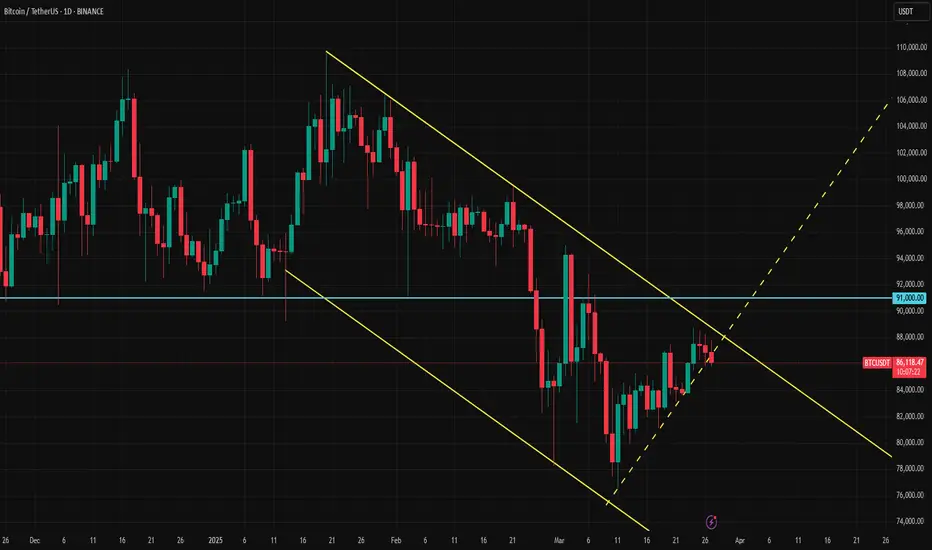
Bitcoin Tests the Trendline as Trade War Fears IntensifyBitcoin is near a decision point. The market's reaction to the new tariffs came at a bad time. The daily timeframe downtrend line is being tested, and the short-term uptrend that carried the price to the trend line seems to be about to break. In that case, Bitcoin bulls are about to face pain, again.
The SP:SPX is still the main catalyst for the crypto market. The newest auto tariffs are a problem, and if the EU strikes back hard with the Anti-Coercion Instrument, the bad scenario might come to pass. In the next seven days, volatility could rise.
For an upside relief, Bitcoin should break both the trendline and the 91,000 resistance.
S&P INTRADAY - Stronger Growth, Labour Market ResilientUS Q4 GDP (Annualized) came in at 2.4%, beating forecasts of 2.3%, signalling resilient economic growth despite higher interest rates. A stronger-than-expected economy supports corporate earnings but may also reinforce the Fed’s cautious stance on rate cuts.
Initial Jobless Claims (4-week average) declined to 224K from 227K, pointing to continued labor market strength. A tight job market supports consumer spending, which is crucial for corporate revenue but may keep inflationary pressures elevated, influencing Fed policy expectations.
Market Impact:
S&P 500: The better-than-expected GDP and healthy labor market data suggest economic momentum remains intact, supporting corporate earnings and risk appetite. However, persistent strength may delay Fed rate cuts, potentially leading to market volatility.
Key Support and Resistance Levels
Resistance Level 1: 5780
Resistance Level 2: 5844
Resistance Level 3: 5920
Support Level 1: 5660
Support Level 2: 5604
Support Level 3: 5540
This communication is for informational purposes only and should not be viewed as any form of recommendation as to a particular course of action or as investment advice. It is not intended as an offer or solicitation for the purchase or sale of any financial instrument or as an official confirmation of any transaction. Opinions, estimates and assumptions expressed herein are made as of the date of this communication and are subject to change without notice. This communication has been prepared based upon information, including market prices, data and other information, believed to be reliable; however, Trade Nation does not warrant its completeness or accuracy. All market prices and market data contained in or attached to this communication are indicative and subject to change without notice.

SPY/QQQ Plan Your Trade For 3-27-25 : Breakaway PatternToday's Breakaway pattern suggests the markets will continue to melt downward (possibly attempting to fill the Gap from March 24).
I strongly believe the SPY/QQQ are completing the "rolling top" pattern I suggested would happen near or after the March 21-24 TOP pattern my deeper cycle research suggested was likely.
At this point, things are just starting to line up for a broader market decline while the current EPP pattern plays out as a Breakdown of the EPP Flagging formation (moving into consolidation).
Gold and Silver are RIPPING higher. Yes, I do expect a little bit of volatility near these recent highs. But, I also expect metals to continue to rally higher from these levels over the next 10-15+ days. Watch the video.
Bitcoin is stalling/topping - just as I suggested it would months ago.
Now we see how the market move into this new trending phase and how far this current trend will drive price trends. I believe the SPY/QQQ/Bitcoin will all continue to move downward while Gold/Silver move (RIP) higher on this breakaway move.
This is a PERFECT trader's market.
Get some.
#trading #research #investing #tradingalgos #tradingsignals #cycles #fibonacci #elliotwave #modelingsystems #stocks #bitcoin #btcusd #cryptos #spy #gold #nq #investing #trading #spytrading #spymarket #tradingmarket #stockmarket #silver

SPX500 H4 | Bullish uptrend to extend further?SPX500 is falling towards a pullback support and could potentially bounce off this level to climb higher.
Buy entry is at 5,704.90 which is a pullback support.
Stop loss is at 5,590.00 which is a level that lies underneath an overlap support and the 61.8% Fibonacci retracement.
Take profit is at 5,848.75 which is an overlap resistance that aligns close to the 50.0% Fibonacci retracement.
High Risk Investment Warning
Trading Forex/CFDs on margin carries a high level of risk and may not be suitable for all investors. Leverage can work against you.
Stratos Markets Limited (www.fxcm.com):
CFDs are complex instruments and come with a high risk of losing money rapidly due to leverage. 63% of retail investor accounts lose money when trading CFDs with this provider. You should consider whether you understand how CFDs work and whether you can afford to take the high risk of losing your money.
Stratos Europe Ltd (www.fxcm.com):
CFDs are complex instruments and come with a high risk of losing money rapidly due to leverage. 63% of retail investor accounts lose money when trading CFDs with this provider. You should consider whether you understand how CFDs work and whether you can afford to take the high risk of losing your money.
Stratos Trading Pty. Limited (www.fxcm.com):
Trading FX/CFDs carries significant risks. FXCM AU (AFSL 309763), please read the Financial Services Guide, Product Disclosure Statement, Target Market Determination and Terms of Business at www.fxcm.com
Stratos Global LLC (www.fxcm.com):
Losses can exceed deposits.
Please be advised that the information presented on TradingView is provided to FXCM (‘Company’, ‘we’) by a third-party provider (‘TFA Global Pte Ltd’). Please be reminded that you are solely responsible for the trading decisions on your account. There is a very high degree of risk involved in trading. Any information and/or content is intended entirely for research, educational and informational purposes only and does not constitute investment or consultation advice or investment strategy. The information is not tailored to the investment needs of any specific person and therefore does not involve a consideration of any of the investment objectives, financial situation or needs of any viewer that may receive it. Kindly also note that past performance is not a reliable indicator of future results. Actual results may differ materially from those anticipated in forward-looking or past performance statements. We assume no liability as to the accuracy or completeness of any of the information and/or content provided herein and the Company cannot be held responsible for any omission, mistake nor for any loss or damage including without limitation to any loss of profit which may arise from reliance on any information supplied by TFA Global Pte Ltd.
The speaker(s) is neither an employee, agent nor representative of FXCM and is therefore acting independently. The opinions given are their own, constitute general market commentary, and do not constitute the opinion or advice of FXCM or any form of personal or investment advice. FXCM neither endorses nor guarantees offerings of third-party speakers, nor is FXCM responsible for the content, veracity or opinions of third-party speakers, presenters or participants.

S&P 500 Correction Channel Keeps Bulls in Control, for NowThe S&P 500 has formed an uptrend channel after breaking out of the "tariff panic" downtrend, which had dragged the index down more than 10%. But is this new short-term uptrend merely a correction, or has the real direction changed? That’s the key question, one that will likely be answered in early April when the new tariffs take effect.
February consumer confidence data didn’t look promising, but much of the negativity had already been priced in during the earlier 10% sell-off. However, this week’s PCE report, combined with next week’s tariffs and jobs report, could become a catalyst for determining the short- to medium-term direction.
The 200-hour SMA has now reached the upper line of the trend channel. Together, they may create a strong resistance level. To the downside, 5700 is a key horizontal support level. By the end of this week, it will converge with the lower boundary of the channel, right as both the GDP and PCE data are released. Including the time factor, this confluence could mark the main short-term support.
As long as the trend channel holds, bulls remain in control.

SP500US Markets has pulled back nicely, It now provides a wonderful opportunity to get back into the market, I expect another drop to take the previous low set couple of days ago. April tends to be a good month for indices as the first quarter closer and rebalancing occured.
my plan would be to buy the SP500 and ride the trend

A short on S&P at 5770S&P has been moving up quick strongly over the past few days. It has reached a level that is a strong resistance and we will show this pair today.
1) There is deep crab pattern
2) H1 is overbought
3) There is RSI divergence on M15, M30 and H1
We will take profit when RSI is oversold.

Daily Trade Recap based on VX Algo SystemEOD accountability report: +$790
Sleep: Great Overall health: :check:
Overall pretty decent trading day, spotted long term sell signals on market across the board this morning pre market so I was expecting thing to be bearish and drop. It played out as expected and helped with the trades today as thing went according to plan most of the time.
I did expect a V shape recovery at some point but that didnt happen.
Daily Trade Recap based on VX Algo System
10:36 AM VXAlgo NQ 10M Buy Signal,( didn't work that well)
1:30PM 10min MOB bounce :check:
2:09 PM VXAlgo ES 10M Buy signal + 10min MOB (Double Signal) :check:
3:36 PM VXAlgo NQ 48M Buy Signal :check:

S&P500 - Donald Trump Is Crashing Markets!S&P500 ( TVC:SPX ) is starting a correction:
Click chart above to see the detailed analysis👆🏻
Since Donald Trump was elected the markets have been super volatile and clearly not too easy to trade. But now it seems like bears are slowly taking over the entire U.S. stock market after we just saw a drop of -10% within a couple of days and a correction becomes more and more likely.
Levels to watch: $6.100, $4.800
Keep your long term vision,
Philip (BasicTrading)

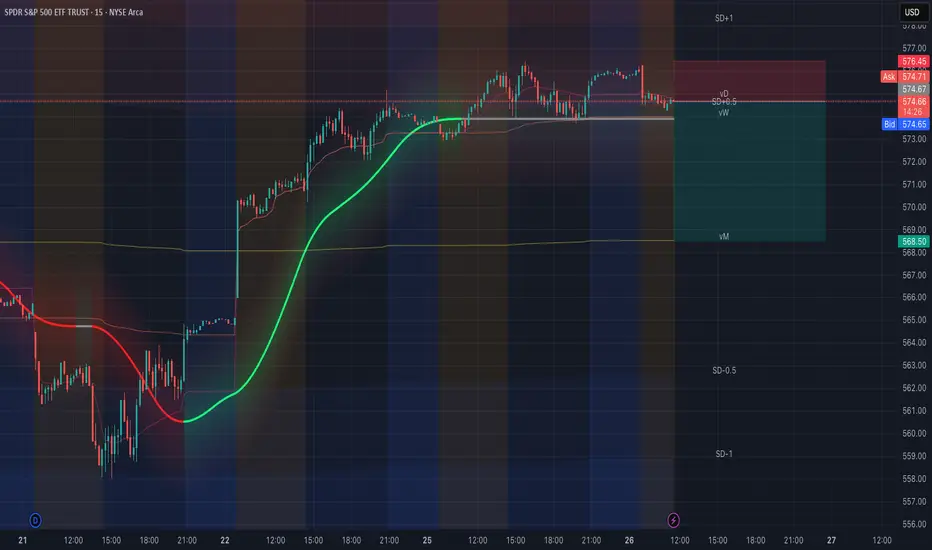
SPY 03/26Looks like it's about to roll down. First target would be monthly VWAP. Not financial advice. Could also range a little bit longer.
S&P 500 eases back from 200-dayThe S&P 500 has been on an impressive two-week rally but is now encountering a crucial resistance zone. The index is currently testing resistance near the 200-day moving average and a previous support level in the 5770-5800 range. This key area, highlighted in grey on the chart, could determine whether the recent bullish momentum continues.
Meanwhile, support is found around 5695-5670, marked in blue on the chart. This zone is significant as it previously served as the launch point for the post-election rally before it lost steam. Reclaiming this level is a bullish signal, but the S&P 500 needs to stay above it through to next week to maintain its upward trajectory.
If support at 5695-5670 fails, the bulls could face serious headwinds. A breakdown at this level may trigger renewed selling pressure, similar to the declines seen in previous weeks. The situation could worsen if the index falls below 5600, which was Friday’s low, when a hammer candle was formed.
By Fawad Razaqzada, market analyst with FOREX.com

SPY/QQQ Plan Your Trade for 3-26-25 : Flat-Down PatternToday's Flat-Down pattern for the SPY/QQQ suggests the markets will consolidate in a sideways channel, generally drifting downward.
As I've been warning all of you for the past month+, the market will likely roll over into a topping formation over the next few days, then start an aggressive downward trend targeting $525-535 on the SPY.
Today's video covers some details related to my expectations and how traders can prepare for the bigger moves I see pending.
Gold and Silver are poised for a potentially BIG BREAKOUT move to the upside. And I still believe Gold/Silver are going to rally another 15-20% within the next 30-45 days.
Bitcoin should follow the SPY/QQQ into a "rollover top" type of pattern then shift into a downward price trend over the next few days.
Everything is following my predictions/expectations almost perfectly.
Now, we try to profit from some of these big moves.
Go get some.
#trading #research #investing #tradingalgos #tradingsignals #cycles #fibonacci #elliotwave #modelingsystems #stocks #bitcoin #btcusd #cryptos #spy #gold #nq #investing #trading #spytrading #spymarket #tradingmarket #stockmarket #silver
