S&P500 The Week Ahead 24th March '25S&P500 bearish & oversold, the key trading level is at 5766
This communication is for informational purposes only and should not be viewed as any form of recommendation as to a particular course of action or as investment advice. It is not intended as an offer or solicitation for the purchase or sale of any financial instrument or as an official confirmation of any transaction. Opinions, estimates and assumptions expressed herein are made as of the date of this communication and are subject to change without notice. This communication has been prepared based upon information, including market prices, data and other information, believed to be reliable; however, Trade Nation does not warrant its completeness or accuracy. All market prices and market data contained in or attached to this communication are indicative and subject to change without notice.
S&P 500 (SPX500)

S&P 500 Daily Chart Analysis For Week of March 21, 2025Technical Analysis and Outlook:
During the course of this week's trading session, the S&P 500 achieved the designated target for the Inner Index Rally at 5576, which occurred midweek. This target was accompanied by considerable volatility, ultimately hindering upward movement. On the week's final trading day, the index experienced a notable decline, resulting in a significant drop that reached our critical target, Mean Support, at 5603.
Consequently, the index is now poised to target a retest of the Inner Index Rally level 5712, with a subsequent potential target identified at the Mean Resistance level 5840. It is essential to consider that upon reaching the Inner Index Rally target of 5712, a decrease in the current price level is anticipated, which may lead to a retest of the Mean Support at 5601. Furthermore, an extended decline is possible to revisit the completed Outer Index Dip at 5520 before the resumption of an upward rally.

S&P500 INTRADAY Bearish oversold bounce back Key Support and Resistance Levels
Resistance Level 1: 5714
Resistance Level 2: 5770
Resistance Level 3: 5872-5920
Support Level 1: 5500
Support Level 2: 5387
Support Level 3: 5254
This communication is for informational purposes only and should not be viewed as any form of recommendation as to a particular course of action or as investment advice. It is not intended as an offer or solicitation for the purchase or sale of any financial instrument or as an official confirmation of any transaction. Opinions, estimates and assumptions expressed herein are made as of the date of this communication and are subject to change without notice. This communication has been prepared based upon information, including market prices, data and other information, believed to be reliable; however, Trade Nation does not warrant its completeness or accuracy. All market prices and market data contained in or attached to this communication are indicative and subject to change without notice.

German $DAX ($EWG) Topping Out?Originally posted on 3/12, but blocked b/c I referenced my X account. Looks like a bearish move could be materializing alongside broader risk asset weakness:
Is the XETR:DAX topping out? Monthly RSI @ 80+ w/ weekly nosing over and daily bearish divergences observable. Index high from 3/6 coincided with the 261.8% Fibonacci extension of the 11/2021-10/2022 uptrend correction.
Confirmation short setup could materialize $FDAX closes below pivot low of the 1D uptrend (22226), bounces off of short-term demand (ex: 22142-21691, and trades into supply ≥ 22226. This scenario is speculative - the market needs to show its hand.
Presently, DAX is up > 1.5% alongside US stocks, which dipped into intermediate-term demand and benefited from softer-than-expected CPI prints. However, DAX (and domestic) bulls haven't proven anything yet. Unless buyers manage to push the DAX higher - initially above 22900 and secondarily through 23000-23200 - on accelerating momentum, risk remains to the downside (IMO). German stocks have been global relative strength leaders as of late, so if they do correct, other equity indexes may retreat in tandem.
Long-term charts for US indices ( SP:SPX , NASDAQ:NDX , TVC:RUT ) look more bearish vs. bullish (I still have some shorts on), though a near-term recovery is plausible. If domestic equities do trade lower, selling could materialize in Asian and European markets. Use LTF charts to monitor price action/manage risk and splice into shorts if German stocks AMEX:EWG start to crack.
My $0.02. Feedback welcome.
Jon

SPX500 2nd Leg Down? 21 Mar 2025
Yesterday's candlestick closed as a bull bar in its lower half with a long tail above.
In yesterday's report, we said traders would see if the bulls could create a strong retest of yesterday's (Mar 19) high followed by a breakout above. Or if the retest would lack follow-through buying, stalling around or slightly above yesterday's high area.
The market formed a retest of the March 19 high, but stalled and formed a lower high.
We said the move while strong, likely was simply a bull leg and a buy vacuum test of the trading range high. If true, sellers would emerge near the trading range high, which was the case. (Please refer to the tagged post)
The bulls want the market to form a 2 legged sideways to up pullback.
The pullback is currently underway but has a lot of overlapping candlesticks. The bulls are not yet as strong as they hope to be.
They need to create credible buying pressure - consecutive bull bars closing near their highs to increase the odds of testing the 20-day EMA or the January 13 low.
For today, the market may open lower today. If the market continues down, they hope the March 18 low will act as support, forming a small double bottom bull flag.
The bears see any pullback as minor. They expect at least a small second leg sideways to down to retest the Mar 13 low after the pullback phase.
The 9-bar bear microchannel on the daily chart and the 4-bar bear microchannel on the weekly chart increase the odds that the first pullback (current pullback) would be minor and not lead to a reversal up.
They hope the leg to retest the March 13 low will begin soon. They must create strong bear bars with follow-through selling to increase the odds of another leg down.
The prior climactic selloff and parabolic wedge increase the odds of a pullback which is underway.
Traders will see the strength of the pullback. If it is strong (consecutive bull bars closing near their highs), they may look for a retest of the breakout point - Jan 13 low.
If the pullback lacks follow-through buying (overlapping candlesticks, doji bars, bear bars, long tails above bars), the odds of another leg down AFTER the pullback phase increase.
So far, the pullback has a lot of overlapping candlesticks which indicates that the bulls are not yet as strong as they hope to be.
For now, traders will see if the bears can create a strong bear bar today.
Or will the market open lower but lack follow-through selling, like yesterday?
I will update again later today.

SPY/QQQ Plan Your Trade for 3-21-25 : BreakAway PatternToday's Breakaway pattern may show up in the form of an Island Top or break-away to the upside if my analysis is correct.
I see the markets stalling over the past few days, potentially setting up a "last breakaway" type of pattern today.
I've highlighted how these "last" patterns work where price sets up a peak or trough (in this case a peak) as a last/exhaustion move and how this move can sometimes be very aggressive.
I urge traders to stay cautious today as we are moving into a MAJOR REVERSAL weekend.
I believe the markets will suddenly change direction next week (early) and will move back into downward trending by March 25-26.
Gold and Silver may rally today if the markets move into that Exhaustion Peak pattern. Keep an eye out for Gold/Silver/Bitcoin to potentially rally today and into early next week.
Overall, traders should stay very cautious as we move into next week's peak/top/rollover.
Don't get too aggressive trying to prepare for the rollover or any potential upside move over the next 3-5+ days.
Let the markets show us what and when we need to be aggressive.
Get Some.
#trading #research #investing #tradingalgos #tradingsignals #cycles #fibonacci #elliotwave #modelingsystems #stocks #bitcoin #btcusd #cryptos #spy #gold #nq #investing #trading #spytrading #spymarket #tradingmarket #stockmarket #silver

SPY/QQQ Plan Your Trade For 3-20-25 : Flat-Down PatternToday's SPY Cycle pattern suggests the SPY/QQQ will stay somewhat muted in trading range today.
I still believe the SPY/QQQ are in a moderate melt-up type of trend - attempting to reach a peak near the end of this week or early next week (see the patterns for March 24, 25, 26).
Even though I believe we are struggling to try to move higher, I do believe any failure of the SPY to move above the 0.382 Fibonacci retracement level would be a technical failure related to the breadth of this pullback.
Thus, I believe the markets have at least one more attempt to try to move higher over the next 5+ days before topping and rolling over into a broader downtrend.
Gold and Silver moved solidly lower this morning - almost like a Panic type of selling. I believe this is related to the Flat-Down pattern and I believe Gold/Silver will recover fairly quickly. I do believe this is a huge opportunity for Gold/Silver over the next 30+ days. I believe Gold will attempt to move above $3500-3600 before the end of April.
BTCUSD rolled higher yesterday by more than $4000 - just like I predicted.
Incredible.
And, that is another reason why I believe the SPY/QQQ have more room to the upside than we are seeing right now.
Remember this is a trader's market.
Get some.
#trading #research #investing #tradingalgos #tradingsignals #cycles #fibonacci #elliotwave #modelingsystems #stocks #bitcoin #btcusd #cryptos #spy #gold #nq #investing #trading #spytrading #spymarket #tradingmarket #stockmarket #silver

The S&P Bear flag support was tested today, bear flag developingThe SPX is bouncing from pennant support this morning. So in other words, the overnight lows in futures MUST hold or w may attack trend lows.

SP500 (E-mini Futures) - Decision TimeBigger Picture SP500 Futures Update - Decision Time
- Powell (FED) ruled out a recession in todays FOMC Press Conference (Bullish)
- Powell announced drastically slow down QT beginning next month (Extremely bullish for risk assets)
- The Asian and European stock market indices are still showing strength forming new ATHs week by week.

SPY rally done soon?My overall thesis is we are in the very early stages of a multi-year decline ultimately with the S&P 500 below 3500. I have been wrong many times before so I will just take this thing in stages and see if it plays out. After this massive decline, we should be in for a great market rally of many decades. I am expecting the market to end its recent rally this week. The current rarely would be about a week in length depending when it began for individual stocks. The rally has done a few important things with its slow and prolonged upward movement, mainly prevents a wave 3 signal from occurring during the next decline.
My wave 3 indicator tends to signal wave 3s and 3 of 3s. See my scripts for the specifics of the indicator. If the market had a short wave 4 up and then a sharp or prolonged drop during wave 5, a new wave 3 signal would occur which violates the currently placed Minor wave 3 (yellow 3). Allowing separation from the current wave 3 signal enables wave 5 to drop quick or slow.
This chart applies select movement extensions based on wave 1's movement on the left and then another based on wave 3's movement on the right. I keep the values between 0%-100% on the chart for wave 2s and 4s retracements of the preceding wave's movement for reference even though the retracement values would be inverted.
Specifically for SPY, Minor wave 3 was longer than wave 1, which does not place a maximum length on wave 5. Assuming wave 4 ends on Thursday or Friday, Minor wave 5 could be a week or longer. In that time, at the very least it should drop below wave 3's bottom of 549.68. Using some basic movement extensions, it will likely go lower. The 5 wave lower pattern for this fifth wave is hypothetical, but a bottom could occur between 525-538. Once we bottom, we should see another rally over a few weeks. I will forecast what that could look like as Intermediate wave 1 nears its end.
Another possibility that could play out is we rally through the weekend. In this case Intermediate wave 1 possibly ended at the current Minor 3 bottom. This would mean we are in Intermediate wave 2 now. I will evaluate this solution if the rally continues next week.

Sharp reversal in US marketsAmid market volatility and uncertainty, US stock indices experienced a sharp decline last week. The Dow Jones Index (#DJI30) fell by 3.5%, the S&P 500 (#SP500) dropped by 4.1%, and the Nasdaq-100 (#NQ100) lost 5.5%.
Investors reacted nervously to new economic data, including rising inflation and expectations of interest rate hikes, leading to a sell-off in stocks and a decline in key indices. The drop was particularly significant in the technology and consumer sectors, where companies like Apple and Tesla lost around 6-7% of their value.
However, starting March 13, 2025, the indices began to recover: #DJI30 gained 2.3%, #SP500 rose by 2.5%, and #NQ100 increased by 3.1%.
The recent rebound in US stock indices has been driven by several factors that restored investor confidence. Let’s take a closer look at the main reasons:
• Improvement in unemployment data: Labor market statistics played a crucial role in the market recovery. The US unemployment rate fell to 3.4% in February 2025, marking a record low in recent decades. This indicates strong employment levels and economic resilience, boosting investor optimism and supporting stock market growth.
• Stabilization of inflation and interest rate expectations: Although inflation in the US remains high, recent data showed a slowdown in its growth. Reduced inflationary pressure gave investors hope that the Federal Reserve (Fed) might slow down the pace of interest rate hikes. This was perceived as a sign of potential economic stabilization, positively impacting stock indices.
• Growth in consumer spending: One of the key drivers of the recent market recovery has been the increase in consumer spending. In Q1 2025, consumer demand in the US showed strong performance, serving as an essential indicator of economic activity. Increased spending on goods and services supports business stability and enhances corporate revenues, which, in turn, stimulates stock growth.
• Absence of new geopolitical risks: In recent weeks, there have been no major geopolitical crises or new threats on the international stage. This helped financial markets stabilize, as investors could focus on economic data and corporate earnings reports, contributing to stock index growth.
• Positive corporate earnings reports:
• #Microsoft (MSFT): Microsoft shares rose by 4.2% after reporting strong quarterly results, driven by growth in cloud services and software revenue.
• #Google (GOOGL): Alphabet’s stock increased by 3.7% due to higher advertising revenue and improved forecasts for upcoming quarters.
• #Apple (AAPL): Apple shares climbed 2.9%, supported by strong sales of new products and rising revenue from services.
• #Tesla (TSLA): Tesla stock surged 5.6%, fueled by strong electric vehicle sales growth and optimistic profit projections for the next quarter.
These companies demonstrated significant growth on the back of improved financial performance, strengthening investor confidence and aiding the stock market’s recovery amid volatility.
So despite last week’s market downturn, the current situation in the US stock market signals a potential recovery and a more positive trend in the coming weeks.

Possible rise from the bottom of the long-term ascending channelGiven the recent emotional decline in the Dow Jones and S&P500 due to Trump's tariff policy, the S&P500 is expected to make an upward correction from the bottom of its confirmed ascending channel. The stop loss is equivalent to the closing of the 4-hour candle below today's last low, with a target of 5900 in the final step.

Trading Is Not Gambling : Become A Better Trade Part IOver the last few weeks/months, I've tried to help hundreds of traders learn the difference between trading and gambling.
Trading is where you take measured (risk-restricted) attempts to profit from market moves.
Gambling is where you let your emotions and GREED overtake your risk management decisions - going to BIG WINS on every trade.
I think of gambling in the stock market as a person who continually looks for the big 50% to 150%++ gains on options every day. Someone who will pass up the 20%, 30%, and 40% profits and "let it ride to HERO or ZERO" on most trades.
That's not trading. That's flat-out GAMBLING.
I'm going to start a new series of training videos to try to help you understand how trading operates and how you need to learn to protect capital while taking strategic opportunities for profits and growth.
This is not going to be some dumbed-down example of how to trade. I'm going to try to explain the DOs and DO N'Ts of trading vs. gambling.
If you want to be a gambler - then get used to being broke most of the time.
I'll work on this video's subsequent parts later today and this week.
I hope this helps. At least it is a starting point for what I want to teach all of you.
Get some.
#trading #research #investing #tradingalgos #tradingsignals #cycles #fibonacci #elliotwave #modelingsystems #stocks #bitcoin #btcusd #cryptos #spy #gold #nq #investing #trading #spytrading #spymarket #tradingmarket #stockmarket #silver

S&P500 INTRADAY awaits Fed’s decision and press conferenceThe US Federal Reserve will announce its interest rate decision and release the monetary policy statement on Wednesday at 18:00 GMT, followed by a press conference from Chairman Jerome Powell at 18:30 GMT.
Recent weak economic data from the US, along with new tariffs announced by President Donald Trump, have raised concerns about a possible recession. Despite this, the Fed is expected to keep interest rates unchanged for the second meeting in a row.
The updated Summary of Economic Projections (SEP) could provide important insights into the Fed’s future plans. However, the stock market remains wary that the Fed might not take a dovish enough stance. Inflation remains high, and tariffs could push prices even higher, making the central bank cautious about easing policy.
Key Support and Resistance Levels
Resistance Level 1: 5714
Resistance Level 2: 5770
Resistance Level 3: 5872-5920
Support Level 1: 5500
Support Level 2: 5387
Support Level 3: 5254
This communication is for informational purposes only and should not be viewed as any form of recommendation as to a particular course of action or as investment advice. It is not intended as an offer or solicitation for the purchase or sale of any financial instrument or as an official confirmation of any transaction. Opinions, estimates and assumptions expressed herein are made as of the date of this communication and are subject to change without notice. This communication has been prepared based upon information, including market prices, data and other information, believed to be reliable; however, Trade Nation does not warrant its completeness or accuracy. All market prices and market data contained in or attached to this communication are indicative and subject to change without notice.

SPY/QQQ Plan Your Trade For 3-19-25 : Top PatternToday's Top pattern suggests the SPY/QQQ will attempt to rally up to resistance, then form a peak/top in price, and then roll over a bit.
After yesterday's fairly consolidated price range, I believe the SPY/QQQ may rally through most of the day and move into the topping pattern near the end of today's trading day.
Overall, I believe the markets are still rolling into the Excess Phase Peak consolidation phase and that means traders need to prepare for extreme price volatility.
What is interesting is how BTCUSD is trying to rally a bit, but not finding upward momentum.
As I stated in today's video, I believe a fairly big move upward, possibly $3000 or more, in BTCUSD could happen between now and the end of this week.
This would be a perfect upward price advance into resistance that could correlate with a move h higher in the SPY/QQQ - targeting the upper level of the Consolidation Phase.
Gold and Silver have reached a "pause" level. I believe Gold and Silver will only pause for 48 to 96 hours before attempting to break higher. So, metals will still attempt to break higher into late March 2025.
Get some.
#trading #research #investing #tradingalgos #tradingsignals #cycles #fibonacci #elliotwave #modelingsystems #stocks #bitcoin #btcusd #cryptos #spy #gold #nq #investing #trading #spytrading #spymarket #tradingmarket #stockmarket #silver

GOOGL, Short, 1D✅ GOOGL broke the key support at 166.25, confirming bearish momentum. The price is expected to decline further toward the next key support at 149.50.
SHORT 📉
✅ Like and subscribe to never miss a new analysis! ✅

SPX cycle tell me we are in a bear market this yearThe cycles and the crosses are clones, therefore not exact fit.It doesn't look like a correction when I look at the cycles and pattern. I am more convinced that it is going to be a bear market in USA not just on technical but even on fundamentals:
China has just finished a recession and will grow with higher cost of production, unlike 2000-2015. Market and Fed is under illusion that inflation will come down to 2% (Thank chinese cheap goods for that before covid, but not now and going forward). Higher cost of chinese goods and trump tariff are sure to jack up inflation to 4%+ this year in my opinion. People are addicted to low interest rate since 2000's, but historically they ware always higher at 6% mean.
Any rallies would be temporary

S&P 500 E-mini Futures VWAP Breakout Strategy Sharing a solid intraday idea for you all – something I’ve been running on the S&P 500 E-mini Futures (30-min chart) lately, and it’s been delivering clean setups.
VWAP Breakout Play
I’m focusing on simple VWAP-based breakouts. Here’s the breakdown:
The setup:
• Wait for price to break above or below the VWAP with strong momentum (big candles + solid volume).
• I always confirm with a momentum indicator like MACD or RSI to filter out the noise.
Entries:
• Breakout Long: When price pushes above VWAP + momentum aligns.
• Breakout Short: When price dumps below VWAP + momentum confirmation.
Exits & Stops:
• Scale out at session highs/lows or key pivots.
• Stop-loss goes just beyond VWAP to keep the risk tight.
• If momentum fades, I’m out.
Why I like it:
VWAP attracts institutional flow, and combining it with momentum gives this strategy a solid edge, especially around U.S. session opens when volatility kicks in.
Give it a try and tweak it to your liking!

spx500 bearish movewith the push to the upside in the 1hr crossing a previous resistance. using fib retracement getting in on this analysis

NAS100 | Distribution ContinuationPrice is awaiting a movement towards $18,000 and currently in a distribution phase.

US Technology Sector Futures. The Heartbreak HotelPresident Donald Trump's tariffs on imported tech goods, targeting China, the EU, Canada, and Mexico, are reshaping the U.S. technology sector through higher costs, supply chain disruptions, and retaliatory trade risks. While intended to boost domestic manufacturing and reduce trade deficits, these measures are creating immediate economic strain across critical industries. Below is an analysis of their key negative impacts:
Rising Consumer Prices and Hardware Costs
The 25% tariff on EU semiconductors, 10% levy on Chinese goods, and 25% duties on Canadian/Mexican imports are projected to add $50 billion in new costs to North American tech supply chains. This directly affects consumer electronics:
Smartphones and laptops. Apple’s iPhone production in China exposes it to 10% tariffs, likely forcing U.S. price hikes.
Semiconductors. The U.S. relies on China and Taiwan for 80% of 20-45nm chips and 70% of 50-180nm chips, with tariffs disrupting access to essential components.
Cloud/AI infrastructure. Steel and aluminum tariffs (25%) increase data center construction costs, potentially raising prices for AWS, Google Cloud, and Microsoft Azure services.
Experts warn companies may pass 60-100% of tariff costs to consumers rather than absorb profit losses.
Supply Chain Disruptions and North American Integration
The tariffs jeopardize tightly integrated North American production networks:
Cross-border dependencies. Components often cross U.S.-Mexico or U.S.-Canada borders multiple times during manufacturing. Christine McDaniel of the Mercatus Center notes this integration means tariffs “hurt the pricing power of the U.S.” by inflating domestic costs.
Critical material shortages. Canada supplies nickel and cobalt for batteries, while Mexico handles assembly for firms like Foxconn. Tariffs risk delays and renegotiations with suppliers.
Retaliatory measures. The EU may respond with fines or trade barriers against U.S. tech giants like Apple and Google, escalating tensions.
Sector-Specific Challenges
Semiconductors and Hardware
Chip shortages. With limited domestic foundry capacity, tariffs on EU semiconductors threaten AI development and device manufacturing.
Networking equipment. Proposed 10% tariffs on Chinese-made routers and modems could disrupt cloud providers reliant on these components.
Data Centers and AI
Construction delays. Steel/aluminum tariffs increase costs for server racks and cooling systems, potentially delaying $80 billion in planned U.S. data center investments.
AI infrastructure. Projects like the $500 billion Stargate initiative face higher expenses for imported components, slowing AI adoption.
Macroeconomic Risks
Trade deficit growth. Despite tariffs aiming to reduce the $1 trillion U.S. goods trade deficit, S&P Global warns retaliatory Chinese tariffs could worsen imbalances.
Job losses. Economic modeling suggests tariffs may cost 125,000+ U.S. tech jobs through reduced consumer spending and IT budget cuts.
Innovation slowdown. While firms like TSMC and Intel accelerate U.S. fab construction, short-term supply chain reallocations divert R&D funding.
Corporate Responses and Limitations
Some companies are attempting mitigation strategies:
Stockpiling. NVIDIA and AMD are urging partners to increase pre-tariff production.
Domestic shifts. Apple plans $500 billion in U.S. manufacturing, while TSMC pledged $160 billion for stateside fabs.
However, these efforts face scalability issues. Building advanced chip foundries takes 3-5 years, leaving gaps in critical components. Meanwhile, 65% of IT firms report difficulty finding tariff-free alternatives for Chinese inputs.
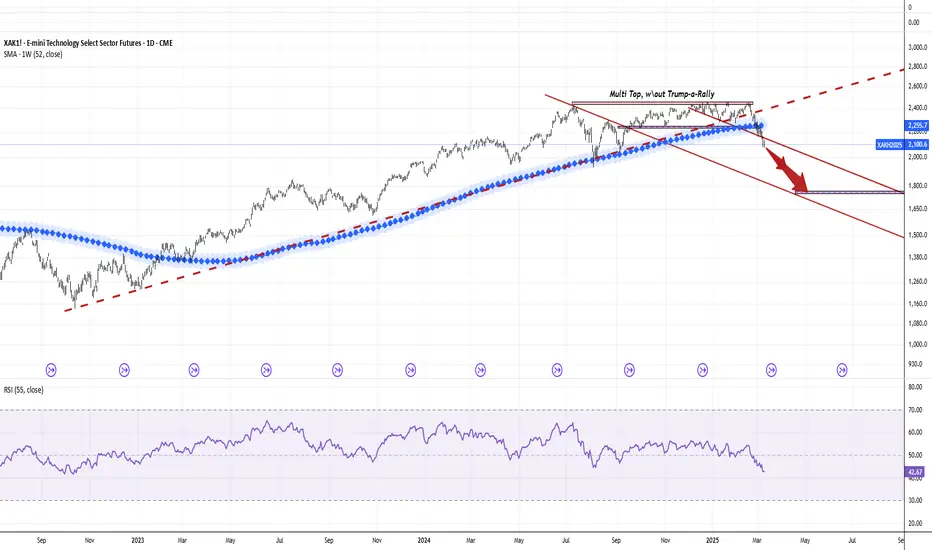
Technical challenge
The main technical graph for US Technology Select Sector Futures CME_MINI:XAK1! (CME Group mode of AMEX:XLK - SPDR Select Sector Fund - S&P500 Technology ETF) indicates on further Bearish market in development since major support of 52-week SMA has been broken already, with possible upcoming Bearish cascade effects in the future.
It is also important to note the almost complete absence of a Trump-a-rally in the 2024 holiday quarter, which contributed to the formation of a multi-resistance top.
Conclusion
While the tariffs aim to strengthen U.S. tech autonomy, their immediate effects—higher prices, supply instability, and strained international relations—outweigh potential long-term benefits. With global IT spending still projected to grow 9% in 2025, the sector’s resilience is being tested by policy-driven headwinds that threaten America’s competitive edge in semiconductors, AI, and consumer electronics.
Investing in S&P500 Technology Sector Futures / ETFs seeks to provide precise exposure to companies from technology hardware, storage and peripherals; software; communications equipment; semiconductors and semiconductor equipment; IT services; and electronic equipment, instruments and components industries; allows investors to take strategic or tactical positions at a more targeted level than traditional wide style based investing.
S&P500 Technology Sector Futures / ETFs are designed for investing at a more targeted Technology level, since nearly 50 percent of holdings weight just a five well-known names:
Name Weight
APPLE INC NASDAQ:AAPL 15.61%
MICROSOFT CORP 12.83%
NVIDIA CORP NASDAQ:NVDA 11.91%
BROADCOM INC NASDAQ:AVGO 5.18%
SALESFORCE INC NYSE:CRM 3.11%
--
Best 'Heartbreaking' wishes,
@PandorraResearch Team 😎
SPY/QQQ Plan Your Trade For 3-18-25 : Gap Reversal Counter-TrendFirst off, thank you for all the great comments and feedback. I really love hearing from TradingView subscribers and how my research is helping everyone find success.
Just recently, I received some DMs from viewers saying my research has been "dead on" - which is great.
One thing is for sure, the big move in Gold/Silver is just getting started.
Today's SPY Cycle Pattern is a Gap-Reversal in a Counter Trend mode. The long-term & short-term bias is currently BEARISH - so I believe the GAP Reversal will be to the upside.
Meaning, I suggest we start the day with a mild lower GAP - followed by a moderate price reversal in early trading, leading to a continued melt-up type of trend for the SPY/QQQ
Gold and Silver are likely to attempt to melt a bit higher into the TOP pattern for today. I believe this is just a temporary resistance level for metals.
Bitcoin is struggling to find upward momentum - but I believe BTCUSD still has a $3k-$5k rally left to reach the current Consolidation highs. We'll see if it breaks higher over the next 3-5 days before rolling over into a new downtrend.
Again, I really appreciate all of my followers and viewers. I want all of you to learn to see, read, and understand price action more clearly than ever before.
That's why I don't use any technical indicators on my chart. I want you to understand PRICE is the ultimate indicator.
Get some..
#trading #research #investing #tradingalgos #tradingsignals #cycles #fibonacci #elliotwave #modelingsystems #stocks #bitcoin #btcusd #cryptos #spy #gold #nq #investing #trading #spytrading #spymarket #tradingmarket #stockmarket #silver

SPX500 Move Up Expected!
HI,Traders !
SPX500 made a bullish
Breakout of the key horizontal
Level of 5640.66 and the
Breakout is confirmed
Because the daily candle
Closed above the key level
So on the market open
We will be expecting a
Local pullback and then
A strong move up !
Comment and subscribe to help us grow !
