S&P INTRADAY bearish & oversold capped by resistance at 5714The US Producer Price Index (PPI) increased by 3.2% year-on-year in February, down from 3.7% in January and slightly below the expected 3.3%.
The core PPI, which excludes food and energy prices, rose by 3.4% annually, also lower than the 3.8% recorded in January. On a monthly basis, the PPI remained unchanged, while the core PPI saw a slight 0.1% decline.
Key Support and Resistance Levels
Resistance Level 1: 5714
Resistance Level 2: 5770
Resistance Level 3: 5805
Support Level 1: 5523
Support Level 2: 5480
Support Level 3: 5300
This communication is for informational purposes only and should not be viewed as any form of recommendation as to a particular course of action or as investment advice. It is not intended as an offer or solicitation for the purchase or sale of any financial instrument or as an official confirmation of any transaction. Opinions, estimates and assumptions expressed herein are made as of the date of this communication and are subject to change without notice. This communication has been prepared based upon information, including market prices, data and other information, believed to be reliable; however, Trade Nation does not warrant its completeness or accuracy. All market prices and market data contained in or attached to this communication are indicative and subject to change without notice.
S&P 500 (SPX500)

SPY/QQQ Plan Your Trade For 3-13-25: Carryover PatternToday's pattern suggests the markets may attempt to continue to find support and move into a sideways pullback (upward) price channel.
I believe the markets have reached an exhaustion point that will move the SPY/QQQ slightly upward over the next 5 to 10+ days - reaching a peak near the 3-21 to 3-24 Bottoming pattern.
This bottoming pattern near March 21-24 suggests the markets will move aggressively downward near that time to identify deeper support.
I believe metals will continue to move higher as risks and fear drive assets into safe havens.
Bitcoin should continue to slide a bit higher while moving through the consolidation phase.
Watch today's video to learn more about what I do and how I help traders find the best opportunities.
Get some.
#trading #research #investing #tradingalgos #tradingsignals #cycles #fibonacci #elliotwave #modelingsystems #stocks #bitcoin #btcusd #cryptos #spy #gold #nq #investing #trading #spytrading #spymarket #tradingmarket #stockmarket #silver

relief pumpSeems like election bull was already priced in, new money got washed.
Bonds are making a comeback, cash is a position.
Expecting more downturn after a relief pump, coinciding with yields retracement.
Yields trending with equity price are usually signs of either economical expansion or economical fears, such as slowdown or recession, during up and downs. The markets just jumped from one narrative to the other:
expansion(trump gets in office) ---> slowdown(tariffs imposed)
I think the expansion narrative will take a while to settle back(end of Q2 at least) after all the executive orders signed.
Although, I'm still long for the month of March, nice opportunity for a relief pump, before resuming of slowdown narrative.

Don't Miss Out We Predicted S&P 500 Drop to 5740 It Happened📉 Don't Miss Out – We Predicted S&P 500 Drop to 5740 , and It Happened! 🔥
In our previous recommendation, we clearly stated that S&P 500 would drop to 5740 , and it happened exactly as predicted, reaching the 61% Fibonacci level! ✅
🚨 Will You Wait Until You Fall with Losing Stocks? 🚨
The market doesn’t wait, and opportunities don’t last forever! If you’ve been following our recommendations, you’ve avoided the collapsing stocks we warned about.
⚠️ Don’t let the market get ahead of you – Follow our recommendations to stay on the winning side! 🔥💰
#SPX500 #Trading #TechnicalAnalysis #InvestmentOpportunities

S&P INTRADAY reaction to US Inflation figuresUS equity indices reacted positively to the latest US inflation figures released earlier today, as the data pointed to a moderation in price pressures.
The Consumer Price Index (CPI) decreased to 2.8% year-over-year in February, down from 3.0% in January. This reading not only marked a decline but also came in below market expectations of 2.9%, signaling that inflationary pressures may be easing. On a monthly basis, the CPI increased by 0.2%, following a 0.5% rise recorded in January.
Similarly, the core CPI, which excludes volatile food and energy prices, rose by 3.1% year-over-year in February, down from 3.3% in the previous month. This print also fell short of analysts' forecasts of 3.2%, further supporting the view of moderating inflation. On a month-to-month basis, the core CPI edged up by 0.2%.
Key Support and Resistance Levels
Resistance Level 1: 5713
Resistance Level 2: 5770
Resistance Level 3: 5807
Support Level 1: 5523
Support Level 2: 5480
Support Level 3: 5300
This communication is for informational purposes only and should not be viewed as any form of recommendation as to a particular course of action or as investment advice. It is not intended as an offer or solicitation for the purchase or sale of any financial instrument or as an official confirmation of any transaction. Opinions, estimates and assumptions expressed herein are made as of the date of this communication and are subject to change without notice. This communication has been prepared based upon information, including market prices, data and other information, believed to be reliable; however, Trade Nation does not warrant its completeness or accuracy. All market prices and market data contained in or attached to this communication are indicative and subject to change without notice.

SPY/QQQ Plan Your Trade for 3-12-25 : Rally111 PatternToday's Rally pattern in Carryover mode may prompt a powerful base/bottom move in the SPY/QQQ.
In today's video, I explain in great detail how I read these charts and why the Excess Phase Peak (EPP) patterns are so important.
We are moving into the Consolidation Phase of the EPP patterns for the SPY/QQQ.
We are already into the Consolidation Phase of an EPP pattern for Bitcoin
Gold and Silver are a bit mixed. Yet Silver has already broken above the upper EPP Peak, rallying into a new EPP Peak level. Meanwhile, Gold is still struggling to find momentum for a bullish breakout.
While I don't believe the US markets are poised for a big downward price move, today's video shows you what may be likely 4 to 12+ months into the future.
So, pay attention to today's video. It clearly illustrates how to use the EPP patterns with Fibonacci and shows you what I believe could happen over the next 6 to 12+ months.
If the SPY/I continues to try to rally higher today, it will be interesting. This means we have potentially found our consolidation base and are now moving into a very volatile sideways consolidation phase.
Get some.
#trading #research #investing #tradingalgos #tradingsignals #cycles #fibonacci #elliotwave #modelingsystems #stocks #bitcoin #btcusd #cryptos #spy #gold #nq #investing #trading #spytrading #spymarket #tradingmarket #stockmarket #silver

SPY S&P 500 etf Oversold on the RSI ! 2025 Price Target ! The SPDR S&P 500 ETF Trust (SPY) is flashing a major buy signal, with its Relative Strength Index (RSI) currently sitting at 28.33 — firmly in oversold territory. Historically, every time SPY has entered oversold levels on the RSI, institutional buyers have stepped in aggressively, driving sharp rebounds in the following weeks and months.
The last time SPY dipped below the 30 RSI threshold was during market pullbacks in 2022 and 2023 — both of which were followed by significant rallies as institutions capitalized on discounted valuations. The current setup is no different. With earnings growth stabilizing, inflation cooling, and the Federal Reserve signaling a potential shift toward rate cuts in the second half of the year, the backdrop for a recovery is aligning perfectly.
Technically, SPY is also approaching key support levels that have held strong in past market corrections. The combination of an oversold RSI and strong institutional appetite at these levels creates a compelling case for a bounce.
My price target for SPY by year-end is $640, representing over 15% upside from current levels. With sentiment stretched to the downside and technical indicators flashing green, SPY looks primed for a sharp and sustained rebound. Now could be the perfect time to position for the next leg higher.

SPX give target of 5900My prediction based on market geometry and trend convergence. 5900 by 8/4. I don't claim any accuracy but the probability is high. The level is confirmed by 61.8% fibbo retracement and the time by fibo time series , 21 days down and 21 days up

SPX500 D1 | Strong bearish downtrendSPX500 is rising towards a pullback resistance and could potentially reverse off this level to drop lower.
Sell entry is at 5,653.89 which is a pullback resistance that aligns with the 23.6% Fibonacci retracement.
Stop loss is at 5,768.84 which is a level that sits above a pullback resistance and beyond the descending trendline.
Take profit is at 5,390.20 which is a swing-low support.
High Risk Investment Warning
Trading Forex/CFDs on margin carries a high level of risk and may not be suitable for all investors. Leverage can work against you.
Stratos Markets Limited (www.fxcm.com):
CFDs are complex instruments and come with a high risk of losing money rapidly due to leverage. 63% of retail investor accounts lose money when trading CFDs with this provider. You should consider whether you understand how CFDs work and whether you can afford to take the high risk of losing your money.
Stratos Europe Ltd (www.fxcm.com):
CFDs are complex instruments and come with a high risk of losing money rapidly due to leverage. 63% of retail investor accounts lose money when trading CFDs with this provider. You should consider whether you understand how CFDs work and whether you can afford to take the high risk of losing your money.
Stratos Trading Pty. Limited (www.fxcm.com):
Trading FX/CFDs carries significant risks. FXCM AU (AFSL 309763), please read the Financial Services Guide, Product Disclosure Statement, Target Market Determination and Terms of Business at www.fxcm.com
Stratos Global LLC (www.fxcm.com):
Losses can exceed deposits.
Please be advised that the information presented on TradingView is provided to FXCM (‘Company’, ‘we’) by a third-party provider (‘TFA Global Pte Ltd’). Please be reminded that you are solely responsible for the trading decisions on your account. There is a very high degree of risk involved in trading. Any information and/or content is intended entirely for research, educational and informational purposes only and does not constitute investment or consultation advice or investment strategy. The information is not tailored to the investment needs of any specific person and therefore does not involve a consideration of any of the investment objectives, financial situation or needs of any viewer that may receive it. Kindly also note that past performance is not a reliable indicator of future results. Actual results may differ materially from those anticipated in forward-looking or past performance statements. We assume no liability as to the accuracy or completeness of any of the information and/or content provided herein and the Company cannot be held responsible for any omission, mistake nor for any loss or damage including without limitation to any loss of profit which may arise from reliance on any information supplied by TFA Global Pte Ltd.
The speaker(s) is neither an employee, agent nor representative of FXCM and is therefore acting independently. The opinions given are their own, constitute general market commentary, and do not constitute the opinion or advice of FXCM or any form of personal or investment advice. FXCM neither endorses nor guarantees offerings of third-party speakers, nor is FXCM responsible for the content, veracity or opinions of third-party speakers, presenters or participants.

Nasdaq Bank Index 2025 Edition — Let's Make Sh#t Great Again.President Donald Trump's aggressive tariff policies, we at @PandorraResearch Team characterize as a term "Tariff Bazooka", have significantly destabilized the Nasdaq Bank Index NASDAQ:BANK , reflecting broader financial sector vulnerabilities and investor anxiety.
These tariffs, including a 25% levy on imports from Canada and Mexico, a 20% duty on Chinese goods, and proposed reciprocal tariffs, — have triggered cascading multi effects on banking stocks through several paths.
Market Volatility and Investor Flight
The Nasdaq Bank Index, which tracks major U.S. financial institutions, has been disproportionately impacted by tariff-driven uncertainty:
Sharp Equity Declines. Since Trump announced reciprocal tariffs in February 2025, the Nasdaq Composite NASDAQ:IXIC dropped over 10% from its December 2024 peak, erasing $1 trillion in tech-sector value. Banking stocks, sensitive to macroeconomic shifts, mirrored this downturn as investors fled equities for safer assets.
Risk-Off Sentiment. Bonds rallied as tariffs sparked fears of stagflation—a combination of stagnant growth and rising inflation—prompting a 30-basis-point drop in 10-year Treasury yields. This flight to safety squeezed bank profitability, as narrower yield curves reduce net interest margins.
Economic Contagion Mechanisms
Interest Rate Pressures.
Tariffs have raised input costs for businesses, contributing to inflationary pressures. The Federal Reserve now faces a dilemma: tolerate higher inflation or hike rates to curb it. Either scenario harms banks. Elevated rates could suppress loan demand and increase default risks, while delayed rate cuts prolong financial tightening.
Trade Retaliation and Sectoral Risks.
Canada, Mexico, and China have retaliated with tariffs on $155 billion (Canada) and unspecified billions (China, Mexico) of U.S. goods. For banks, this raises exposure to sectors like agriculture, manufacturing, and automotive - industries heavily reliant on cross-border trade. Loan defaults could surge if protected industries fail to offset higher costs.
Global Financial System Strain.
Trump’s tariffs risk fragmenting the rules-based trading system, undermining the stability that banks depend on for international transactions. The EU and other regions may retaliate by restricting U.S. financial services, directly impacting revenue streams for Wall Street firms.
Sector-Specific Impacts
Tech-Finance Nexus. Many Nasdaq-listed banks have significant exposure to tech firms, which face disrupted supply chains due to tariffs on Chinese components. This dual pressure — higher operational costs for clients and reduced tech-sector valuations — weakens banks’ asset quality.
Consumer Credit Risks. Tariffs on everyday goods (e.g., 25% on Mexican produce, 10% on Canadian energy) could elevate household expenses, straining consumer creditworthiness and increasing delinquency rates for retail banks.
Projected Outcomes
Economists estimate Trump’s tariffs could reduce U.S. GDP growth by 1.5 percentage points in 2025, with a stagflationary shock amplifying equity sell-offs. For the Nasdaq Bank Index, this implies prolonged volatility, compressed earnings, and potential credit rating downgrades as macroeconomic headwinds intensify.
Technical challenge
The main technical graph of Nasdaq Bank Index NASDAQ:BANK indicates on further Bearish trend in development, since major supports (nearly 5-month flat bottom and 52-weeks SMA) have been recently broken.
Conclusion
In conclusion, Trump’s tariff strategy has acted as a destabilizing force for financial markets, with the Nasdaq Bank Index serving as a barometer for sector-wide risks. By exacerbating economic uncertainty, inflation, and trade fragmentation, these policies have eroded investor confidence and heightened systemic vulnerabilities in the banking sector.
--
Best 'sh#t hits the fan' wishes,
@PandorraResearch Team 😎

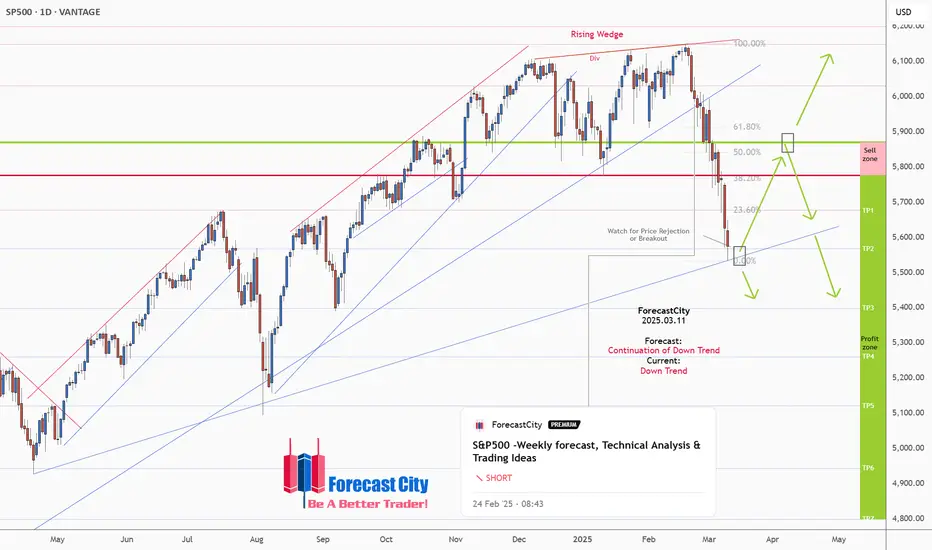
S&P500 -Weekly forecast, Technical Analysis & Trading IdeasMidterm forecast:
5870.56 is a major resistance, while this level is not broken, the Midterm wave will be downtrend.
$S&P500
Technical analysis:
A peak is formed in daily chart at 6150.05 on 02/19/2025, so more losses to support(s) 5568.78, 5398.95, 5261.00 and more depths is expected.
Take Profits:
5677.80
5568.78
5398.95
5261.00
5122.47
4944.41
4800.00
__________________________________________________________________
❤️ If you find this helpful and want more FREE forecasts in TradingView,
. . . . . . . . Hit the 'BOOST' button 👍
. . . . . . . . . . . Drop some feedback in the comments below! (e.g., What did you find most useful? How can we improve?)
🙏 Your support is appreciated!
Now, it's your turn!
Be sure to leave a comment; let us know how you see this opportunity and forecast.
Have a successful week,
ForecastCity Support Team
Silly Speculation #1.Charting the bottom to our current downside move. I could be wrong...if so, I would say by 2-3%.

S&P 500 is gearing up for a drop to $348.11 or even $218.26.SP:SPX AMEX:SPY are gearing up for a potential crash. Markets and indices seem aligned for a downturn.
What will trigger it?
Hard to say, but watching the stock and crypto markets, it certainly looks that way.
My expectations for SPX / SPY:
➖ Fibonacci 161.80% targets have been reached.
➖ Key downside levels: $348.11 and $218.26.
TVC:DXY
The dollar index is leaning towards growth for now. I think it might follow this scenario. Let’s keep an eye on how things develop.

S&P500 INDEX (US500): More Down
With a confirmed bearish breakout of a key daily horizontal support,
US500 index opens a potential for more drop.
Next key support is 5425.
It looks like the market is going to reach that soon.
❤️Please, support my work with like, thank you!❤️
I am part of Trade Nation's Influencer program and receive a monthly fee for using their TradingView charts in my analysis.

S&P 500 tests key support on Trump's latest bombshellIn yet another striking move, US President Donald Trump has just announced plans to double tariffs on Canadian steel and aluminum, raising them from 25% to a hefty 50%. The new tariffs are slated to come into effect this Wednesday, with Trump citing Canada's intention to impose tariffs on electricity exports to the US as the catalyst for this decision. This latest escalation in trade tensions comes hot on the heels of a tumultuous Monday, which marked the worst day of 2025 for US markets. Investor fears were stoked by President Trump's aggressive tariff policies targeting America's largest trading partners, sending shockwaves through the financial landscape.
The situation has left many observers questioning the broader implications of these trade policies on both the US economy and its international relationships.
But one thing that has been quite clear all these years in this long-term bull market is that every time we have had a decent sell-off, dip-buyers have invariably stepped in and drove markets to new highs despite any macro concerns. Every single time we have heard cries of “this time it is different,” the bulls have prevailed, and bought the dip. Not even covid could hold the bulls back, let alone the unwinding of yen carry trades in 2024, or China’s sluggish recovery that caused local markets to tank last year, and before that the Russian invasion of Ukraine, or the bear market of 2022 when inflation surged and caused interest rates to shoot higher across the world (excluding Japan). Are we going to see yet another such recovery soon, or does the market want to go a little deeper before dip buyers emerge? That’s the key question, and one way to find clues is by looking at the charts.
The S&P 500 here is testing liquidity below yesterday's low of 5567 and key support in the 5550 area. With the daily RSI now well into the oversold territory, can we see a rebound here heading deeper into the US session?
By Fawad Razaqzada, market analyst with Forex.com

SPY/QQQ Plan Your Trade For 3-11-25: BreakAway PatternToday's Breakaway pattern offers a fairly strong potential the SPY/QQQ will attempt to find support today. I know I've been telling everyone the markets should find support and are seeking support for the past 3+ trading days. But, the SPY has recently crossed the 50% Fibonacci pullback level and the QQQ has recently crossed the 61.8% pullback level.
These levels will act as moderate support. So, I'm urging traders to patiently wait out the early morning volatility. Today could be incredibly volatile while the markets attempt to hammer out critical support.
BTCUSD has moved to consolidation lows and will likely attempt a moderate rally up to consolidation highs.
This is another reason I believe the SPY/QQQ are attempting to base/bottom near current lows.
Gold and silver have recovered from recent lows very aggressively and are moving into a CRUSH pattern. I believe that the CRUSH pattern will resolve to the upside for metals.
At this point, I believe the markets are relatively well exhausted to the downside. But, we must let price be the ultimate dictator of trending and opportunity.
Thus, it is essential to let the markets FLUSH OUT this potential base/bottom in early trading today before getting aggressive with any trades.
Ultimately, we need to see the markets identify support in this downtrend. If we don't find any support before the end of this week, then we are going to see a very large downward price move that will invalidate many of my expectations, potentially leading to a very large breakdown in US/global markets.
Buckle up. The markets are nearing the DO or DIE phase due to how these Excess Phase Peak patterns are playing out.
I see support setting up and a base/bottom building. If I'm wrong, we'll see a continued downward price trend.
Get some.
#trading #research #investing #tradingalgos #tradingsignals #cycles #fibonacci #elliotwave #modelingsystems #stocks #bitcoin #btcusd #cryptos #spy #gold #nq #investing #trading #spytrading #spymarket #tradingmarket #stockmarket #silver

I don't think US markets have bottomed outThe US stock markets are down.
I don't think they've bottomed out - there could be further downside to come - but this could be a fantastic opportunity for longer-term traders and investors. Buying the dip is often profitable for buy-and-hold investors.
As a trader, I'm still actively looking for index shorting opportunities.

Most Probable Outcome (SPY, SPX)Looking at recent pullbacks and Shiller Cape. My most probable outcome for this S&P Correction is 5400. Finding the first big support under the 200 DMA. Shiller Cape around 35 at that level.

Bearish Outlook for VX1!Bearish Post Description for TradingView
Title: Bearish Outlook on VIX Futures - Time to Brace for a Pullback!
Hey traders, take a look at this VIX Futures chart (CBOE Volatility Index - VX1 Futures) published by FairValueBuffet on TradingView (Mar 10, 2025, 20:58 UTC). The technicals are screaming caution, and here’s why:
- Supply/Demand Zone Breakdown: We’ve hit a critical supply zone (highlighted in yellow) with a sharp spike, suggesting heavy selling pressure. The price action is showing rejection at this level, hinting at a potential reversal.
- Moving Averages: The 18-week and 52-week SMAs are converging, with the price breaking below the shorter-term SMA, reinforcing bearish momentum.
- Bearish Divergence: The RSI and Williams %R at the bottom show clear bearish divergence. Despite a price spike, the momentum indicators are declining, indicating weakening bullish strength.
- Seasonality Indicator: The bottom-right seasonality chart (COT data for VX Futures) shows a historical tendency for volatility spikes around this time, often followed by a correction.
With the VIX jumping to 24.700 and a volume of 137.66K, coupled with the bearish technical setup, I’m anticipating a pullback in the near term. Keep an eye on the 20.000 support level—failure to hold could see us testing lower grounds. Let’s stay cautious and consider short opportunities or hedging strategies!
---
CBOE:VX1! CME_MINI:ES1! AMEX:SPY
Bullish Case for S&P 500 - Fundamental Perspective
While the VIX chart suggests short-term volatility, the broader S&P 500 presents a compelling bullish case based on fundamentals as of March 10, 2025. Here’s why we might see upside potential:
- Economic Resilience: Recent data points to robust corporate earnings growth, with many S&P 500 companies exceeding Q4 2024 expectations. This earnings strength supports a sustained rally.
- Interest Rate Outlook: The Federal Reserve has signaled a dovish stance, with potential rate cuts on the horizon. Lower interest rates typically boost equity valuations, especially for growth stocks in the S&P 500.
- Gold and Bonds Correlation: The chart shows a dip in gold prices and bond yields stabilizing, which historically correlates with risk-on sentiment. This could drive capital back into equities, favoring the S&P 500.
- Market Sentiment: Despite short-term volatility (as seen in the VIX), investor confidence remains high, supported by strong consumer spending and improving global trade conditions.
Given these fundamentals, the S&P 500 could be poised for a bullish run, especially if volatility subsides and the 18-week SMA on the VIX chart starts to flatten. Consider long positions or adding exposure if the market holds key support levels. Stay tuned for confirmation!
---
Note: This analysis is based on the provided chart and my knowledge up to March 10, 2025. For the latest updates or to validate these trends, I can perform a web search or analyze additional X posts if requested!
Not Financial Advice

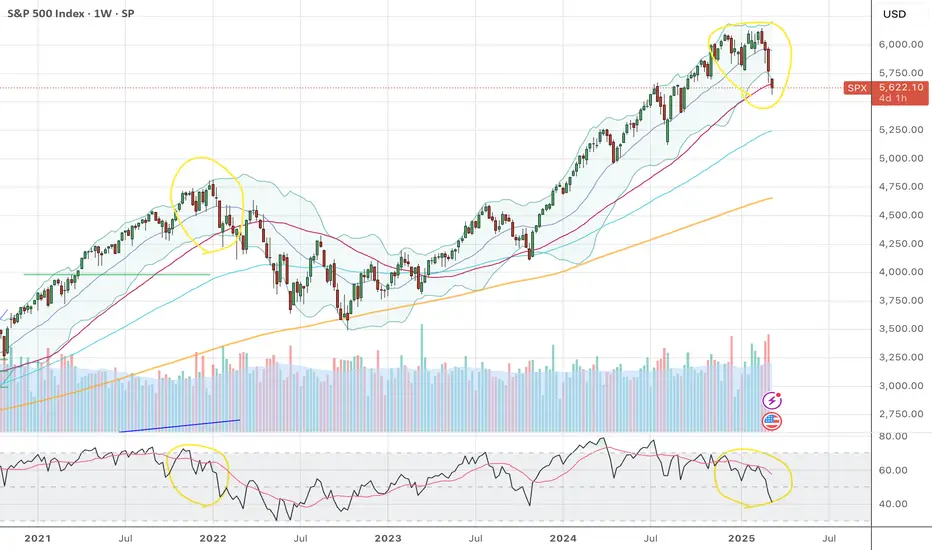
Start of bearish cycle for equities $SPXSP:SPX confirming trend reversal on high time frame as it attempts to breach the 50 weekly MA for the first time since the start of the 2022 bear market. Macroeconomic environment is full of uncertainty and recession signals, with POTUS Trump openly confirming that some short term pain in assets is needed for the US economy to reset and go on a better path forward.
S&P 500 Breakdown at Key Support LevelThe S&P 500 is showing clear signs of technical weakness as it breaks below a key support level around 5,675, coinciding with the 200-day EMA. This breakdown follows a rejection at 6,130, a recent high that established a resistance zone.
With the index now trading below the 50-day EMA, downside risks are increasing. If the 5,668 level fails to hold, further declines toward the next major support zone could materialize. Traders will be watching for a potential retest of broken support as resistance before determining the next move.
Key Levels to Watch:
📉 Support: 5,668
📈 Resistance: 6,130
-MW

S&P INTRADAY Bearish & Oversold Capped by 5768 resistanceKey Support and Resistance Levels
Resistance Level 1: 5768
Resistance Level 2: 5800
Resistance Level 3: 5920
Support Level 1: 5647
Support Level 2: 5624
Support Level 3: 5560
This communication is for informational purposes only and should not be viewed as any form of recommendation as to a particular course of action or as investment advice. It is not intended as an offer or solicitation for the purchase or sale of any financial instrument or as an official confirmation of any transaction. Opinions, estimates and assumptions expressed herein are made as of the date of this communication and are subject to change without notice. This communication has been prepared based upon information, including market prices, data and other information, believed to be reliable; however, Trade Nation does not warrant its completeness or accuracy. All market prices and market data contained in or attached to this communication are indicative and subject to change without notice.

SPY/QQQ Plan Your Trade For 3-10-25: Gap/BreakawayToday's Gap Breakaway pattern suggests the markets will attempt to gap at the open, then move into a breakaway trending phase.
Given the downward price trend currently in place, I believe the markets will gap downward, then possibly attempt to move higher as we pause above the 568 (pre-election) support level.
Ultimately, I see the markets entering a brief pause/sideways price trend (maybe 2 to 5 days) before rolling downward again into the April 14 and May 2 base/bottom patterns.
I see very little support in the markets right now - other than a potential BOUNCE setup this week and into early next week.
I'm not suggesting this bounce will be a very big bullish price reversion. My upper levels are still in the 590 to 600 area for the SPY. But I do believe the markets are likely to try to find support near the 565-575 level.
Gold and silver will move into a Harami Pattern today (sideways consolidation). I don't expect much related to a big move in metals today.
Bitcoin is still consolidating in a very wide range. I expect the next move for Bitcoin to be a bit higher over the next 3-5+ days, so I believe the SPY/QQQ may trend a bit higher for about 3-5 days.
Overall, I suggest traders stay very cautious of volatility this week. Obviously, the trend is still bearish and the current EPP phase setups suggests we are consolidating into a sideways channel before moving downward seeking the Ultimate Low patterns.
Therefore, any bounce/pause in price will be very short-lived.
Get some.
#trading #research #investing #tradingalgos #tradingsignals #cycles #fibonacci #elliotwave #modelingsystems #stocks #bitcoin #btcusd #cryptos #spy #gold #nq #investing #trading #spytrading #spymarket #tradingmarket #stockmarket #silver
