SPY/QQQ Plan Your Trade Afternoon Update : BREAKDOWNIf you've followed my research over the past 90+ days - you were ready for this move.
If you were positioned for this breakdown, many of you should have seen decent profits or green in your accounts.
I'm so happy and proud to have helped many of you prepare for this move.
Stay cautious into the close as we may see more selling pressure drive prices lower.
Remember, everything I do is about helping you become a better trader.
Get some.
#trading #research #investing #tradingalgos #tradingsignals #cycles #fibonacci #elliotwave #modelingsystems #stocks #bitcoin #btcusd #cryptos #spy #es #nq #gold
S&P 500 (SPX500)

SPX topSPX potential TOP in the red line. Not a good bet since the DTJ is leading US but the charts are talking..

S&P drops to test THIS key supportThe US markets wobbled at the start of Friday’s session, with major indices pulling back. However, the outlook isn’t overly bearish yet, as the S&P 500 is testing a key level here around 6075. A bounce into the close is still possible from here, but the bulls need to show and quickly.
Even if the index closes near current levels, it wouldn't necessarily signal the end of the bullish trend. To turn short-term bearish, I would need to see a breakdown below the 6,000 level, which had been a strong support before the recent breakout. If that level fails, it would be a bearish signal, potentially leading to a deeper correction toward the long-term trendline or even the 200-day moving average.
For now, the focus remains on short-term support and resistance levels. The 6075 level, marking the high of the hammer candle from last Wednesday, is a key short-term support level where the 21-day exponential moving average also converges. Should the S&P 500 experience a deeper pullback, this will be the first major test for the bulls.
On the upside, 6100 is the level I am watching, which acted as resistance in December and January before breaking last week, and now we are back below it slightly. Beyond this level, there isn’t much immediate resistance until this week’s all-time high of 6148.
By Fawad Razaqzada, market analyst with FOREX.com

SPY/QQQ Plan Your Trade For 2-21 : Top Pattern Counter TrendToday's Top pattern in Counter-Trend mode suggests the markets will attempt to move downward, seeking a new support level, then find a base and attempt to roll a bit higher.
I don't expect a big breakdown to take place today, but the YM is already struggling to maintain support - so we may see the ES/NQ break downward if the major markets continue to weaken throughout the day.
I do expect the markets to move into my Major Bottom pattern over the next 3-5+ trading days. So, overall, I expect the markets to reject these recent highs and attempt to move downward.
Gold and Silver should continue to rally with Gold trying to break above $3k and silver trying to break above $35.
Bitcoin is moving into an early stage Excess Phase Peak flagging formation. This should prompt a fairly solid rally phase for Bitcoin over the next few days/weeks.
If my longer-term research is correct, the recent new highs will be rejected and price will roll into a double-bottom type of setup between now and the end of March 2025.
I suspect traders are not prepared for this move and will continue to try to BUY any dip they see over the next 30+ days.
My only advice is to play the short-term trends and avoid position or swing trading too heavily.
The markets are going to become very volatile over the next 30+ days.
Get some.
#trading #research #investing #tradingalgos #tradingsignals #cycles #fibonacci #elliotwave #modelingsystems #stocks #bitcoin #btcusd #cryptos #spy #gold #nq #investing #trading #spytrading #spymarket #tradingmarket #stockmarket #silver

SPX500 : Important support for purchaseshello friends
Considering the drop we had, now we can buy step by step on the specified supports in the low time with risk and capital management...
*Trade safely with us*

S&P 500 Faces Rejection at Key Resistance?📉 False Breakout or Consolidation?
S&P 500 hit 6,129 but failed to hold above it, retreating to 6,090 (-0.75%).
This level marks a key resistance zone, with sellers stepping in to cap gains.
🔍 Key Technical Levels:
Resistance:
6,129 → Previous high, acting as a short-term ceiling.
Support:
6,018 (50-day EMA) → First area bulls want to defend.
5,900 → Stronger structural support if momentum weakens.
📊 Momentum Check:
RSI at 54.86 → Neutral, room for both upside and downside.
Price remains above the 50-day EMA, keeping the uptrend intact for now.
🚀 What’s Next?
Bulls need a decisive close above 6,129 to confirm a breakout.
A rejection here could trigger consolidation or a pullback toward the 50-day EMA.
Watching for either a breakout confirmation or a deeper retest of support levels.
-MW

SPY/QQQ Plan Your Trade For 2-20 : Rotation PatternSorry for my delay this morning. Everything is fine over here - just a bit hectic this morning, and I had to drive my son to his work at 530am - which interrupted my plans.
OK, so here we go.
This video helps to organize my analysis/thinking into more clearly presented data for my followers. I use the Fibonacci Price Theory as a basis for all my analysis. On top of that, I use other techniques (anchor bars, my SPY Cycle Patterns, and my custom indexes) to help identify when and where opportunities exist for the best trades.
I've been getting comments related to my labeling these videos as Bullish or Bearish which may go against the primary trend direction presented on the charts. So, now I've added a TEXT LABEL that tells you what every chart is doing on a Short, Intermediate, and Long-term basis.
This will help all of you follow my analysis/thinking going forward (I hope).
Today's Rotation Pattern suggests the markets will slide into a sideways price rotation phase.
This rotation could be a stalling pattern after the recent rally to new ATHs.
I'm still very cautious of a breakdown/pullback in trend after this move higher. As I keep saying, I don't believe the markets have sufficient momentum to continue a massive rally phase. And I really believe this new ATH level is a BULL TRAP - setting up longs to jump into this rally mode before a bigger pullback/breakdown takes place.
Gold and Silver are struggling to move higher with a fairly broad rotating range - but they are still pushing higher.
I believe Gold and Silver will make a big move higher over the next 30+ days. So, be prepared for volatility - but stick with long trades for metals as I believe Gold will rally to levels above $3100 very quickly.
Bitcoin could be shifting into a new Excess Phase Peak pattern off recent lows. The FPT trends for Bitcoin are still BEARISH, but we are starting to see a base setup that may become a new Excess Phase Peak low.
Watch this video and please comment if you have any questions.
Again, sorry for my delay this morning.
Get some..
#trading #research #investing #tradingalgos #tradingsignals #cycles #fibonacci #elliotwave #modelingsystems #stocks #bitcoin #btcusd #cryptos #spy #gold #nq #investing #trading #spytrading #spymarket #tradingmarket #stockmarket #silver

Are Trump’s Tariffs More Bark Than Bite? What Markets Are SayingThe heated tariff drama is reverberating across global markets with a different impact depending on the region and the asset itself. Some markets, previously considered highly sensitive to extra tax charges, are actually doing better than the dominant stocks on Wall Street. Or maybe that’s just the calm before the storm? Let’s find out.
🌏 Are Europe's Stocks Great Again?
European stocks are leaving Wall Street equities in the dust, contrary to investor expectations ( contrarians, hat tip to you ). Since Donald Trump officially stepped into the top job in American politics (and started the whole tariff narrative) the Europe-wide Stoxx 600 index SXXP has gained roughly 6% to date. Its US counterpart, the S&P 500 SPX is up about 2.5% over the same time span.
Europe’s start-of-year spectacle is so good it prompted Bank of America analysts to dig into the archives and realize this is the old continent’s best opening since the 1980s. That is, while European countries struggle to power up their economies and the European Central Bank is dropping interest rates fast .
The tech-heavy Nasdaq Composite IXIC has fallen out of favor and is languishing around with a 2.2% increase since Trump took office. Moreover, the elite club called the Magnificent Seven is barely getting by. With the exception of Meta META , which is up more than 20% this year, all the others are either underwater or head above the water.
By the looks of it, Trump is gradually rolling out his punishing tariffs but European investors don’t seem too scared. Earlier this week, the US President revealed his intentions to slap the auto industry with a hefty 25% tariff starting April 2. Drugs and chips got picked on, too, with levies in the same neighborhood.
The auto space in Europe is bound to feel the weight of that auto tariff decision. Currently, Europe’s car manufacturers are taxed with a 2.5% levy on their way to the US. In the other direction, however, the US is obligated to pay a 10% duty when it imports cars into Europe.
The proposed auto tariffs knocked Asia’s automaker stocks during the Asian session on Thursday. The Nikkei 225 index NI225 was trading almost 2% lower with the auto sector dragging the broad performance.
👀 What’s Happening Elsewhere?
Gold XAUUSD is apparently the biggest winner of the tariff threat. As long as it doesn’t get slapped with one. The yellow metal has skyrocketed to levels near $3,000 with a Thursday session high of $2,955 per ounce, breaking its record made earlier in the week . What a bonanza for gold bugs as their main asset is up 15% since mid-December with no corrections and no signs of slowdown.
The US dollar has been taking blow after blow, giving rival currencies some much-needed reprieve . The dollar index DXY , measuring the buck’s strength against six forex rivals, is down about 3% from its two-year peak in early January.
Bitcoin BTCUSD , the fire-breathing volatility dragon, has actually been pretty tamed up as Trump’s crypto working group has stayed mostly tight-lipped over the prospects of crypto-friendly legislation. Prices of the orange coin celebrated inauguration day with an all-time record but have slipped 11% since then to dive back under $100,000.
Against that backdrop, what are you loading up on? Are you stacking up some European shares and shunning their US peers? Or you’re after that OG token under $100,000? Let us know in the comment section!

SPX Target 6270 - Can It Get There?SPX Targets 6270 – But Can It Get There? | SPX Market Analysis 20 Feb 2025
The SPX is climbing like a caffeinated squirrel... ok, maybe not. It’s more like a slightly confused sloth trying to find second gear!..., while DJX and RUT are stuck in the mud.
The breakout move we’ve been waiting for has arrived, and now the question is—does it have enough fuel to hit 6270, or will it stumble and trigger my hedge at 6100? Bollinger Bands are too tight for reliable setups, so I’m sticking with my 6 money-making patterns until volatility expands.
Let’s break it all down…
---
SPX Deeper Dive Analysis:
📈 SPX is Soaring (like a fat pigeon!) – But the Other Indexes Aren’t Joining the Party
While SPX is off making new highs, its friends DJX and RUT seem to have lost their invitations.
DJX is struggling to gain meaningful ground 📉
RUT can’t even catch an uptick, making it the weakest of the bunch ❌
Meanwhile, SPX is leading the way, with a clear breakout in play
A closely following NDX is nipping at SPX's heals
💡 Breakout Confirmed – But Can It Hold?
Scenario #1 from our previous discussions has unfolded—the range has broken out.
Target: 6270 🎯
Hedge trigger: 6100 in case the move fails
This is the good kind of waiting—waiting for profits to materialise
🔄 Why I’m Avoiding Tag ‘n Turn Setups Right Now
Normally, after a breakout, I’d shift back to Tag 'n Turn setups. But there’s a problem…
Bollinger Bandwidth is too tight, making moves too fast
Price is flipping from one side of the bands to the other
A Bollinger Band pinch is forming, indicating more compression before expansion
So, what’s the plan?
✅ I’ll continue to use my 6 money-making patterns
✅ I’ll wait for volatility to expand before returning to Bollinger setups
✅ No forced trades—only high-probability moves
🚀 Final Takeaway?
The breakout is here, the target is set, and the plan is clear. Now, it’s time to let the market do its thing and wait for the move to play out.
---
Fun Fact
📢 Did you know? In 2018, Amazon briefly became a $1 trillion company—but it only stayed there for a few hours before dropping back below the threshold.
💡 The Lesson? Even the biggest breakouts can be short-lived—just because a stock (or index) makes a new high doesn’t mean it will stay there forever. Always have a plan—targets and hedge triggers matter.

Datadog: S&P 500 Candidate?! Key Levels to Watch Now!Hi there,
When we talk about the most respected stocks in the market, getting added to the S&P 500 index is a big milestone for any company. It’s not just a status symbol—it’s an event that can push the stock price higher as funds and investors rush to buy it.
Datadog (DDOG) is one of the potential candidates , so let’s analyze what the price action is telling us.
Technical Breakdown:
Right now, Datadog stock is testing a key support level of around $130. This price level has acted as both resistance and support in the past, and in November last year, the stock broke above it. Now, it has come back to retest this level, possibly looking for a base before making its next move.
If $130 holds as support, and the company’s fundamentals remain strong, this could be a solid entry point for buyers.
A secondary support zone to watch is near $100, about 25% lower than the current price. This level has seen big price movements before, meaning there could be strong interest from traders and investors if the stock drops there.
As legendary investor Peter Lynch once said:
"If you sell instead of buying when a stock drops 25%, you won’t achieve long-term profits in stocks."
This idea is also the foundation of my approach – what to do when the price drops? Am I ready to buy more at lower prices? If the answer is something like “probably not,” “not sure,” etc., then it’s worth considering whether it’s even worth buying in the first place!
Plans for different types of investors:
Short-Term Investors: If you’re looking for a quick trade, you might want to wait for a dip to $100, where a stronger bounce could happen. Buying from current prices can be a bit risky considering short-term horizons.
Long-Term Investors: If you believe in Datadog’s continued growth, the $130 level might already be a good spot to start buying. But be ready to buy more if the price drops further.
Final Thoughts:
Datadog is a fast-growing company with strong fundamentals, but the stock also has a high valuation and faces competition. As always, do your own research and make sure your investment strategy fits your risk level and goals.
Cheers,
Vaido
🚀 Stay Ahead of the Markets!
Get high-quality technical analysis, real investment ideas, and key price levels—without the noise.
📩 Subscribe to my Substack for expert insights that help you trade smarter!
📱 On mobile: Just scroll down and select your preferred language.
💻 On desktop: Find the links in my BIO—copy & paste or click the Website icon to go directly to Substack ENG.

Why the Dow Jones might close its gap with S&P and NasdaqThe S&P 500 and Nasdaq have once again reached record high, leaving the Dow Jones for dust in its choppy consolidation. But I think we're now facing a relative shift in their performance, which could see the Dow lead the way and close its gap with its Wall Street Peers.
Matt Simpson, Market Analyst at City Index and Forex.com

Bullish Cypher - SPY spotted a bullish Cypher pattern on SPY’s daily chart, and it looks promising.
Entry: Current Market Price
Stop Loss: 575.50, just under the D-point, to give the trade some breathing room.
Targets: All time high
Ideas and Inputs are welcome.
Thank you for dropping by.
Disclaimer:
This analysis is for educational purposes only and is not financial advice. Trading involves significant risk, and you should only trade with money you can afford to lose. Past performance is not indicative of future results. Always do your own research and consult with a financial advisor before making any trading decisions.

SPX, what should we expect?Since 1932, the price has touched this trendline many times, which means that this trendline is very strong and important. SPX and back to home Just be patient.
change the line chart to the candlestick. everything will be obvious.
I'm telling you about the end of the cycle not now. Spx can go higher. but I don't care. It's not a good time to buy and invest

US500 NEW PRICE !hello friends
As you can see, this index tried to break its ceiling 2 times, which faced correction, but in the third encounter, it succeeded in breaking the ceiling and was able to give this signal that the price can go up to 6200 or even higher.
*Trade safely with us*

SPY/QQQ Plan Your Trade For 2-19-25: GAP Reversal Counter-trendToday's pattern suggests a morning GAP will lead to a price reversal in a counter-trend type of mode.
I read this as a potential that price will initially struggle to find a trend. Eventually, when it does identify a trend mode, I believe that trend will strengthen into a reversal of the current upward price trend.
Normally, Counter-trend patterns invert. So, what I would have expected as an uptrend would turn into a downtrend. But, the markets have moved into a very consolidated price channel near recent highs and volume has diminished strongly.
Because of this type of setup, I believe an aggressive breakaway or breakdown price move is pending.
Price will attempt to make a move - and when it does, it should be explosive.
My continued research, which I share with you in this video, continues to suggest price will stall out and revert downward.
We'll see how things play out over the next few days.
Gold and Silver are back near recent all-time highs. Stay cautious of a breakdown in metals associated with a breakdown in the SPY/QQQ.
BTCUSD is still struggling to make a move. As you will see, I believe the dominant trend is to the downside right now.
In short, we are standing at the edge of a cliff regarding price action. At this point, we either grow wings and soar higher or fall downward - hoping for a soft landing.
Buckle up.
Get some.
#trading #research #investing #tradingalgos #tradingsignals #cycles #fibonacci #elliotwave #modelingsystems #stocks #bitcoin #btcusd #cryptos #spy #gold #nq #investing #trading #spytrading #spymarket #tradingmarket #stockmarket #silver

S&P corrective pullback after bullish breakout to new ATHS&P (US500) index pair price action sentiment appears bullish, supported by the longer-term prevailing uptrend. The recent intraday price action appears to be a sideways consolidation after reaching the intraday all time high.
The key trading level is at 6080 level, the consolidation price range and also the previous resistance now newly formed support zone. A corrective pullback from the current levels and a bullish bounce back from the 6080 level could target the upside resistance at 6140 followed by the 6160 and 6200 levels over the longer timeframe.
Alternatively, a confirmed loss of the 6080 support and a daily close below that level would negate the bullish outlook opening the way for a further retracement and a retest of 6030 support level followed by 6000.
This communication is for informational purposes only and should not be viewed as any form of recommendation as to a particular course of action or as investment advice. It is not intended as an offer or solicitation for the purchase or sale of any financial instrument or as an official confirmation of any transaction. Opinions, estimates and assumptions expressed herein are made as of the date of this communication and are subject to change without notice. This communication has been prepared based upon information, including market prices, data and other information, believed to be reliable; however, Trade Nation does not warrant its completeness or accuracy. All market prices and market data contained in or attached to this communication are indicative and subject to change without notice.

SPX In Limbo - Which way will it break?SPX in Limbo – Will It Break Up or Down? | SPX Market Analysis 19 Feb 2025
Still waiting. Yep, that’s where we are.
The market is about as exciting as watching paint dry, but this is not the time to get impatient. As much as I’d love to jump into a trade just to feel productive, I know better—waiting for the right entry beats chasing the wrong one.
Let’s break it down while we sip on tea and pretend to be Zen masters of market patience.
---
SPX Deeper Dive Analysis:
Why Patience is Everything in Trading
There’s an old trading rule that never fails—the market will always move… eventually. But right now, it’s in one of those frustrating, indecisive moods where:
Nothing is confirming (so forcing a trade is a bad idea)
It’s stuck between two key levels (meaning we wait for the breakout or breakdown)
Volume is sluggish (which means false moves are more likely)
Still Watching Two Scenarios
☑ Scenario #1 – The Bullish Breakout Entry
Needs price to confirm above key resistance
No fakeouts—just clean, strong momentum
Only then do I consider a bullish trade
☑ Scenario #2 – The Bearish Reversal Entry
Needs clear rejection at resistance
No weak, choppy movements—just a solid confirmation
Only then do I take a bearish setup
Why Forcing Trades is a Losing Game
Let’s be honest—waiting is boring. But do you know what’s worse? Jumping into a trade just because you're impatient… and then watching it immediately go against you.
Every trader, at some point, has thought:
"It looks like it’s going to move, maybe I should enter early…" (Nope.)
"I don’t want to miss the move…" (You won’t—if you follow the plan.)
"Other traders are jumping in—should I?" (Nope. They’re probably wrong.)
The right trade at the wrong time is still the wrong trade.
What’s Next?
✅ Stay patient—the market will tip its hand soon enough
✅ Wait for clear confirmation—not “I think this might be it” confirmation
✅ Don’t trade out of boredom—trade because the setup is 100% valid
📌 Final Takeaway? Patience = profit. I’m still waiting, tea in hand, and when the market finally makes its move, I’ll be ready.
---
Fun Fact
📢 Did you know?
The stock market used to take 5 months to process a trade before the 1970s. Now? It happens in milliseconds—but traders still struggle to wait a few hours for the right setup.
💡 The Lesson?
Patience has always been a trader’s best tool. Some things never change.

XAUUSD ANALYSIS FOR THE WEEKXAU/USD (Gold vs. US Dollar) Analysis: February 17 – Febrauary 25, 2025
This analysis provides an in-depth evaluation of gold’s potential trajectory over the specified period, integrating fundamental drivers, technical indicators, and expert forecasts. Key factors influencing gold include geopolitical risks, monetary policy shifts, inflation trends, and technical patterns.
1. Fundamental Drivers
A. Geopolitical and Economic Uncertainty
Trade Tensions: The U.S. administration’s recent tariffs (e.g., 25% on Mexican and Canadian imports, 10% on Chinese goods) have amplified global trade risks, increasing demand for gold as a safe-haven asset.
Middle East and China Risks: Escalating geopolitical tensions in the Middle East and a slowdown in China’s economy (evidenced by a decline in the Caixin PMI) are further driving investors toward gold.
B. Monetary Policy and Inflation
Fed Rate Cuts: Expectations of two Federal Reserve rate cuts in 2025 and dovish stances from the ECB and BoE are weakening fiat currencies, boosting gold prices.
Inflation Hedge: Persistent inflation, driven by tariffs and supply-chain disruptions, enhances gold’s appeal. Analysts caution that U.S. inflation could exceed targets, forcing the Fed to reverse rate cuts, which may temporarily support the USD but ultimately favor gold.
C. Central Bank Demand
Central banks, notably China’s PBOC, are accumulating gold reserves to diversify away from the USD, creating structural demand.
2. Technical Analysis
A. Short-Term Signals (February–March)
Momentum Indicators: The RSI (26.05) and Stochastic Oscillator (14.5) signal oversold conditions, suggesting a potential rebound.
Key Levels:
Support: $2,830 (February 10 analysis) and $2,720 (ascending channel lower boundary).
Resistance: $2,887 (immediate target) and $2,900 (psychological barrier).
2. Key Technical Levels
Support Levels:
Immediate Support: $2,880 – This level aligns with the 23.6% Fibonacci retracement from the recent rally.
Critical Support: $2,850 – Represents the lower boundary of the ascending channel formed since late 2024.
Resistance Levels:
Immediate Resistance: $2,920 – A breach could trigger bullish momentum toward higher targets.
Key Resistance: $2,959 – The upper boundary of the channel and a major psychological level.
3. Momentum Indicators
Relative Strength Index (RSI): Currently at 62, indicating bullish momentum but approaching overbought territory.
Moving Averages (MA):
50-Day MA: Positioned at $2,910, offering dynamic support.
200-Day MA: Located at $2,780, signaling long-term strength.
Stochastic Oscillator: Signals potential upside as it exits oversold conditions on the 4-hour chart.
4. Chart Patterns and Trends
Ascending Channel: Gold continues to trade within an ascending channel, maintaining a bullish structure.
Bullish Flag Formation: On the daily chart, a bullish flag suggests a potential breakout if prices sustain above $2,920.
Candlestick Signals: Last Friday’s bullish engulfing pattern highlights strong buying interest.
5. Scenarios for the Week
Bullish Scenario:
A breakout above $2,920 could target $2,965 and $3,000.
Momentum indicators support further upside if geopolitical tensions persist.
Bearish Scenario:
A failure to hold $2,880 may lead to a decline toward $2,850.
Profit-taking or USD strength could pressure gold, particularly if U.S. economic data surprises positively.
Bullish Targets/ Resistance
2890
2906
2928
2934
2959
2972
2987
3023
Bearish/Support
2872
2857
2841
2807
2781

SPY/QQQ Plan Your Trade Post Market Update : Big Squeeze CloseToday is quite a day in terms of trading volatility and volume. We've not seen a low-volume day like today in the SPY for more than a year.
It is very likely this rally near the close of trading was more of a short-squeeze and not really a momentum breakout.
We'll see how things play out tomorrow. But, I'm not budging related to my expectations of a breakdown in the markets over the next 5-10+ days.
I see this market as completely over-cooked to the upside - and it seems to be evident in the lack of buying volume playing out.
My Custom Crash index is flat and topping. My Custom Volatility Index is flat and topping. My Custom US Leading Index is actually LOWER so far this week.
One thing is certain, there is a lot of open "air" below the 598 level on the SPY.
Buckle Up.
When it breaks - it may be a BIG BREAKDOWN setting up.
Get Some.
#trading #research #investing #tradingalgos #tradingsignals #cycles #fibonacci #elliotwave #modelingsystems #stocks #bitcoin #btcusd #cryptos #spy #gold #nq #investing #trading #spytrading #spymarket #tradingmarket #stockmarket #silver

S&P 500 BREAKOUT?! 18.2.25Simple as can be.
1. November 2024 - Feb 2025 wedge pattern, converging support and resistance with higher highs and lows.
2. Descending trend-lines within the wedge, first line broken Jan 16th (highlighted) - 3% jump in 3 days of trading, second line broken today, Feb 18th.
3. Potential rise to the top of the wedge pattern, around the mid 6300's.
Stay logical, with a plan and consistent.
Fortune favors the brave!

SPY/QQQ Plan Your Trade For 2-18 : GAP PotentialAs the markets continue to struggle to break away from the current consolidated/sideways price trend, one thing is certain: The current FLAG/EPP pattern is setting up an explosive price move.
My expectations are for a price breakdown, as my predictive modeling and GANN Cycle Patterns suggest that Major Bottoms will set up near February 21 and March 21-23.
These major Bottoms suggest a strong potential for a price breakdown, reflecting uncertainty for the first half of 2025.
Additionally, I believe the strength of the US Dollar is driving a "Capital Shift," where foreign capital is actively moving away from currency and economic risks, pooling aggressively into the safest currency and assets. This translates into capital pooling into US, UK, and EURO assets to avoid broader currency devaluation events.
The dynamics of the global markets are very interesting right now. The influx of capital into the strongest economies with the strongest currencies may present a MELT-UP type of market trend. However, the uncertainty related to future US economic growth and performance may prompt some deep downturns/pullbacks in price.
I don't see how the US markets can move past the economic turmoil of broad government restructuring until after June/July 2025.
Therefore, I continue to urge traders to stay cautious of any melt-up trend. The markets want to move higher, but there are currently extreme volatility risks related to any potential price breakdowns.
I'm watching Gold/Silver and Bitcoin to see if we move back into any euphoric phase. And right now, I'm seeing metals starting to move into a type of panic selloff while Bitcoin is struggling to regain any real strength.
The continued sideways trend of Bitcoin leads me to believe the euphoria is diminishing, and reality may be setting in. That means we may be in for a bumpy ride over the next 90+ days.
Stay fluid and stay cautious of any big breakdowns.
Get some.
#trading #research #investing #tradingalgos #tradingsignals #cycles #fibonacci #elliotwave #modelingsystems #stocks #bitcoin #btcusd #cryptos #spy #gold #nq #investing #trading #spytrading #spymarket #tradingmarket #stockmarket #silver

Daily Market Outlook: BTC, Forex & SPX Setups (#4)Hope you’re all having a great start to the week! I’m Skeptic , and today we’ll break down BTC, Forex, and a key setup on SPX.
📉 BTC Analysis – Stuck in a Range, But Not for Long!
BTC is currently range-bound after getting rejected from $107K. The range is wide and indecisive, signaling that the market is waiting for a strong catalyst before making its next move.
📊 Key Observations:
Low volume & high volatility = poor R/R for trades inside the range.
Breakout traders should wait for confirmation:
✅ Bullish Breakout : Above $98,455, or even earlier if momentum kicks in.
🔻 Bearish Breakdown : Below $95K, which could trigger a stronger move down.
⚠ Until a breakout happens, trading inside this range isn’t ideal due to stop hunts and fake moves.
📊 BTC.D Dropping – Is Altcoin Season Heating Up?
BTC dominance (BTC.D) has been declining recently, which suggests capital rotation into altcoins.
📊 Why This Matters?
Coins like XRP, BNB, and CAKE have started to gain traction.
Watching BTC.D is crucial—it helps determine if money is staying in BTC or shifting to alts.
A continued BTC.D drop could mean more upside for alts.
📉 DXY (Dollar Index) – Entering a Deeper Correction?
We’ve been talking about DXY weakness for a while, and now, after breaking below 107.311, we’re seeing a deeper correction.
📊 Potential Targets Based on Fibonacci:
✅ 105.677 (first level)
✅ 103.306 (deeper retracement)
💡 Since DXY is weak, we might see strength in EUR pairs and stock indices this week.
📈 SPX500 – Major Breakout Watch!
SPX500 has been in a long consolidation phase after hitting an all-time high of 6113.92. Now, it’s approaching 6128.89—its key resistance level.
📊 Trade Setup:
✅ Long Entry: Above 6128.89, with confirmation.
✅ Why This Level? A breakout and confirmation could signal continuation of the uptrend.
✅ Extra Tip: Using momentum indicators like SMA & RSI can help filter out fake breakouts.
Final Thoughts & Risk Management
⚠ BTC is still ranging—stay patient and wait for clear structure before trading.
⚠ DXY weakness could support stocks & EUR pairs this week.
⚠ SPX breakout setup looks promising but needs confirmation.
💬 I’m Skeptic , and I’ll see you tomorrow with another market breakdown! 🚀
⚠ Disclaimer: These trade setups are based on my personal analysis and are not financial advice. If you don’t have a solid risk management plan, these triggers may not be suitable for you. Always do your own research (DYOR) and trade at your own risk. 💡

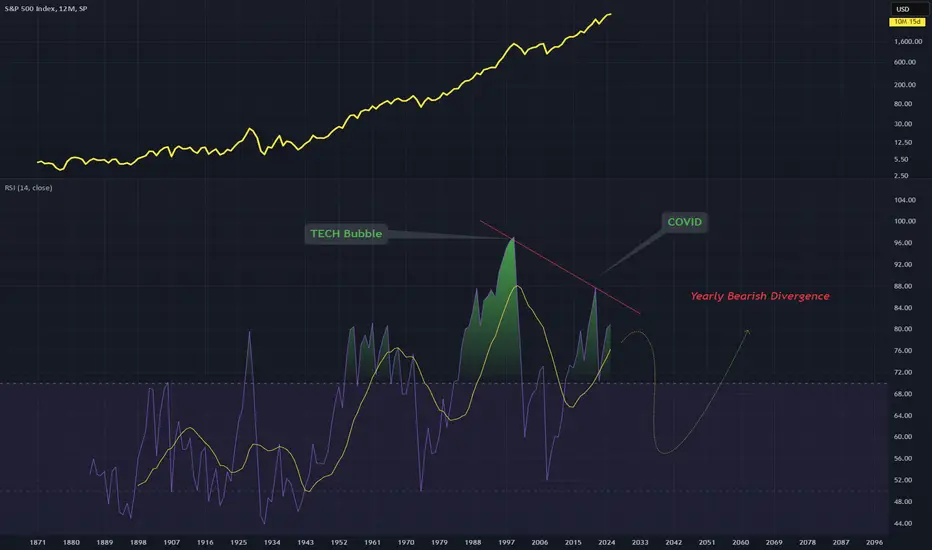
SPX RSI AnalysisThe Tech Bubble (2000) peak and the Peak during covid has formed a large bearish divergence on this yearly timeframe
this points to a potential trend shift on the yearly timeframe and another bear move
I'm bearish on stocks right now and bullish on crypto and rare metals
Additional post to my previous one which shows my downward move thoughts on the SPX