There's a storm on my chartHi everyone,
I see two possibilities.
Blue or Brown ? (we have to see!)
Technical Section:
The Blue Path: S&P500 is completing the fifth wave of the 5th wave of a five-wave rally.
Wave 5 = 2.618 x length of Wave 1
Wave 3 = 2 x length of Wave 1
Target = 5790
The Brown Path: S&P500 is completing the fifth wave of the 3rd wave of a five-wave rally.
Wave 3 = 4.236 x length of Wave 1
Target = 6440
S&P 500 (SPX500)

SPY/QQQ Plan Your Trade For 2-11 : GAP DefenderThe GAP Defender pattern is where price struggles to maintain a recent open GAP - attempting to defend against closing that GAP.
In my mind, this is the lower GAP window between 601.30 and 602.75 (yesterday's opening GAP range).
If this recent gap is filled, then I suggest the SPY will attempt to move downward (into my Deep-V breakdown) trying to target the lower GAP near 584.29.
Watch Gold and Silver as they continue to breakdown. Any big breakdown in metals should be considered a warning sign the markets are moving into a PANIC phase (selling).
We have lots of news today (Powell and other Fed members testifying) while we just found out Trump initiated a larger tariff on steel. I believe the strength of the US Dollar will continue to put pressure on global currencies - possibly leading to even more foreign market distress. This may result in a broader global market breakdown over the next 5-10 trading days.
Remember, we have the Deep-V pattern setting up this week and another Major Bottom pattern setting up on Feb 21. I interpret this as a dual-breakdown event - where price attempts to move downward and tries to identify solid support.
Bitcoin will likely follow this trend downward over the next 5 to 10+ days.
Buckle up.
It looks like today may be the day my Deep-V breakdown starts to drive prices lower for the SPY/QQQ and other major sectors.
We'll see how things play out.
Get some.
#trading #research #investing #tradingalgos #tradingsignals #cycles #fibonacci #elliotwave #modelingsystems #stocks #bitcoin #btcusd #cryptos #spy #es #nq #gold

Your Vote Counts - Help Build the Ultimate Index Watchlist!Hey, I need your help again - this will only take a minute!
I’ve said it before, here and to my Substackers: I want to be your reminder to invest . Because let’s be honest, steadily growing your wealth might not be thrilling but it should be your goal!
Yes, individual stocks have their place (and I’ll keep sharing ideas on those too), but indexes should be a key part of a solid portfolio. Today’s focus? Maximizing your index purchases.
📊 Proven strategy: A few weeks ago, I ran an experiment comparing QQQ (Nasdaq-100 ETF), SPY (S&P 500 ETF), and IWM (Russell 2000 ETF). Using technical analysis, I outperformed two of them. The tests showed that blind purchasing could be costly: for instance, regular SPY purchases would have left $100,000 on the table, and IWM even more.
But here’s the point: this isn’t about blindly picking an index - it’s about timing, risk optimization, and smart diversification.
💡 Now, it’s YOUR turn! Drop two indexes in the comments that you want me to analyze every single month.
You decide the final list (likely 4-5 indexes), and I’ll cover them consistently. Whether it’s S&P 500, Nasdaq-100, DAX, Euro Stoxx 50, Russell 2000, or others - you pick, I deliver.
📈 How this helps YOU?
✔️ No overthinking : "What should I buy this month?" - just wait for my post and see the TOP picks
✔️ Keeps you engaged and active in the market
✔️ Builds consistency in your investing
✔️ Ensures every allocation works harder for you
⬇️ Comment your picks below, and let’s make every move count! 🚀
Cheers,
Vaido

Bearish Bias Locked int - Now We wait for the dropBearish Bias Locked In – Now We Wait for the Drop | SPX Market Analysis 11 Feb 2025
The bullish chapter is closed, and our focus is now entirely bearish as we eye a move toward 5980. Futures are already pointing lower, teasing a 20-point drop at the open.
Will we get the full range move, or will SPX keep stalling?
Either way, we’re locked and loaded—now, we wait for the market to tip its hand.
---
SPX Deeper Dive Analysis:
📉 Bearish Positions Locked In
SPX is now fully bearish, with bullish trades wrapped up profitably or at break-even following the bear turn signal. This continues to aligns perfectly with our 6 money-making patterns, where we expect a move from range highs to range lows.
📊 Futures Hint at a Lower Open
Overnight futures are already down 20 points, suggesting:
✅ A weaker SPX open
✅ A potential move toward 5980
✅ Confirmation that momentum is shifting lower
🔍 ADD Still Has Room to Fall
Yesterday’s ADD reading hit the upper bullish extreme
That leaves plenty of downside wiggle room
If ADD pushes lower, indexes could also follow through
⏳ For Now, It’s a Waiting Game
The bearish setup is in place
Price action will dictate the next move
A clean range move to 5980 remains the primary target
🚀 Key Takeaway? The market is aligning with expectations, but we still need follow-through to lock in profits.
Fun Fact:
📢 Did you know? In 1987, the Dow dropped 22.6% in a single day—the biggest percentage crash in history. That’s the equivalent of the S&P 500 dropping over 1,000 points today!
💡 The Lesson? Even in structured markets, major moves can happen fast. This is why having a rule-based trading system keeps you ahead of the chaos.

S&P - WEEKLY SUMMARY 3.2-7.2 / FORECAST📉 S&P500 – 4th week of the base cycle (average of 20 weeks). The pivot forecast on February 3 pushed the market upward after the overnight tariff gap. If you remember, I was in a short position at Friday’s close on January 31. I got tempted by the overnight tariff hysteria and closed my position in the morning. The European morning provided a great intraday opportunity to buy back the market with a good profit and open a long position on the pivot forecast.
⚠️ The cycle’s beginning looks very bearish, with a short rise followed by a steep drop below the opening level. I anticipated this in early January. By Friday’s close, signs of a double top at the December 9 and January 29 extreme forecast levels appeared. Strong hands with stops above the double top level should have held their short positions from January 24. The impulse from the January 29 extreme forecast is still active. Two long cycles remain open, as noted in the early January post.

SPY/QQQ Plan Your Trade Update - Watching Paint Dry...Today's market seems to be trapped in a "go nowhere" zone.
Get thread though. The markets will react to my Deep-V and Breakdown patterns with some aggression in the near future (24 to 48+ hours).
Buckle up.
This is going to get very interesting as the SPY attempts to move down to 585-590 - or lower.
Get some.
#trading #research #investing #tradingalgos #tradingsignals #cycles #fibonacci #elliotwave #modelingsystems #stocks #bitcoin #btcusd #cryptos #spy #gold #nq #investing #trading #spytrading #spymarket #tradingmarket #stockmarket #silver

SPY/QQQ Plan Your Trade For 2-10: EveningStar Island PatternThroughout the past week and a half, I've been watching the markets as I prepare for what I believe will be a sudden and fairly aggressive Deep-V setup between 2-10 and 2-13.
Yes, that means RIGHT NOW we are sitting on top of a potentially aggressive type of FLASH market move to the downside.
Will it come from news, or someone's comments (think Fed comments or news), or will it come from some other source - if it shows up at all.
I'm sticking to my Deep-V analysis because I have no reason to believe it is wrong. We may see a mild type of Deep-V pattern, but I believe it will happen anyway.
So, as we move into this week's trading, I want to urge everyone to stay very cautious of a potential FLASH breakdown into my Deep-V type of price activity.
As you may get trapped into longs and feel comfortable entering some solid bullish price trends/trades, be aware that this FLASH breakdown (Deep-V pattern) may still be lurking behind what appears to be a solid uptrend (for now).
Gold and Silver are falling - which is perfect for my Expansion Phase rally to $4400+ (gold).
Bitcoin is stalling - preparing for a breakdown.
This is the time to prepare for the rest fo 2025. Follow my research to know when you JUMP INTO the markets for greater success.
Get some.
#trading #research #investing #tradingalgos #tradingsignals #cycles #fibonacci #elliotwave #modelingsystems #stocks #bitcoin #btcusd #cryptos #spy #gold #nq #investing #trading #spytrading #spymarket #tradingmarket #stockmarket #silver

SPX WEEKLY PRICE ACTION 10TH FEB 2025This is the price action of SPX at its very best & exclusively for viewers on trading view.
I have discussed in depth price action of SPX and if you have any doubts feel free to leave a message or your comments below.

Bullish bounce off 61.8% Fibonacci support?S&P500 is falling towards the support level which is a pullback support that aligns with the 61.8% Fibonacci retracement and could bounce from this level to our take profit.
Entry: 5,989.66
Why we like it:
There is a pullback support level that aligns with the 61.8% Fibonacci retracement.
Stop loss: 5,932.99
Why we like it:
There is a pullback support level.
Take profit: 6,072.50
Why we like it:
There is a pullback resistance level.
Enjoying your TradingView experience? Review us!
Please be advised that the information presented on TradingView is provided to Vantage (‘Vantage Global Limited’, ‘we’) by a third-party provider (‘Everest Fortune Group’). Please be reminded that you are solely responsible for the trading decisions on your account. There is a very high degree of risk involved in trading. Any information and/or content is intended entirely for research, educational and informational purposes only and does not constitute investment or consultation advice or investment strategy. The information is not tailored to the investment needs of any specific person and therefore does not involve a consideration of any of the investment objectives, financial situation or needs of any viewer that may receive it. Kindly also note that past performance is not a reliable indicator of future results. Actual results may differ materially from those anticipated in forward-looking or past performance statements. We assume no liability as to the accuracy or completeness of any of the information and/or content provided herein and the Company cannot be held responsible for any omission, mistake nor for any loss or damage including without limitation to any loss of profit which may arise from reliance on any information supplied by Everest Fortune Group.

CRASH - CRASH - CRASH - Don't believe a word of it...I created this video because I'm seeing a bunch of content/videos where everyone is suddenly calling for a CRASH. and I laugh about it.
If you want to believe the markets are going to CRASH - go for it.
Sell everything. Bet the farm on the CRASH. Leverage your house and everything you own to bet on the CRASH.
It's not going to happen soon.
My research is very clear. I believe the first opportunity for a deep (more than 25-35%) market pullback will happen after late 2029 and into 2030.
Until then, we are going to see moderate pullbacks in a very solid uptrend.
Watch this video and learn why real research and modeling systems don't react to the Crash-Dummies that continually push out CLICK-BAIT.
It's time to get real about your trading and investing.
If you are following someone who continually calls for a market crash - good luck.
At some point, you are going to come to the realization they are wrong 90% of the time. Try to find someone you trust who provides clear, timely, and ACCURATE forecasts.
Get some.
#trading #research #investing #tradingalgos #tradingsignals #cycles #fibonacci #elliotwave #modelingsystems #stocks #bitcoin #btcusd #cryptos #spy #gold #nq #investing #trading #spytrading #spymarket #tradingmarket #stockmarket #silver

Nifty's Battle Between Bears and Bulls & S&P 500 resistance test#Nifty50 wrapped up the week at 23,560, marking a 80-point increase from the previous week's close. It reached a high of 23,807 and a low of 23,222. As predicted last week, Nifty traded within the range of 24,000-22,950, and looking ahead, I anticipate the index will continue moving within the range of 24,000-23,050 next week.
Currently, the monthly and weekly timeframes are both bearish, while the daily timeframe shows a slight bullish bias. This indicates that the bears remain in control, and they will likely seize every bounce as an opportunity to initiate short positions. I still believe that the 22,400/22,500 level is critical, as it presents an opportunity for the bulls to establish a base and potentially push Nifty higher.
The BJP's victory in the Delhi assembly elections could have a positive impact on the market come Monday, offering a window to offload positions and create fresh shorts. My focus will remain on stocks that are either building a strong base or demonstrating resilience in this otherwise negative market environment. These hidden gems, or 'dark horses,' could emerge as the true winners in the near future.
On the global front, the S&P 500 closed at 6,025, a mere 14 points down from the previous week's close, with a high of 6,101 and a low of 5,923. Over the past three weeks, the S&P 500 bulls have repeatedly attempted to break the strong resistance level at 6,100, but they’ve failed to maintain momentum above it. A decisive close above 6,100 is now critical for the rally to gain steam and target levels at 6,142, 6,225, and 6,376. If this resistance holds, the bears are ready to pounce, and we could see a test of support levels around 5,850—about 3% lower than the current level.
It’s a crucial battle ahead, and while I’m rooting for the bulls, my focus is on the bears. Let’s see who comes out on top!

Weekly Market Forecast: S&P, NAS & DOW Are Still Bullish!This forecast is for the week of Feb 10-14th.
The S&P500, the NASDAQ, and the DOW JONES are still bullish overall, despite last weeks NFP news that saw the markets move lower. Until there is a bearish break in market structure, it is buys all the way. Let the markets reach the buy zones and wait for the bullish market structure shift. That is the time to take valid buy setups.
Enjoy!
May profits be upon you.
Leave any questions or comments in the comment section.
I appreciate any feedback from my viewers!
Like and/or subscribe if you want more accurate analysis.
Thank you so much!
Disclaimer:
I do not provide personal investment advice and I am not a qualified licensed investment advisor.
All information found here, including any ideas, opinions, views, predictions, forecasts, commentaries, suggestions, expressed or implied herein, are for informational, entertainment or educational purposes only and should not be construed as personal investment advice. While the information provided is believed to be accurate, it may include errors or inaccuracies.
I will not and cannot be held liable for any actions you take as a result of anything you read here.
Conduct your own due diligence, or consult a licensed financial advisor or broker before making any and all investment decisions. Any investments, trades, speculations, or decisions made on the basis of any information found on this channel, expressed or implied herein, are committed at your own risk, financial or otherwise.

Monday sell Off? History May Repeat Itself...Monday Sell-Off? This Setup Says It’s Coming... | SPX Market Analysis 10 Feb 2025
Another week wraps up, and as I eye Monday’s open, I can’t shake a sense of déjà vu.
The last two weeks started with a gap down, followed by a bearish finish into the weekend.
Super Bowl Sunday is also here – Can the Kansas City Chiefs complete an unprecedented three-peat in Super Bowl 59 or will the Philadelphia Eagles gain revenge? Just like the markets, only time will tell and we will have to wait and see.
That said, Friday’s setup is setting the stage for another pop ‘n drop. The only question? What triggers the fall this time?
...
SPX Deeper Dive Analysis:
📉 Mondays Have Been Bearish – Will This One Be Too?
The last two Mondays started with a gap down, followed by a bearish move into the weekend. If the pattern holds, next week could open with a bang – but not necessarily to the upside.
🏈 Super Bowl & The Markets – A Perfect Parallel?
The markets are playing their own Super Bowl showdown. Will the bulls make a comeback, or will the bears crush their hopes yet again? Just like the Chiefs vs. Eagles, we can only wait and see.
🔻 Friday’s Bearish Setup – A Warning Sign?
- V-shaped reversal entry ✅
- Bearish pulse bar confirmation ✅
- Similar daily bar pattern to the last two Fridays ✅
📌 So What Happens Monday?
If history repeats itself, we could see:
- A pop higher at the open, luring in buyers 🏹
- A sharp drop shortly after, trapping the late bulls 🕳
- A repeat of the last two weeks' bearish close 📉
🔑 Key Takeaway: The setup is there. Now we wait for the trigger.
Fun Fact:
📢 Did you know? The Super Bowl Indicator suggests that if an AFC team wins, markets go bearish, but if an NFC team wins, markets go bullish.
💡 The Lesson? As ridiculous as it sounds, market psychology is a wild beast. While we don’t trade superstition, it’s always fun to see how random events get tied to stock performance.

S&P 500 Daily Chart Analysis For Week of Feb 7, 2025Technical Analysis and Outlook:
During the weekly trading session, the S&P 500 effectively hit critical support levels at 5996 and 5936, respectively. A downtrend presently characterizes the market, as bullish momentum is stalled. Current analyses indicate that this downward trajectory will likely persist, with anticipated retesting of the Mean Support levels of 5996, the possibility of trading at Mean Support 5936, and a significant decline to the Outer Index Dip at 5878. Should this scenario not materialize, the market is favorably positioned for the subsequent phase of the bullish trend, with the test of the newly established resistance level at 6083 and revisiting the previously completed Outer Index Rally level of 6120.

Let's speak about savings...Hey guys,
As I've lately taken great interest in publishing my trading ideas here on TradingView,
I want to speak about something that rarely if ever gets spoken about in the trading community, by trading community I mean us goobers on charts who do intra-day, swing, day trading etc... who get sad for not making 10% a month on forex etc...
That is your savings, specifically investing your savings on a long term basis and compound the interest earned by the dividend yields.
Useless to say that I'll be speaking about the S&P 500 and how you can approach it too.
First of all, you can't directly buy the S&P500 that you see here on trading view, as this is an index and in order for you to invest in the performance of the index you need to buy into ETFs, mutual funds, or derivatives like options and futures that are designed to track it.
There are many big funds around, like iShares, Fidelity, Vanguard, Amundi etc...
To be honest the one I personally invest into is the Core S&P 500 USD Acc from iShares that auto compounds the dividends but you really can choose between tens of funds.
The key factors that you must keep into consideration when choosing a fund are these:
- Currency of the fund (what currency is the fund based on)= if it is another country's currency, you'll have to exchange it every time you want to make an entry, amounting to extra commissions and fees that aren't sexy.
- Dividends= if the fund pays out dividends, if it pays it in cash or shares or if it self reinvests them or it doesn't...
- Tax residency of the fund (on which exchange is the Fund/ETF listed on)= important as when it will come to pay your taxes, some funds may have extra taxes due to the residency/exchange.
Now... let's get to the sauce, you have probably heard about DCA (Dollar Cost Average) as it's been rubbed on your face by everyone who never looked at a chart, and that's a valid approach if you are 50, but we spend half of our days on the charts so we want to work based on charts and price, not on time.
My philosophy behind this is that, if our goal is maximizing profit while spreading entries evenly, we should aim to get the best entries, and how could time, which has nothing to do with price, dictate our entries?
It is quite literally putting your finger down randomly on the chart and choosing to enter there.
There is a way easier and more effective approach, and that's basing yourself on price by simply buying the dip.
Yes, I quite literally wrote all of this article just to tell you to buy the dips, but here's a little practical example on why buying the dip performs better than DCA and what values you could look for yourself to try to optimize your entries.
The most basic approach to DCA is to buy a set amount each month, for the sake of the example let's say you would have bought $1000 worth of shares every 30 days starting from Feb/2022, your entries would have been spread out randomly and you would end up with roughly $42.000 today, which would be more if you reinvested all the dividends and profits.
A better approach would be buying each time there is a dip of X percentage in price.
If during the same time we would have bought about 200$ every time price dipped 1.25% we would have made 192 entries and made around $51.000 without compounding interest and dividends, then that would be closer to 55.000 - 60.000.
All of this just by basing ourself on price and not time.
You wouldn't evaluate taste with sounds, or sounds with numbers... so why evaluate numbers with time? Rather stick to what the chart itself does and get the best spread out entries possible, like this not only you would make more money, but have way more entries spread out through the chart for about the same initial capital, which is not bad when you are planning to long term invest.
To wrap it up, my practical example is buying the S&P500 (or another index you like), every time price drops of 1.25% - 1.75% in a single day, and compound interest every time you get a entry. Like this you'll set yourself an long term investment fund that will grow exponentially through the years and help you more than save your money through the years.
As as we all know but not admit that spending comes easy when money is laying around, so stash the unnecessary and see it grow ;)
the numbers in the example are rough estimates but give the actual idea of performance, and excuse me for the simplicity of the argument but it always comes handy

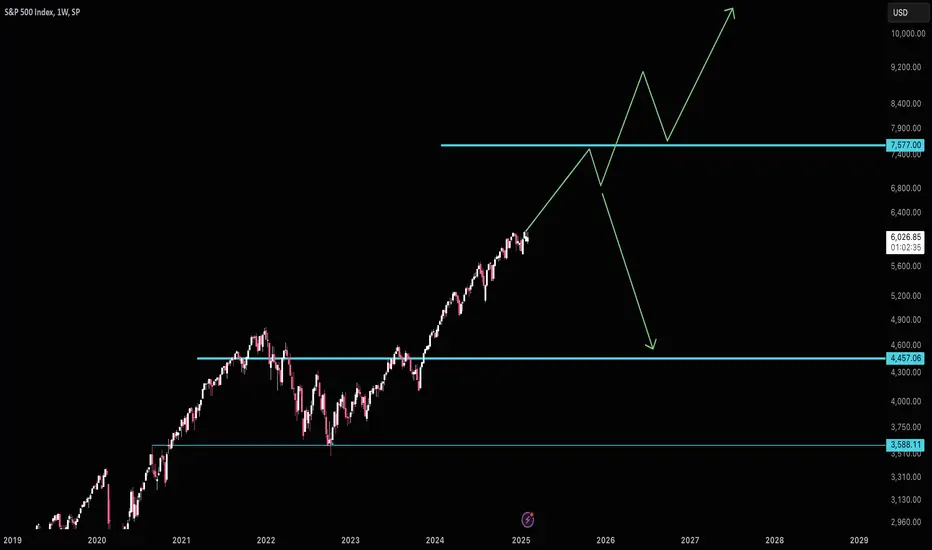
S&P500 still has room to run to 7580S&P500 resistance is likely up near 7580. Expect a pullback and then new highs. Depending on the state of the economy we could have a larger recession. Or if all is good it'll be the next area for support. Just take caution when it gets there.
Good luck!
SPY/QQQ Plan Your Trade For 2-7-25: Where's The Deep-VShortly after I created the morning video, the markets opened with a BANG.
First rallying, then rolling over - just as I predicted.
Granted, I never expected the markets to rally above 606 before rolling downward, but the breakdown move into a potential Deep-V looks to be playing out very nicely right now.
Come Monday (2-10), and possibly carrying into the 13th, we could see a very sharp deep-V type price move that pushes the SPY below 580 for a period of time.
That could be a very big move from the 606+ levels we saw this morning.
And you know I'll be saying, "Just as I predicted," for at least 3 to 5 days starting early next week if that happens.
Again, I put my research out to the public like this to either live or die by my work. Very few people are able to do this - or they flip/flop all the time (every 2-3 hours).
My research is different. I'm really trying to make a difference by telling traders what to expect now and in the future.
I know I'm starting to make a difference for many people because I'm getting emails and messages from individuals who use my research to identify great trade opportunities.
Are you going to be the next person to share your success story with me?
Remember, have a safe weekend and GET SOME come Monday morning.
#trading #research #investing #tradingalgos #tradingsignals #cycles #fibonacci #elliotwave #modelingsystems #stocks #bitcoin #btcusd #cryptos #spy #es #nq #gold

SPY/QQQ Plan Your Trade For 2-7-25: Carryover PatternAs many of you know, I'm still expecting a breakdown in the markets leading to my Deep-V pattern on the 9th and the secondary Major Bottom on the 10th.
Why haven't we started to move downward yet? I really don't know. I suspect the markets are being pushed higher by Market Makers trying to crush the shorts (premium).
Either way, we'll know how this is going to play out over the next 5+ days.
If I'm right, we'll see the SPY break downward towards 580-590 over the next 5+ days.
The QQQ should move down 510-515 throughout that same breakdown (possibly a bit lower).
I expect Gold and Silver to also move downward if this breakdown in the SPY/QQQ happens as I expect. Metals tend to move downward when the SPY/QQQ makes a sudden impulsive breakdown move.
Bitcoin also appears to be poised for a breakdown event.
It seems that all the indexes and symbols I follow in the morning video are already standing near the edge of a cliff, just waiting to jump off.
I urge traders to move into a protective mode (protecting open longs and hedging against any breakdown event) over the next 5-10+ days.
We'll eventually see another bounce/rally off some lows, but right now, everything looks ready to JUMP (off the cliff).
Get Some.
#trading #research #investing #tradingalgos #tradingsignals #cycles #fibonacci #elliotwave #modelingsystems #stocks #bitcoin #btcusd #cryptos #spy #es #nq #gold

SPX500 H4 | Approaching all-time highSPX500 is rising towards a swing-high resistance and could potentially reverse off this level to drop lower.
Sell entry is at 6,128.66 which is a swing-high resistance that aligns close to the all-time high.
Stop loss is at 6,195.00 which is a level that sits above the 127.2% Fibonacci extension level.
Take profit is at 6,011.02 which is a swing-low support.
High Risk Investment Warning
Trading Forex/CFDs on margin carries a high level of risk and may not be suitable for all investors. Leverage can work against you.
Stratos Markets Limited (www.fxcm.com):
CFDs are complex instruments and come with a high risk of losing money rapidly due to leverage. 63% of retail investor accounts lose money when trading CFDs with this provider. You should consider whether you understand how CFDs work and whether you can afford to take the high risk of losing your money.
Stratos Europe Ltd (www.fxcm.com):
CFDs are complex instruments and come with a high risk of losing money rapidly due to leverage. 63% of retail investor accounts lose money when trading CFDs with this provider. You should consider whether you understand how CFDs work and whether you can afford to take the high risk of losing your money.
Stratos Trading Pty. Limited (www.fxcm.com):
Trading FX/CFDs carries significant risks. FXCM AU (AFSL 309763), please read the Financial Services Guide, Product Disclosure Statement, Target Market Determination and Terms of Business at www.fxcm.com
Stratos Global LLC (www.fxcm.com):
Losses can exceed deposits.
Please be advised that the information presented on TradingView is provided to FXCM (‘Company’, ‘we’) by a third-party provider (‘TFA Global Pte Ltd’). Please be reminded that you are solely responsible for the trading decisions on your account. There is a very high degree of risk involved in trading. Any information and/or content is intended entirely for research, educational and informational purposes only and does not constitute investment or consultation advice or investment strategy. The information is not tailored to the investment needs of any specific person and therefore does not involve a consideration of any of the investment objectives, financial situation or needs of any viewer that may receive it. Kindly also note that past performance is not a reliable indicator of future results. Actual results may differ materially from those anticipated in forward-looking or past performance statements. We assume no liability as to the accuracy or completeness of any of the information and/or content provided herein and the Company cannot be held responsible for any omission, mistake nor for any loss or damage including without limitation to any loss of profit which may arise from reliance on any information supplied by TFA Global Pte Ltd.
The speaker(s) is neither an employee, agent nor representative of FXCM and is therefore acting independently. The opinions given are their own, constitute general market commentary, and do not constitute the opinion or advice of FXCM or any form of personal or investment advice. FXCM neither endorses nor guarantees offerings of third-party speakers, nor is FXCM responsible for the content, veracity or opinions of third-party speakers, presenters or participants.

The Friday Forecast; Best Setups Frr Feb 7This market outlook will cover 15 markets:
ES \ S&P 500
NQ | NASDAQ 100
YM | Dow Jones 30
GC |Gold
SiI | Silver
PL | Platinum
HG | Copper
USD Index
EURUSD
GBPUSD
AUDUSD
NZDUSD
CAD, USDCAD
CHF, USDCHF
JPY, USDJPY
Non Farm Payroll news tomorrow! This is likely to inject a lot of volatility into the markets.
I recommend to wait until after the news is announced before executing on any trades. You never know where the market will go!
Enjoy!
May profits be upon you.
Leave any questions or comments in the comment section.
I appreciate any feedback from my viewers!
Like and/or subscribe if you want more accurate analysis.
Thank you so much!
Disclaimer:
I do not provide personal investment advice and I am not a qualified licensed investment advisor.
All information found here, including any ideas, opinions, views, predictions, forecasts, commentaries, suggestions, expressed or implied herein, are for informational, entertainment or educational purposes only and should not be construed as personal investment advice. While the information provided is believed to be accurate, it may include errors or inaccuracies.
I will not and cannot be held liable for any actions you take as a result of anything you read here.
Conduct your own due diligence, or consult a licensed financial advisor or broker before making any and all investment decisions. Any investments, trades, speculations, or decisions made on the basis of any information found on this channel, expressed or implied herein, are committed at your own risk, financial or otherwise.

Weakness in $TSLA when $QQQ and $SPY are strongAfter hitting an ATH NASDAQ:TSLA has lost the momentum. The NASDAQ:TSLA stock has lost the 50 Day SMA and the next stops are the 100-Day @ 330 $ and then the next stop is the 200-Day @ 280 $ . For all the Fib Retracement fans check out for the levels 0.786 @ 345 $ and 0.618 @ 293 $.
In contrast S&P 500 and NASADAQ100 are making new ATH and holding on to the gains. So, we might see NASDAQ:TSLA underperforming the NASDAQ:QQQ over the next few weeks. But long NASDAQ:TSLA when it reaches 200-Day SMA.

S&P500 - Short after BOS !!Hello traders!
‼️ This is my perspective on S&P500.
Technical analysis: Here we are in a bearish market structure from 4H timeframe perspective, so I look for a short. We have hidden divergence for sell on H4 and regular divergence on H1, so after BOS I will open a short.
Like, comment and subscribe to be in touch with my content!

SPX Nears All-Time Highs – Is a Breakout Imminent?The S&P 500 Index (SPX) has been following a strong upward trajectory, consistently forming higher highs (HH) and higher lows (HL), indicating a bullish trend.
However, the price is now approaching a rising trendline that has acted as a key resistance multiple times in the past.
