Analyzing Key Forex Patterns and IndicatorsAnalyzing the SPX500 chart reveals several key patterns and indicators critical for forex trading
1. Support and Resistance Levels:
Resistance Zone: The blue-shaded area around the 6,071 level is a significant resistance zone where the price has struggled to break through.
Support Level: The horizontal blue line at approximately 5,840 (labeled "SMS") represents a notable support level where buying interest has emerged in the past.
2. Swing High (SH):
The red horizontal line marked "SH" around the 6,077 level highlights a failed swing high, indicating a previous peak in price.
3. Price Movements:
There is a notable decline from the resistance zone around 6,020 to a low near 5,770, followed by a recovery towards the 6,000 level.
4. Volume:
The volume, indicated as "Vol 7.14K" at the top of the chart, provides insight into the trading activity during this period.
Potential Effectiveness of this Technical Signals:
Resistance Zone: If the price breaks above this level with strong volume, it could signal a bullish trend continuation. However, failure to break through may indicate a reversal or consolidation.
Support Level: Maintaining above this support level is crucial for a bullish outlook. A break below could signal a bearish trend and further downside potential which the break has occured.
Swing High (SH): The swing high at 6,020 serves as a reference point for potential resistance. Approaching this level again will be a key area for observing either a breakout or a reversal.
These technical signals are effective in predicting market movements as they reflect historical price action and trader behavior. However, they may fail due to unexpected news, economic events, or changes in market sentiment that can cause deviations from historical patterns.
In summary, the chart offers valuable insights into support and resistance levels, swing highs, and price movements, which are essential for making informed trading decisions in the forex market.
S&P 500 (SPX500)

US Stocks Surge as Trump Takes Office: Will the Rally Continue?The US stock market is buzzing with excitement as President-elect Donald Trump's inauguration on January 20 approaches. On Friday, January 17, the major indices saw significant gains, with:
● S&P 500 SP:SPX rose 59 points, or 1%
● Dow Jones Industrial Average TVC:DJI increased 335 points, or 0.8%
● Nasdaq composite NASDAQ:IXIC surged 292 points, or 1.5%
◉ Major Sector Driving Gains
The technology sector, particularly the "Magnificent Seven" stocks, has been instrumental in this upward momentum.
◉ Investor Sentiment
Investors are optimistic about Trump's policies, but concerned about potential inflationary pressures. Experts believe Trump's administration could lead to significant growth due to:
1. Increased Government Stimulus: Trump's background as a real estate developer may result in policies designed to stimulate economic growth.
2. Technological Innovation: Rapid advancements in technology are expected to create new industries and opportunities.
3. Lower Interest Rates: There is speculation that Trump may implement lower interest rates to further encourage economic expansion.
Overall, the market is cautiously optimistic, with investors closely monitoring Trump's policies.

#Nifty50 Market Update: A Week of Weakness and What Lies Ahead
This week, Nifty closed at 23,203, down by 228 points from the previous week's close. It touched a high of 23,391 and a low of 23,047, reflecting a volatile yet cautious market sentiment. The candlestick pattern for the week is indicative of weak market sentiment, signaling growing bearish pressure.
As highlighted last week, the market saw a bounce used by institutional players to offload their positions, leading to a sharp pullback. The Nifty was confined within the range of 23,950 to 22,900, as anticipated. Looking ahead, I expect Nifty to continue oscillating between 23,750 and 22,700 in the coming week.
From a monthly perspective, the market remains in a selling phase, and until either the monthly or weekly timeframes shift into the buying zone, or Nifty tests key support levels near 22,400/22,300, the bears will likely maintain control.
S&P500 Update: Recovery with Caution
Over in the US, the S&P 500 has bounced back from the lows of 5,773 and closed just below the critical Fibonacci resistance level of 6,013. If the index manages to stay above 6,013 next week, we could see it testing higher resistance levels around 6,100.
However, expect potential selling pressure to kick in on Monday, and if the index dips below 5,900, it could test key support levels at 5,821, 5,773, or even 5,700.
Bottom Line: Brace for Volatility Ahead
In conclusion, selling pressure is expected to persist in the markets for the time being. Traders should prepare for a bumpy ride as we navigate through these volatile conditions. Stay alert, manage risk, and keep an eye on critical support and resistance levels.

XLP vs SPY: Staples vs SPYConsumer staples vs SPY is at historical lows on the monthly chart. Last time it touched multi year low, then we saw a multi-year Bull market from 2000-2007. XLP had a fantastic bull run against the indexes like SPY and QQQs during the Great Financial Crisis (GFC) and reached ATH during 2009. Since then, the XLP has been bleeding against the S&P 500. It tried to reclaim the high in 2026 but suffered failed top. Since 2016 the ratio has been in a bear market and makes lower lows and lower highs. Recently it broke the multi-year low and is making lower lows. Weakness in Staples indicates a risk on trade in favor of the momentum indices like SPY and QQQ.

Blood on the Street Next Week, S&P Drop incomingI had expected to see the index start falling this past week, so it was surprising to see it rise in such aggressive bursts, even leaving gaps preceding the last three days' openings. This displayed great strength which, Im expecting, induced many investors to go long. This in my view is just as intended to trap them and close them out on a loss this upcoming week by breaking down sharply and filling out the gaps left behind.
As a confirmation of this I'm awaiting to see it move below Friday's low which should really tip the price pressure lower after initially catching some of Friday's longs and generating momentum on those liquidations.
Ideally, the price won't revisit the high at 6,055 but the ultimate invalidation point is at the all-time high.
Happy Trading :)

S&P 500 Daily Chart Analysis For Week of Jan 17, 2025Technical Analysis and Outlook:
During the recent trading session, the S&P 500 attained our designated downside target of Mean Support at 5775, which initiated a robust rally. This rally enabled the index to reach our target of Mean Resistance at 5920 and advance further to the newly identified Mean Resistance at 6035. The market is currently exhibiting strong and consistent upward movement. The bullish trend appears poised to continue towards our subsequent target, the Outer Index Rally at 6123, which will be approached via Key Resistance at 6090. Following that, additional targets of 6233 and 6418 are also anticipated. However, it is essential to acknowledge that reaching the initial rally level and the subsequent targets will result in a price pullback. Such a pullback is expected to prepare the market for the next phase of the bullish trend.

US500 sellhello friends
I hope you are well.
By forming this pattern, we can enter into a sales transaction with capital management.
If you want an analysis, send us a message.
*Trade safely with us*

Trump trade just beginning?US equities doing nothing wrong. Bonds finding support. We will wait until President is sworn in to see if breakout holds and if so likely back to test upper trend approx 620.

SPX: MTF Cluster Support at 5,810 with EMA Confirmation StrategyCurrent Technical Setup
The SP:SPX is testing a significant cluster support level at 5,810, identified by FibExtender Pro with multiple timeframe confluence. The price has shown a clear reaction at this level, making it a potential launching point for a bullish move.
Entry Conditions
Primary Triggers Required:
8 EMA crossing above 34 EMA on 30-minute chart (currently bearish)
Price breaking above last swing high at 5,850
Price holding above cluster support at 5,810
Price Targets
First target: 6,000 (psychological level and major cluster resistance - 4 levels)
Second target: 6,170 (cluster resistance - 3 levels)
Risk Management
Stop Loss Parameters:
Place stops below 5,810 cluster support
Exit if price fails to hold above EMAs after entry
Cancel setup if entry triggers aren't activated
Timeframe Analysis
30-Minute Chart:
Currently bearish configuration
8 EMA below 34 EMA
Waiting for bullish crossover and Price breaking above last swing high at 5,850
Weekly Chart:
Strong bullish structure
Moving averages stacked positively
5,810 cluster support adds confluence
50 EMA > 200 EMA (bullish)
Time-Based Considerations
The January 13 time cluster provides an additional layer of confluence for potential trend reversal. This timing aligns with Fibonacci principles suggesting higher probability setups when time and price zones converge.
Special Notes
The mixed signals between timeframes require patience. The weekly chart provides a strong bullish foundation, but entry must wait for 30-minute confirmation signals to align. The setup becomes invalid if price breaks below cluster support without triggering entry conditions.

SPY/QQQ Plan Your Trade For 1-17-25 : Gap Up Higher PatternToday's pattern is a Gap Up Higher in Counter Trend mode.
I believe this pattern would have resulted in a Gap Down Lower price trend related to the counter-trend setup. But it looks like the foreign markets drove the SPY/QQQ higher.
The obvious disruption to the SPY Cycle Patterns recently has come from the post-election concerns and the expectations of a broader credit/debt market crisis (which seems to be subsiding).
I believe we have to get past the Inauguration before we'll be able to see if the markets attempt to establish any defined price trend or continue to trade in a sideways price mode.
Gold and Silver are struggling to muscle higher - which I believe is the likely outcome for metals.
BTCUSD has moved back above $100k - but may struggle above the downward-sloping price channel.
Overall, at this point, I would suggest traders pull profits on any trades they have open as we move into the new Trump Administration and a slew of new EOs and new policies that may disrupt the markets.
We are very likely going to see some new price volatility over the next 30+ days.
Get some.
#trading #research #investing #tradingalgos #tradingsignals #cycles #fibonacci #elliotwave #modelingsystems #stocks #bitcoin #btcusd #cryptos #spy #es #nq #gold

US100 Trade LogMarket Context:
- The CPI session’s top wick aligns with a 4H FVG rejection , signaling a high-probability short setup. Oscillators confirm exhaustion, supporting bearish momentum.
Trade Parameters:
- Risk-to-Reward Ratio: 1:2 minimum .
- Base Risk: 1% account risk for initial positions.
- Additional Risk: Two half-contract size positions added, bringing total risk to between 1% and 2% to capture extended targets if price runs higher.
Missed Entry:
- Ideal short entry at the 0.5 level of the FVG , confluenced with the daily Kijun resistance. Hesitation led to a missed opportunity.
Retracement Importance:
- Small retracements, while frustrating, are necessary to sustain upside momentum. They provide clean re-entry points for continuation trades.
Conclusion:
- Strategic use of added risk positions and focusing on high-probability zones like FVGs and Kijun levels is crucial for optimizing profits.

2025-01-16 - priceactiontds - daily update - sp500Good Evening and I hope you are well.
comment: After hours selling was strong, especially on nasdaq. Sp500 is still well above 5950, which is my line in the sand for bulls. Below the odds for the bears increase big time. I still lean bullish for a retest of 6000 and I do think bears need stronger selling (spike + channel) to trap late bulls. Today was a trending trading range where all bars overlapped big time. The odds that we break below such a day after that rally are very low.
current market cycle: trading range (bear channel/wedge on the daily tf)
key levels: 5900 - 6030
bull case: Bulls want to chop around 6000 to find more acceptance and break above the big bear channel. Their next target is the prior high 6068. On the previous short squeeze we melted to 6068, pulled back hard for 60 points and then print a lower high. I still expect bulls to get a lower high closer to 6000, if not the breakout above.
Invalidation is below 5950.
bear case: Bears want to get below 5950 and then test the breakout price of 5918. The 50% retracement is also there at 5913. For now I don’t think today’s price action was that bearish but the after hours selling is weird to say the least. It’s a bad spot for both sides to trade at 5960ish.
Invalidation is above 6020.
short term: Bearish below 5950 and bullish only above 6020. Neutral in between. Again.
medium-long term - Update from 2024-12-22: Ultimately 5200-5300 in 2025. Again, rough guess as of now and since we have not seen a strong first bear leg, these targets are the lowest I am willing to give an honest outlook about. If bears surprise and we see a huge leg down to 5500, we will go much lower for the second and third leg.
current swing trade: None
trade of the day: Shorting 6000 was decent many many times.

STAY AWAY FROM SPX 16 jan 2025Charts have been already showing that it needs to go down but now even indicators are showing downside.
Don't be a bull right right now. It is showing short trade now but I wont short

Daily Market Watchlist Analysis by Skeptic📊 Navigating the forex and crypto markets requires sharp analysis and timely decisions. Today, I'll break down my forex daily watchlist , analyzing key indices and commodities to uncover potential trading opportunities. Let's dive in, starting with the U.S. Dollar Index (DXY).
💲 DXY Analysis
Timeframe: Daily & 4H
Daily Chart: DXY has shown a strong bullish trend, recently rejecting the 110 resistance level and pulling back to a key support zone. There's potential for a bullish rebound towards 110, or even a breakout for further upside continuation.
Fundamental Insight : Current fundamental data shows balanced supply and demand, causing market indecision.
4H Chart: Five consecutive neutral candles suggest indecisiveness. It's wise to reduce risk exposure, limit the number of trades, and tighten stop-losses until a clearer direction emerges.
Trading Plan:
Bullish Scenario: If DXY breaks above 110 with momentum, look for USD long positions across pairs.
Neutral/Bearish Scenario: Stay cautious; avoid heavy exposure until the short-term trend clarifies.
🥇 Gold (XAUUSD) Analysis
Timeframe: Daily & 4H
Daily Chart: Gold is correcting after its primary weekly bullish trend. Following a three-wave correction, it has resumed an uptrend within a rising channel, now facing significant resistance at 2718. A breakout could signal early entry for a move towards the 2789 high.
4H Chart: The ascending channel is more visible here. A potential pullback to the 2693 support zone could offer a solid buying opportunity.
Trading Plan:
Set a Buy Stop near 2718 with a safe stop-loss below the previous low or 2693.
📈 S&P 500 Index (SPX500) Analysis
Timeframe: 4H
After a bullish impulse reaching 5980, SPX500 is undergoing a healthy correction, signaling strength in the upward move.
Watching for the RSI to revisit the 70 level and a resistance breakout for confirmation.
For aggressive traders, the 5928 support zone offers a potential buy opportunity.
Trading Plan:
Conservative: Wait for RSI to confirm momentum and a breakout above resistance.
Aggressive: Enter near 5928 with a tight stop-loss below the support level.
🚀Markets are showing signs of consolidation and indecision, making risk management crucial. Focus on high-probability setups and wait for clear confirmations before committing to trades.
Which market are you focusing on today? Share your thoughts in the comments!
✍️I'm Skeptic , here to simplify trading and help you achieve mastery step by step. Let's keep growing together!

SPY/QQQ Plan Your Trade For 1-16 : Momentum Rally PatternToday's pattern suggests the markets will continue a rally phase - trending on the momentum from yesterday. It is likely the SPY/QQQ will attempt to rally and break away from the downward-sloping price channel I show on my charts.
Remember, my broader cycle pattern research suggests the SPY/QQQ will attempt to rally into Jan 20-23, then peak and roll downward/sideways into a Feb 9-10 V-Bottom pattern.
As I highlight in this video, the markets appear to be moving into a consolidation phase within the current downward-sloping price channel. I'm watching to see if the new Trump administration brings a BUMP (like last time) that breaks the US markets away from this consolidation trend.
Remember, the data on the US economy and earnings continues to be strong. A Trump-Bump will likely happen again, pushing the US markets into even greater dominance as the 900-lb Gorilla compared to other global economies.
However, until global central banks can move their economies to become more independent of US economic demand and imports, the process of working through the excesses of the COVID/Spending-spree administration (Biden) will continue as long as wealth in the US goes unchallenged (by some crisis or economic event).
So, again, expect the 900lb Gorilla to continue to dominate while there is no major crisis event in the future.
Gold and Silver should rally today on a RALLY pattern as well.
I believe BTCUSD is struggling to find support and may move downward over the next 10+ days.
We'll see what happens.
Get some.
#trading #research #investing #tradingalgos #tradingsignals #cycles #fibonacci #elliotwave #modelingsystems #stocks #bitcoin #btcusd #cryptos #spy #es #nq #gold

December 2025 is Hurst's 9 Years Cycle!Margin of Error "Adjusted" on the chart:
9 Years, 4.5 Years and 18 Months !
1: September 2025 is our early trough
2: 2027 is our late trough
3: Or we are having one right now !

Is TSLA's Momentum Back?
Tesla TSLA stock had been showing strengths signals recently within the recent downward correction.
The bulls would be back in control after confirming the breakout of $407/$408 resistance.
The prices would target $428/$457 resistance levels next.

Nike by April 2025 we should have break out or breakdown !101 Trend lines analysis. By April we should could/might reach the Red line in which we will have a break out to a new ATH in the next years or so or a break down to the 40ish/50ish region.!

Nike is reaching trough lands soon ! Or not & W crash more !61% Retracement from all time low "IPO" to "ATH" is in the 60ish region. MKTS permitting & unless we are about to crash just like 1929 as some Elliottsions suggest then we are about to have a trough in Q1/Q2 of 2025 .!

S&P 500 Index Rises to Psychological LevelS&P 500 Index Rises to Psychological Level
The US stock market experienced an upswing following the release of inflation data yesterday. According to ForexFactory:
→ The annual Consumer Price Index (CPI) matched expectations at 2.9%.
→ The monthly Core CPI came in at 0.2%, below analysts' forecast of 0.3%.
Market participants interpreted this as a positive signal, leading to the S&P 500 index (US SPX 500 mini on FXOpen) gaining over 1% in the first 30 minutes after the data release.
As reported by Reuters:
→ Concerns about inflation eased, reviving hopes for a potential Federal Reserve rate cut, buoyed by a strong start to the earnings season (which we will cover in more detail later);
→ However, the rally may be short-lived, as inflation in the US remains uncomfortably high and could increase further due to aggressive tariff and tax policies under the new Trump administration;
→ Analysts caution that the Federal Reserve's rate is likely to remain unchanged for some time.
Technical analysis of the S&P 500 index chart (US SPX 500 mini on FXOpen) shows that since early August—when the Japanese stock market crash triggered concerns of a global recession, dragging US equities lower—the price has been in an upward trend, marked by a blue channel. The January mid-month low has provided a more precise point to define the lower boundary of this channel.
From this perspective, traders should note that the current S&P 500 price has reached a resistance zone, which consists of:
→ The median line of the blue channel;
→ The psychological level of 6,000 points;
→ The upper red line, drawn through the local highs of December 2024 and January 2025, suggesting that the decline beginning on 18th December could be viewed as an intermediate correction within the blue ascending channel.
This resistance area may serve as a key test of the bulls' determination to complete the correction and resume the upward trend.
This article represents the opinion of the Companies operating under the FXOpen brand only. It is not to be construed as an offer, solicitation, or recommendation with respect to products and services provided by the Companies operating under the FXOpen brand, nor is it to be considered financial advice.

2025-01-15 - priceactiontds - daily update - sp500Good Evening and I hope you are well.
tl;dr
sp500 e-mini futures - Neutral around 6000. Market is close to the daily 20ema, bear trend line and big round number 6000. I won’t even think about longing this but it’s obviously wrong to short too early. As long as bulls keep it above 5950, they are good and in full control of the market. Targets above are 6030 and then 5050. If bulls break above the bear trend line, there aren’t many reasons why we could not just melt to 6100+.
comment: Huge bull day but right at multiple prior resistances. Bad buy no matter how you put it. I would actually not be surprised if we trade below 5950 or lower tomorrow. We have been going wildly up and down in this bear wedge/channel and that pattern is valid until clearly broken.
current market cycle: trading range (bear channel/wedge on the daily tf)
key levels: 5900 - 6030
bull case: Bulls got the big move from the CPI news and they want to test the bear trend line and break above it. It’s just not a good buy and hoping for a breakout. I won’t make stuff up here. If bulls break above 6020, next target is 6068 and then 6100.
Invalidation is below 5795.
bear case: Bears need anything to stop the rally. They have good arguments with the daily ema, bear trend line and big round number 6000. They came around the prior weeks and until that bear trend line is broken, I expect them to keep this a lower high as well. It would be pretty funny if we completely reverse today before we go into the weekend.
Invalidation is above 6030.
short term: Bearish below 5950 and bullish only above 6020. Neutral in between.
medium-long term - Update from 2024-12-22: Ultimately 5200-5300 in 2025. Again, rough guess as of now and since we have not seen a strong first bear leg, these targets are the lowest I am willing to give an honest outlook about. If bears surprise and we see a huge leg down to 5500, we will go much lower for the second and third leg.
current swing trade: None
trade of the day: Buying the double bottom on the 15m chart around 5956 was good.

SPY/QQQ Plan Your Trade 1-15 Followup: Rally Into Jan 20-23This video was started to highlight the incredible predictive capabilities of my SPY Cycle Patterns and longer-term Cycle Research.
It seems almost impossible to be able to somewhat accurately predict future price moves - but I'm able to do it with moderate success - sometimes months and years into the future.
What does that mean to you - well, it should mean you want to pay attention to my research/videos and learn how to take advantage of my continued research.
This video highlights why the Doom-sayers are wrong. The markets will continue to trend upward until the 2030-2033 peak. That's when traders need to be prepared for a broad market downtrend.
But, it sure is fun getting emails and announcements from all the people that are now calling for a "great reset" to take place.
It may happen in certain countries, but this is a market of economies - not a single economic market. What happens in some countries does not always happen to all countries.
As the old saying goes - this is a market of stocks, not a stock market.
Get ready - the next 5+ years should be full of incredible opportunities for skilled traders.
Get some.
#trading #research #investing #tradingalgos #tradingsignals #cycles #fibonacci #elliotwave #modelingsystems #stocks #bitcoin #btcusd #cryptos #spy #es #nq #gold

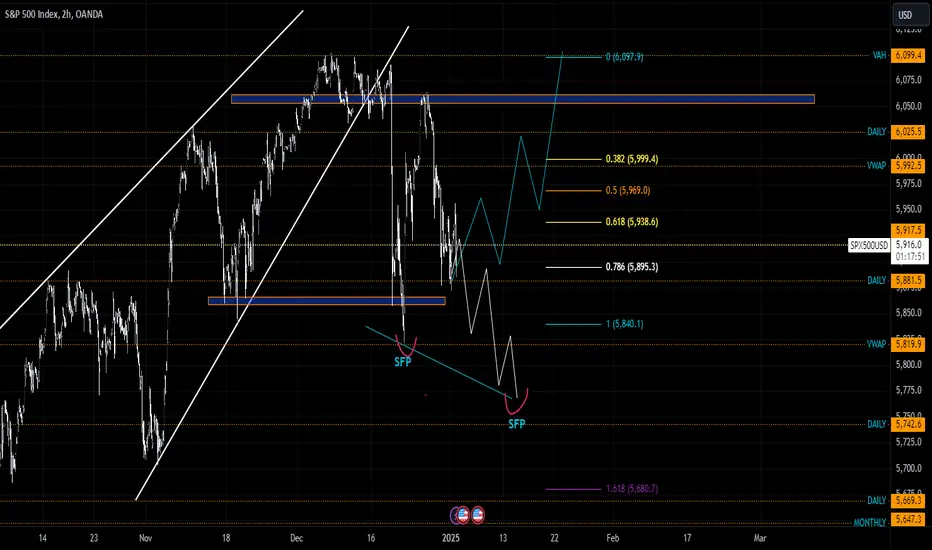
S&P Scenario 2.1.2025In this market, in order to consider some long setups, we need to hold the 6060 level or something around it, and since we didn't hold this support, we had a way to go short after the breakout. Now I see a scenario like this: the market should come for the sfp below the low as shown, or it will start to rise directly into the long, but as long as we are below the 6060 level, I'm considering a long setup. I would take that if the sfp below the low was met.