SPY/QQQ Plan Your Trade For 6-23 : Afternoon UpdateWhat happened to the CRUSH pattern?
Everyone wants to know why the CRUSH pattern didn't show up today. Well, I keep telling all of you these SPY Cycle Patterns are based on GANN, Tesla and Fibonacci price structures. They do not take into consideration news, global events, or anything outside of PRICE.
They are predictive - meaning they attempt to predict potential price shapes/patterns weeks, months, and years in advance.
The markets, obviously, are seeking some normalcy after the Iran conflict. I thought the CRUSH pattern would have been a perfect fit for today - but obviously the markets didn't agree.
If you have been following my videos, you know I keep saying the US stock market is acting as a global hedge for risks. Traders are pouring capital into the US stock market as a way to avoid global risk factors.
Traders are also pouring capital into Gold/Silver. Demand for physical metals is through the roof right now.
Time will tell if my Excess Phase Peak pattern plays out as I expect or if we rally to new ATHs.
Obviously, this sideways rollover topping pattern could present a breakaway in either direction.
Again, my patterns are not correlated based on news or other events. They are strictly price-based.
Get some...
#trading #research #investing #tradingalgos #tradingsignals #cycles #fibonacci #elliotwave #modelingsystems #stocks #bitcoin #btcusd #cryptos #spy #gold #nq #investing #trading #spytrading #spymarket #tradingmarket #stockmarket #silver
S&P 500 (SPX500)

SPY/QQQ Plan Your Trade For 6-23 : CRUSH PatternToday's CRUSH pattern suggests the markets will struggle to find any support for a rally. A CRUSH pattern is usually a large breakdown type of price bar that moves aggressively against the dominant trend.
Som, today I'm expecting some fairly large price action and I believe the markets may start a breakdown move this week as we continue to get more news related to the Israel/Iran/US conflict.
This week will be a "resettling" week in my opinion. Buyers will start to actively liquidate and reposition assets as we move deeper into this conflict. When buyers turn into sellers (to get out), the markets usually react very aggressively in trend.
Metals continue to hold up without making any big moves. I believe the increased FEAR level could play out as a moderate rally for metals over the next 15-30+ days.
BTCUSD broke down very hard (more than 6%) over the past 3-4+ days. This is a big move downward for Bitcoin and could suggest US technology stocks/sectors could also collapse on fear of a "rollover top" in the US stock market.
Smart traders will hedge and pull capital away from this potential top - just like I've been suggesting for the past 2-3+ weeks.
Oddly enough, if we do get a rollover/top this week because of the Iran conflict, it plays right into my Excess Phase Peak pattern and the predictions I've been making over the past 4+ months.
No, I don't foresee events like this Israel/US/Iran conflict. I can't see into the future.
What I can do, and continue to try to deliver, is the best analysis I can offer without becoming BIASED by indicators, comments, or other inputs.
I just read the chart and will tell you what I see as the most likely outcome.
Get some..
#trading #research #investing #tradingalgos #tradingsignals #cycles #fibonacci #elliotwave #modelingsystems #stocks #bitcoin #btcusd #cryptos #spy #gold #nq #investing #trading #spytrading #spymarket #tradingmarket #stockmarket #silver

S&P500 calm reaction to geopolitical riskGeopolitics:
The US launched airstrikes on Iran, raising global tensions. Iran has vowed to retaliate, and Israel isn’t backing down. Trump warned of more action if Iran doesn’t make peace. The US issued a global travel alert, airlines are avoiding the Gulf, and Japanese banks may pull staff from the region. Oil is in focus, especially with tankers avoiding the Strait of Hormuz.
Markets:
Reactions were calm overall. The US dollar gained, oil prices rose briefly, and stock futures were mixed as investors waited to see what Iran does next.
Corporate News:
BNY Mellon is reportedly in talks to merge with Northern Trust, which could lead to a major deal in the banking sector.
Tesla launched its first robotaxi service in part of Austin, aiming to spark new growth after a sales slump.
Key Support and Resistance Levels
Resistance Level 1: 6018
Resistance Level 2: 6043
Resistance Level 3: 6070
Support Level 1: 5910
Support Level 2: 5870
Support Level 3: 5845
This communication is for informational purposes only and should not be viewed as any form of recommendation as to a particular course of action or as investment advice. It is not intended as an offer or solicitation for the purchase or sale of any financial instrument or as an official confirmation of any transaction. Opinions, estimates and assumptions expressed herein are made as of the date of this communication and are subject to change without notice. This communication has been prepared based upon information, including market prices, data and other information, believed to be reliable; however, Trade Nation does not warrant its completeness or accuracy. All market prices and market data contained in or attached to this communication are indicative and subject to change without notice.

A Trend on Borrowed Time, A Micro ED within a Larger ED?Since mid-last month, the broader equity market has been grinding higher — but not with confidence.
The advance has been marked by choppy, overlapping price action that feels more hesitant than bullish. Yes, prices continue carving out higher highs and higher lows, but MACD momentum tells a different story. With every push upward, the MACD weakens, flashing warning signs beneath the surface. Taken through the lens of Elliott Wave theory, this unfolding pattern carries all the classic fingerprints of an Ending Diagonal — a structure that often signals a trend on borrowed time.
Key Characteristics of an Ending Diagonal:
1. Position in the Wave Structure:
A. Occurs in Wave 5 of an impulse wave or Wave C of a corrective pattern (such as a zigzag or flat).
B. Rarely, but sometimes, seen in Wave 3 of an impulse, but this is generally associated with a leading diagonal, not an ending one.
2. Structure:
A. Composed of five sub-waves, labeled (i), (ii), (iii), (iv), (v).
B. Each of these sub-waves subdivides into 3 waves (i.e., they are all corrective or "3-wave" structures, often labeled as a-b-c).
C. This gives the whole pattern a distinct 3-3-3-3-3 internal structure.
3. Price Behavior:
A. Overlapping waves: Wave 4 often overlaps with the price territory of Wave 1, which is normally a rule violation for standard impulsive structures — but it's allowed in an ending diagonal.
B. Converging trendlines: The upper and lower boundaries of the diagonal typically form converging lines (like a wedge), though they can also be parallel in some cases.
C. Diminishing momentum: Often accompanied by momentum divergence, meaning price makes a new high or low, but momentum indicators (MACD, RSI) do not confirm.
4. Implication:
A. An ending diagonal suggests the current trend is running out of steam.
B. Once complete, a sharp reversal or significant correction is expected.
In my analytical view, the byproduct of an Ending Diagonal often lures market participants into a conflicted state — cautious, yet unable to ignore the persistent upward grind. You’ve probably heard the old market adage: “Don’t fight the tape.” In this case, that mentality sets in as traders, wary but worn down, finally throw in the towel and join the advance — only for the market to seemingly punish that decision with a sharp reversal.
Many experienced traders describe their Ending Diagonal experience the same way: “The moment I finally stopped fighting the trend and got long, it was as if the market was waiting for me — and reversed hard.”
That is how I would describe this micro ED we appear to be in the final stages of what I’m counting as the micro wave v of (v) of Minor A.
For now, no key structural support levels within the Micro Ending Diagonal have been breached, so the advance can certainly stretch a little higher. But make no mistake — in my opinion, this remains one of the most dangerous, deceptive patterns to engage with.
Last week, I closed my short out-of-the-money ES call positions during the micro wave iv pullback (not shown on the above chart). Ideally, I’m looking for an opportunity to reestablish a similar position this week. From there I will reassess the larger Ending Diagonal pattern you see outlined on the chart above.

Us500:What is going to happen?hello friends👋
This time we are here with the analysis of us500, an important and vital index in the market that is being talked about a lot these days.
Well, let's go to the analysis, you will see that with the drop we had, a lower floor was made and the price was quickly supported and pumped by buyers.
Now it is clear that an ascending pattern has been formed, which is a very strong support in the specified area and a good buying point that you can enter into a transaction with capital and risk management.
Note that if the floor is broken and the stop loss is placed, our bullish pattern becomes invalid and we have to wait for lower floors.
🔥Follow us for more signals🔥
*Trade safely with us*

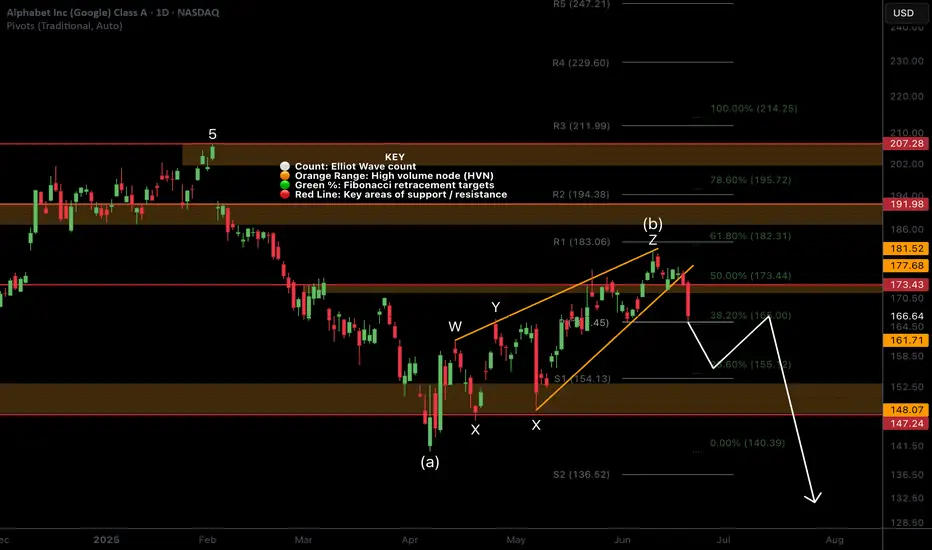
Google MUST hold this critical level!NASDAQ:GOOG local analysis update
📈 𝙇𝙤𝙣𝙜 𝙩𝙚𝙧𝙢 Further decline below the daily 200EMA, High Volume Node (HVN) and pivot point which it closed below on Friday could see google price fall back below $140.
📉 𝙎𝙝𝙤𝙧𝙩 𝙩𝙚𝙧𝙢 the bullish run has ended with Fridays bearish engulfing, first support below the support it is currently sat at is $156.
Irans conflict has investors shaken and not willing to hold assets over the weekend on the fear of worse news. However, if the conflict is resolved investors could have a great buying opportunity.
𝙏𝙚𝙘𝙝𝙣𝙞𝙘𝙖𝙡 𝘼𝙣𝙖𝙡𝙮𝙨𝙞𝙨
Price is challenging a triple shield: major support HVN, daily pivot and the daily 200EMA. Holding this level is critical and locks in a corrective Elliot Wave pattern from the $140 level completing between the 0.5-0.618 Fib retracement.
Daily DEMA Is about to produce a death cross while RSI is neutral with plenty of room to fall.
Safe trading
S&P 500 Daily Chart Analysis For Week of June 20, 2025Technical Analysis and Outlook:
The S&P 500 Index has primarily exhibited downward trends during this week’s abbreviated trading session, narrowly failing to reach the targeted Mean Support level of 5940, as outlined in the previous Daily Chart Analysis. Currently, the index exhibits a bearish trend, suggesting a potential direction toward the Mean Support level of 5940, with an additional critical support level identified at 5888.
Contrariwise, there exists a substantial likelihood that following the accomplishment of hitting the Mean Support of 5940, the index may experience recovery and ascend toward the Mean Resistance level of 6046. This upward movement could facilitate a resilient rally, ultimately topping in the completion of the Outer Index Rally at 6073, thereby enabling the index to address the Key Resistance level situated at 6150.

Low frequency trading (LFT) vs HFTHey fellow tarders and financial mojol,
I've got some insider info that's going to blow your minds! 🤯
According to my top-secret sources (aka my pet parrot who squawks numbers at me), low-frequency trading algorithms have finally figured out the true fair price of the S&P 500. Drumroll, please... It's $550! That's right, folks, all those high-frequency trading bots are currently aiming for this magical number as we speak.
But wait, there's more! The next step in this thrilling financial adventure involves radiowaving all the way down to $400. Yes, you heard it here first. We're talking about some serious next-level trading strategies that involve actual radio waves. Who needs fiber optics when you've got good old-fashioned radio, right?
So, buckle up and get ready for the ride of your life. The market's about to take a trip back to the good old days when $550 was the dream and $400 was just a stone's throw away.
Happy trading, and remember, if your broker gives you weird looks, just tell them you're tuning into the market's frequency! 📡💸

[06/16] Weekly GEX Roadmap - Diagonal Spreads or Put Hedges?📊 Weekly GEX Map (SPX)
This week’s GEX profile looks nearly identical to last week:
Positive bias above 6020 up to 6100
But a sticky chop zone remains from 5975 to 6020
Below 5950? That’s where things get interesting…
⚠️ What Happens If 5950 Fails?
In that case - welcome to negative gamma territory:
Delta becomes unstable → fast, erratic moves
Gamma loses influence → hedging effectiveness drops
Dealer hedging lags → market makers chase, not lead
Vega + theta distort readings → charm decay accelerates
Result:
GEX zones lose clarity.
Pinning breaks down.
Reactions become nonlinear and emotional.
If we drop below 5950, we might see acceleration instead of stabilization — despite the positive GEX profile.
💡 Trade Idea of the Week – With Caution
If not for Wednesday's macro risk (Fed rate decision), I'd suggest a bullish diagonal spread toward 6100–6150:
Limited downside
Defined risk
Covers the full squeeze zone
But with FOMC looming, I'd only hold this trade until Thursday and close once the debit doubles or earlier.
🧨 Macro + Geo Risks
Fed is priced for “no move” → any surprise = volatility spike
Rising tensions with Iran → oil and futures could react violently
Recommendation : Avoid OIL this week, especially futures and naked strategies
🛡️ Prefer Downside Protection?
If you expect weakness on SPX weekly:
Consider a put debit spread with the short leg at 5950, where the second strongest Put Support sits.
This type of structure can offer up to 6:1 reward-to-risk, making it one of the most efficient bearish hedges for this week.
If you enjoyed the above breakdown, feel free to check out my previous weekly analyses or explore my tools as well.
Until next time – Trade what you see, not what you hope,
– Greg @ TanukiTrade

SPY/QQQ Plan Your Trade For 6-20 : Pause Bar PatternToday's Pause Bar pattern suggests the SPY/QQQ will slide into a sideways type of PAUSE in price action today. I'm not expecting much to happen and if we do see any breakaway or breakdown trending it will likely be related to news.
While we have options expiration today and a host of other things that could drive the markets, I believe the markets are struggling to find direction right now. Thus, a pause in trading would be somewhat normal after a holiday-shortened trading week.
Gold and Silver are struggling after a brief rally last week. I believe this is fear related to the Israel/Iran conflict. Metals should continue to move higher.
BTCUSD is slightly higher (forgot to cover BTCUSD in the video), but not moving into a breakaway phase.
Overall, everything is very flat in early trading today. It may stay that way with my PAUSE BAR pattern.
Get some.
#trading #research #investing #tradingalgos #tradingsignals #cycles #fibonacci #elliotwave #modelingsystems #stocks #bitcoin #btcusd #cryptos #spy #gold #nq #investing #trading #spytrading #spymarket #tradingmarket #stockmarket #silver

S&P 500 H4 | Rising into a pullback resistanceThe S&P 500 (SPX500) is rising towards a pullback resistance and could potentially reverse off this level to drop lower.
Sell entry is at 5,982.20 which is a pullback resistance that aligns with the 50% Fibonacci retracement.
Stop loss is at 6,030.00 which is a level that sits above the 78.6% Fibonacci retracement and a swing-high resistance.
Take profit is at 5,869.32 which is a swing-low support that aligns closely with a 78.6% Fibonacci retracement.
High Risk Investment Warning
Trading Forex/CFDs on margin carries a high level of risk and may not be suitable for all investors. Leverage can work against you.
Stratos Markets Limited (tradu.com ):
CFDs are complex instruments and come with a high risk of losing money rapidly due to leverage. 63% of retail investor accounts lose money when trading CFDs with this provider. You should consider whether you understand how CFDs work and whether you can afford to take the high risk of losing your money.
Stratos Europe Ltd (tradu.com ):
CFDs are complex instruments and come with a high risk of losing money rapidly due to leverage. 63% of retail investor accounts lose money when trading CFDs with this provider. You should consider whether you understand how CFDs work and whether you can afford to take the high risk of losing your money.
Stratos Global LLC (tradu.com ):
Losses can exceed deposits.
Please be advised that the information presented on TradingView is provided to Tradu (‘Company’, ‘we’) by a third-party provider (‘TFA Global Pte Ltd’). Please be reminded that you are solely responsible for the trading decisions on your account. There is a very high degree of risk involved in trading. Any information and/or content is intended entirely for research, educational and informational purposes only and does not constitute investment or consultation advice or investment strategy. The information is not tailored to the investment needs of any specific person and therefore does not involve a consideration of any of the investment objectives, financial situation or needs of any viewer that may receive it. Kindly also note that past performance is not a reliable indicator of future results. Actual results may differ materially from those anticipated in forward-looking or past performance statements. We assume no liability as to the accuracy or completeness of any of the information and/or content provided herein and the Company cannot be held responsible for any omission, mistake nor for any loss or damage including without limitation to any loss of profit which may arise from reliance on any information supplied by TFA Global Pte Ltd.
The speaker(s) is neither an employee, agent nor representative of Tradu and is therefore acting independently. The opinions given are their own, constitute general market commentary, and do not constitute the opinion or advice of Tradu or any form of personal or investment advice. Tradu neither endorses nor guarantees offerings of third-party speakers, nor is Tradu responsible for the content, veracity or opinions of third-party speakers, presenters or participants.

SPY/QQQ Plan Your Trade For 6-19: GAP Reversal Counter TrendToday's pattern is a GAP Reversal in Counter Trend mode. I believe this could represent a breakdown in the ES/NQ as the US stock market is closed for the Juneteenth holiday.
Obviously, after the Fed comments yesterday (stating "uncertainty") and with the continued Israel/Iran conflict playing out, it makes sense to me that the US markets would move into a pre-weekend consolidation phase.
Even though the US stock market will be closed, the futures market will likely stay open and will carry some general market sentiment and reactions to news.
Watching Gold/Silver and Bitcoin should be very interesting today. I suspect the markets will continue to consolidate downward today - leading to a potential breakdown seeking support day on Friday.
Buckle up. We'll likely have 3-5+ days of news related to the Israel/Iran conflict and other issues over this weekend. It could be very interesting to see how the global markets move through this news.
Get some.
Happy Juneteenth
#trading #research #investing #tradingalgos #tradingsignals #cycles #fibonacci #elliotwave #modelingsystems #stocks #bitcoin #btcusd #cryptos #spy #gold #nq #investing #trading #spytrading #spymarket #tradingmarket #stockmarket #silver

SPY where are we going into OPEX and last week of June tradingYesterday was almost an indecision candle on daily. Markets cheered the jobs data earlier in day with a nice green candle, however the pump faded going into FOMC, where AMEX:SPY and SP:SPX were around 600/ 6000 at 2pm. FOMC event mostly turned out to be a "non-event". While the no rate cut and 2 for 2025 were largely expected, Powell spooked the markets commenting that he expects higher inflation in months ahead due to tariffs. Off course this set of a set of comments from Trump which was expected as well.
While markets are closed today (Juneteenth) futures are open, and in after hours and now we have drifted downwards... as of this writing SPX is around 5950. Bulls lost the 9 sma yesterday and now are trying to defend the 20 sma. Tomorrow is OPEX so expect some volatility and movement to where big money is positioned.
Certainly bulls can show up and reclaim 9 ma at 6003 or if we lose 5950, the next level down is below 5800. Meanwhile JPM collar is intact... Do we go down from here. Tomorrow will be key as we will know if we have lost 20 sma or regained 9 sma and how this week candle looks like.
Bulls can charge but is there enough gas in tank to make meaningful upside move? Maybe possible pump to open next week (around 6060 was recent high), but bears are now lurking to take us down towards that 5800 level next week.
As I said earlier tomorrow will be telling and I will update over the weekend.

SPY/QQQ Plan Your Trade For 6-18 : GAP Potential PatternToday's GAP Potential pattern suggests the SPY/QQQ may GAP a bit higher at the open, then move into a melt-up phase, trying to identify resistance, then roll into a topping pattern and move downward.
I believe the recent "rollover" of the markets (initiating last Friday with the Israel/Iran conflict) is still dominating the markets and news related to the ongoing conflict could drive a moderate pullback in US assets.
Headed into the Juneteenth holiday (Thursday, June 19), I suggest traders prepare for the US markets to move into somewhat of a SETTLEMENT mode today - where traders don't want to hold too many open positions into Friday's trading.
Additionally, Gold and Silver could move into a very strong upward price move over the next 4-5+ days. So be prepared for metals to hedge risks when the US stock market is closed.
BTCUSD seems to be struggling into the FLAG APEX. I'm waiting to see if my FLAG count is correct and if we get the breakdown in BTCUSD as I expect.
Get some.
#trading #research #investing #tradingalgos #tradingsignals #cycles #fibonacci #elliotwave #modelingsystems #stocks #bitcoin #btcusd #cryptos #spy #gold #nq #investing #trading #spytrading #spymarket #tradingmarket #stockmarket #silver

SPY/QQQ Plan Your Trade for 6-17: Top Resistance PatternToday's pattern suggests the SPY/QQQ will move into a type of topping pattern, attempting to identify resistance, then roll away from that resistance level and trend downward.
I suggest the news related to the conflict between Israel & Iran may continue to drive market trends with traders moving away from uncertainty near these recent highs.
Silver makes a big move higher. Gold will likely follow later this week or early next week.
BTCUSD moves into a sideways FLAGGING pattern - possibly attempting a BIG BREAKDOWN event over the next few weeks.
Overall, the markets look like they are poised for a very big move - just waiting for the GREEN LINK (GO).
Stay safe. Protect capital and HEDGE.
Get some.
#trading #research #investing #tradingalgos #tradingsignals #cycles #fibonacci #elliotwave #modelingsystems #stocks #bitcoin #btcusd #cryptos #spy #gold #nq #investing #trading #spytrading #spymarket #tradingmarket #stockmarket #silver

S&P500 INTRADAY sideways consolidation Geopolitics & Markets:
Donald Trump left the G-7 early, denying it was to negotiate peace between Israel and Iran. He floated sending JD Vance or Steven Witkoff for talks but denied direct outreach to Iran.
Tensions escalated as Israel bombarded Iran, which retaliated with missiles and drones. Trump briefly alarmed markets by calling for the evacuation of Tehran.
Oil prices rose and equity futures fell amid rising geopolitical risks. A tanker collision near the UAE added to oil market jitters.
Deutsche Bank warned oil could hit $120 if the Strait of Hormuz is disrupted.
Tech & AI:
Meta is working with Scale AI’s Alexander Wang to accelerate its AI strategy. The stock is near record highs after a strong rebound, boosted by investor optimism over Zuckerberg’s AI push.
SoftBank raised $4.8B by selling T-Mobile US shares to help fund AI ventures. It’s leading a massive $40B funding round for OpenAI, which just secured a U.S. defense contract.
U.S. Politics & Tax Policy:
Senate Republicans revised Trump’s tax plan, softening the controversial "revenge tax" to ease concerns about foreign investment. An Australian asset manager cited the tax in freezing U.S. investments.
Lawmakers left the SALT cap unchanged for now, keeping the $10,000 limit while further debate continues.
Key Support and Resistance Levels
Resistance Level 1: 6,058
Resistance Level 2: 6,138
Resistance Level 3: 6,200
Support Level 1: 5,953
Support Level 2: 5,913
Support Level 3: 5,845
This communication is for informational purposes only and should not be viewed as any form of recommendation as to a particular course of action or as investment advice. It is not intended as an offer or solicitation for the purchase or sale of any financial instrument or as an official confirmation of any transaction. Opinions, estimates and assumptions expressed herein are made as of the date of this communication and are subject to change without notice. This communication has been prepared based upon information, including market prices, data and other information, believed to be reliable; however, Trade Nation does not warrant its completeness or accuracy. All market prices and market data contained in or attached to this communication are indicative and subject to change without notice.

How Financial Markets Are Reacting to Middle East EscalationHow Financial Markets Are Reacting to the Escalation in the Middle East
The exchange of strikes between Iran and Israel continues. However, judging by the behaviour of various assets, market participants do not appear to expect further escalation:
→ Oil prices are falling. Monday’s candlestick on the XBR/USD chart closed significantly below the opening level.
→ Safe-haven assets are also retreating: the Swiss franc weakened during Monday’s U.S. session, while a bearish candle formed on the daily XAU/USD chart.
Equity markets, too, have largely held their ground.
The S&P 500 index (US SPX 500 mini on FXOpen) climbed on Monday (A→B) following reports of potential talks between Iran and the U.S. However, it pulled back (B→C) after the U.S. President urged citizens to evacuate Tehran.
Technical Analysis of the S&P 500 Chart
News of Israeli strikes on targets inside Iran led to a bearish breakout from the rising channel (marked with a red arrow), though the downward move failed to gain traction.
At present, the S&P 500 chart (US SPX 500 mini on FXOpen) shows the formation of an ascending triangle — a signal of temporary balance between supply and demand.
Still, given the elevated geopolitical uncertainty, this balance remains fragile. It could be disrupted by:
→ Further developments in the Iran–Israel conflict (notably, Donald Trump left the G7 summit early due to the situation in the Middle East);
→ U.S. retail sales data , due today at 15:30 GMT+3.
It is possible that the S&P 500 may soon attempt to break out of the triangle , potentially triggering a new directional trend.
This article represents the opinion of the Companies operating under the FXOpen brand only. It is not to be construed as an offer, solicitation, or recommendation with respect to products and services provided by the Companies operating under the FXOpen brand, nor is it to be considered financial advice.

S&P 500 H1 | Falling toward a swing-low supportThe S&P 500 (SPX500) is falling towards a swing-low support and could potentially bounce off this level to climb higher.
Buy entry is at 5,974.27 which is a swing-low support that aligns closely with the 78.6% Fibonacci retracement.
Stop loss is at 5,935.00 which is a level that lies underneath a swing-low support.
Take profit is at 6,056.80 which is a swing-high resistance.
High Risk Investment Warning
Trading Forex/CFDs on margin carries a high level of risk and may not be suitable for all investors. Leverage can work against you.
Stratos Markets Limited (tradu.com ):
CFDs are complex instruments and come with a high risk of losing money rapidly due to leverage. 63% of retail investor accounts lose money when trading CFDs with this provider. You should consider whether you understand how CFDs work and whether you can afford to take the high risk of losing your money.
Stratos Europe Ltd (tradu.com ):
CFDs are complex instruments and come with a high risk of losing money rapidly due to leverage. 63% of retail investor accounts lose money when trading CFDs with this provider. You should consider whether you understand how CFDs work and whether you can afford to take the high risk of losing your money.
Stratos Global LLC (tradu.com ):
Losses can exceed deposits.
Please be advised that the information presented on TradingView is provided to Tradu (‘Company’, ‘we’) by a third-party provider (‘TFA Global Pte Ltd’). Please be reminded that you are solely responsible for the trading decisions on your account. There is a very high degree of risk involved in trading. Any information and/or content is intended entirely for research, educational and informational purposes only and does not constitute investment or consultation advice or investment strategy. The information is not tailored to the investment needs of any specific person and therefore does not involve a consideration of any of the investment objectives, financial situation or needs of any viewer that may receive it. Kindly also note that past performance is not a reliable indicator of future results. Actual results may differ materially from those anticipated in forward-looking or past performance statements. We assume no liability as to the accuracy or completeness of any of the information and/or content provided herein and the Company cannot be held responsible for any omission, mistake nor for any loss or damage including without limitation to any loss of profit which may arise from reliance on any information supplied by TFA Global Pte Ltd.
The speaker(s) is neither an employee, agent nor representative of Tradu and is therefore acting independently. The opinions given are their own, constitute general market commentary, and do not constitute the opinion or advice of Tradu or any form of personal or investment advice. Tradu neither endorses nor guarantees offerings of third-party speakers, nor is Tradu responsible for the content, veracity or opinions of third-party speakers, presenters or participants.

SPY/QQQ Plan Your Trade For 6-16 : Up-Down-Up PatternToday's Up-Down-Up Pattern suggests the markets will transition into a moderate upward trending price bar - which is quite interesting in the world we have today.
War and a big weekend of events, protests and other new items could drive market trends over the next few days.
Still, the SPY Cycle Pattern for today is an Up-Down-Up - which suggests last Thursday was an Up bar, last Friday was a Down bar, and today should be an Up bar.
The Gold/Silver pattern is a POP pattern in Counter-trend.
I believe the US markets are benefiting as a safe-haven for capital as the global turmoil drives global investors to seek safety and security for their capital.
That means as long as the world continues to spin out of control, the US markets and the US-Dollar will act as a moderate safe-haven for capital.
Gold and Silver should also benefit from this global chaos.
Bitcoin is benefiting from the strength of the US markets (and the technology sector) as well.
Let's see how this week start to play out. I'm waiting for some more news.
Could be very interesting this week.
Get some.
#trading #research #investing #tradingalgos #tradingsignals #cycles #fibonacci #elliotwave #modelingsystems #stocks #bitcoin #btcusd #cryptos #spy #gold #nq #investing #trading #spytrading #spymarket #tradingmarket #stockmarket #silver

Market Recap & Outlook – Nifty and S&P 500, Bulls coming?The Indian stock market witnessed a volatile week, with the Nifty 50 closing at 24,718, down nearly 300 points from the previous week's close. The index hit a high of 25,222 and a low of 24,473, moving precisely within the range of 25,500–24,500 that I highlighted last week. I hope some of you took advantage of the cautionary signal!
Key Support Zone in Focus
The 24,400 level continues to act as a strong support—bulls have fiercely defended this zone for the past five weeks. However, if this level cracks, we could see Nifty test deeper supports at 23,900 and 23,700.
Geopolitical Overhang
The ongoing Iran-Israel tensions remain a wildcard. Unless the situation escalates significantly, I expect Nifty to trade in the 24,400–25,200 range this week.
Short-Term Strategy
I believe the current selling pressure might persist for 2–3 more sessions before the bulls regain control. Historically, Nifty tends to stay under pressure until mid-June, followed by a bullish phase leading into mid-July. If we get more dips, I’ll be looking to accumulate quality mid-cap and small-cap stocks for potential short-term gains.
S&P 500 Update
The S&P 500 closed at 5,976, down just 25 points from the previous week. The index made a high of 6,059 and a low of 5,963, forming a bearish candle on the weekly chart.
Watch These Levels
If 5,963 breaks, expect further downside towards 5,899 and 5,875. On the flip side, a sustained move above 6,030 could ignite bullish momentum, targeting resistance zones at 6,090 and 6,142.
Final Take – Bulls Gearing Up?
The broader trend still favors bulls, especially if key support levels hold. Watch for a turnaround by mid-week—"Bulls may soon reclaim the throne!"


S&P 500 Daily Chart Analysis For Week of June 13, 2025Technical Analysis and Outlook:
The S&P 500 Index has displayed both upward and downward movements throughout this week's trading session, narrowly missing the targeted Outer Index Rally level of 6073. Currently, the index is characterized by a bearish trend, warranting attention towards the Mean Support level of 5940, with additional critical support identified at 5888.
Conversely, there exists a significant potential that, upon reaching the Mean Support of 5940, the index may recover and rise to the Mean Resistance level of 6046. This upward movement could facilitate an interim rally, culminating in the completion of the Outer Index Rally at 6073 and enabling the index to address the Key Resistance level positioned at 6150.

SPY (S&P500) - Price Testing Support Trendline - Daily ChartSPY (S&P500 ETF) price has just closed below $600 and is currently under a support trendline.
If price cannot breakout above the $600 and $605 resistance level this month, a pullback could occur down to the support zone.
SPY price could potentially pullback to various levels of support due to:
-USA domestic conflict
-International military conflicts
-Technical chart bearish divergence
-USA federal reserve interest rate news
-Government and corporate news
Support Levels: $595, $590, $585, $580.
Resistance Levels: $600, $605, $610, $615.
The 50EMA/200EMA Golden Cross is still on-going, and support prices of $580 and $568 have yet to be tested significantly.
