Spx500analysis

SPX Long Term View 4300 becomes the main resistanceMy weekend update is a day early, I will update those who are on my list with a bit more details on shorter time frame view tomorrow.
We are in a bear market and those 5500 callers got destroyed all the way down calling every bottom from Jan.
This is my long term view and I think we have bottomed here today or super close to it!
I got targets for the potential bottom left, all SPX:
- 3643 (came super close to it today)
- 3688.50
- 3555
We clearly had 5 down or A completed on this move! Now the time for the B (still think this will be an ABC correction going into Mar of 2023)
My main target now is 4300, down from 4425. Extension target now is 4425-45 down from 4600
110MA (descending every day) becomes the main magnet for the move up to hit at least
I got 2 main targets to hit for the C, one in Oct/Nov of this year and next one is Mar of 2023.
Ideally we see the first target hit and then some sort of damage control move into the EOY close and finish up in to 2600 handle (2800 at min) in Q1 of 2023.
I was saying for a while now, that the whole move from 2020 will be erased this year, its getting supper close to it now!
That yellow dotted line is line in sand for the bears and bulls, break it above and test it from the top will make me change my view to the whole view and look higher.
Before it happens its the main line Im paying attention to now.
Have a nice day
P.S. next week should rally up and ideally we make a higher low end of the month before the window dressing rally

SPX UpdateDoes look like a gap up tomorrow to my eyes. I got some lotto calls for tomorrow/Fri
Support 3775SPX
Overnight support ES 3770-80 and 3745
Main resistance is 3885SPX and one more at 3855SPX
Im mostly bullish, will add if we get another weakness tomorrow am.
Might update the chart with more info later on

SPX rejected both 3710 and 3730SPX support, tomorrow will gap upSPX rejected both 3710 and 3730SPX support. Maj daily support was 3710.
Tomorrow should gap up. There is a chance we still see my 3696.50 tomorrow, but in idea we should gap up tomorrow and repeat the Mar Fed day.
Im out from 80% of my short, and keeping only core longs going into the FED day.
SPX gaps to close are:
- 3900
- 4017
Failure getting above 3957 after the FED will get us another washout to 3665-68SPX
Ideally we gap up tomorrow and make a higher low after the announcement. As the hike is already priced in imo

SPX - one more possible target - 3696.50One more calculated target for the potential low of this move is 3696.50
Im expecting a run up after the FED back to 3975 or so and make another low to 3665-68 or 3696.50, it might make a higher low, but the pathway is the same.
Then summer rally after the July 4th weekend

SPX500 Entries + Exits for FREE (Best Reverse Strat)The 1on1 video is currently out, if you would like it in order to understand how to play my analysis FULLY, please let me know privately.
All likes/comments and feedback are very much appreciated!
How to play my chart:
Buy at support, sell at resistance. When you open this chart you'll see a green entry and a red entry. When the candlestick hits the green entry, you place a buy. If however that support buy doesn't go into profit and goes negative -35 or -60 pips (depending if it was a fast break/or if the break landed on a minute 15 zone), if it breaks you would then exit your buy and immediately enter the sell. You would then ride that sell down to green TP1, or you could then repeat and play the buy/break there.
The same exact thing goes for resistance sell/break plays!

SPX is looking for the 5th down or completing the C wave downIm not an EWT expert but this looks to me like completing the 5th down or the C wave of the bigger A wave down!
THIS IS THE BEAR MARKET!!! 6th month and rolling now. All those 5500 coo-laid smokers were destroyed 6 months straight!
Typically the bear market is lasting 2 years, I expect the maj low in Q1 next year. Its 6th onth now, so this move down should follow by a very strong rally soon (Mar like)
The FED is on Wednesday and I will not be in short or be short on that day or maybe even since Tuesday!
We closed below 3909SPX on Friday, targets 3850 or lower (warning email was send to my email list people second part of Fri).
ES already below 3855
3855 is the maj resistance now with following 3885-4k zone.
I got several targets for this move down:
- 3805-09SPX maj support
- 3765-80SPX
Some other calculations are pointing for much lower levels!
- 3665SPX level and,
- 3555!!!
Something to be open mined to. Ideally we hold 3800 handle, below is very bed!
Notes from the chart
4170-90SPX is the main resistances now
Resistance - 3855; 3885-4kSPX (must hold for continuation lower)
- Low target for tomorrow 3805-09, 3780SPX - Buy if seen in am, dont buy if we see higher first
- 3818-20SPX mid support,
- 3805-09 and then 3765-80 zone is the maj support zone
Buy zone for tomorrow with stops!
- 3805-09SPX
- 3850 and 34 must hold on any try or it falls apart (main support, not expected to get hit any time soon)
Short
- no short on the FED day or even after Tuesday
- 3855SPX and 3885-4k, no short above 4025
- Low (intraday) was on the 12th (about to get renewed);
- Long from 3855-65SPX zone (email was sent when the price was at 3867-68SPX)
Larger ABC pathway down into Oct/Nov low or more of the year is in play imo Final target in 3000-3200SPX zone
Potential 5 waves down is forming! Next mid Jun low can be lower low! Have to be careful with sizing

SPX is on the way to 3885SPXWell we blow all of the supports I was looking to hold. I got also stopped on my NQ short at 12330Jun right before the move. ES was short but covered at 54.
Im seating on my hands and looking for 3885-89SPX to hit to go long.
We should bottom before the FED next week and rally hard to 4300 into July 4th, maybe even 4425SPX
4215SPX will the be the main target on that move up.
Supports on the SPX are 3929, 3908 and 3885-89SPX
Weekly support which must hold is 3853SPX, closing below will get us to low 3800 and ultimately to 3775SPX.
My view is that we will hold 3885SPX, but dont rule out a test 0f 3850.
Ideally we just blast from am lows and finish the move down on Monday/Tuesday.

SPX 2 pathwaysIm watching 2 numbers - 3980 and 3950SPX (there is 4008 as a smaller degree support, so far held AHs in futs)
We should hold the am low and rally um into Monday high.
2 pathways:
- either we get to test 4077 (after 4008 or 3980test in am) and decline lower into Monday to 3950
- or just blast up into the 13th high, can stretch to 4215SPX for a fake out move I'm looking for

SPX500 Long IdeaSimple game plan, considering price action is narrowing down:
Long Order:
✔️ Entry: 4090.00
⛔ Stop: 4050.00
🤑 Profit: 4203.90
Alternative scenario would be for the price to rest on the lower trendline, slowly trending up until it does a sudden drop down. In order for the above mentioned setup to be valid, I would like to see a bounce off that level, not consolidation.

SPX500 likely to FALL!HEy tradomaniacs,
looks like SPX500 is about to fall due to the last overshoot and breakout - retest scenario.
Yesterday we`ve seen news about the liquidity which hasnt been that low for a long time, means we can expect more big moves to the up and downside.
The market will wait for upcoming news before we get more volume and eventually less volatility.
Technically a good spot to sell.
What do you think?


SPX is set a last test lower before a rally upSo far so good from the other day update.
We should test 4090SPX at the open with ideal test of 4077 and 4062SPX and hold today.
Holding 4060-75SPX level will produce a good support for a move up to 4215-25SPX and ideally all the way to 4300.
After the next high this week or early next, will set us up for a move down to 3885SPX test!
Only after 3885SPX tested, we will have a nice multi week rally all the way to 4425-45SPX and possibly even 4600.
Dont get trapped!

🚀🚀 S&P500 - LongThis idea i posted in my channel on Friday, i Entered at 4098 and hit my TP2 at 4167. I believe we could find another entry around this region.
Here is my analysis for S&P 500
SP:SPX
I have marked out step by step how i have come to find a long position on S&P500 .
Price has broken the previous LH and created a new HH which has BOS.
There is a key level of support around the area 4098 & has now broken the counter trendline and respected the 78.6 level.
Happy Trading Traders.

SPX Gaps to fill - pink linesThose gaps will be filled, Im looking for all the 3 below to fill sooner then later

SPX short term is bearish, medium term is bullish!SPX is simple here, short 4165-80 Zone, buy low 3900 for the move up to 4300!
Im looking for a bottom early in a week, ideally by Tuesday and move up to at east 4215SPX and ideally to 4300 before a test of 3885-90SPX
On the other hand we could see 3885-90SPX next week or pre-Fed and move up to 4300+ into early July high
Buy zone for tomorrow with stops!
- 4060-65SPX
- 4055SPX light level of support
- 3927; 3908SPX
- 3885-90SPX is the main buy zone
- 3850 and 34 must hold on any try or it falls apart (main support, not expected to get hit any time soon)
Short
- 4175-70SPX and 4215-25, no short above 4225, next target is 4300

SPX ready for Y to 3219Im tracking SPX Elliott Waves and SPX is about to close a Flat ABC (yellow). Next targets are 3582, 3220, 3002 and even 2633 is possible. Also Fed should announce new Rates hikes... everything is sync to present new oopportunies lower.
Cycle Wave 4 top entry fibs are
in between
0.3 - 3573 and
0.5 2743

$SPX PVI Volatility RangesAnother week of writing successful Credit Spreads on $SPX...almost 49% NET Returns YTD

Shorts S&PDaily is a downtrend, and it has pulled back very deep. Although it has done that I still expect price to continue down overall. I think it is time for it to meet those lows again and make a new one

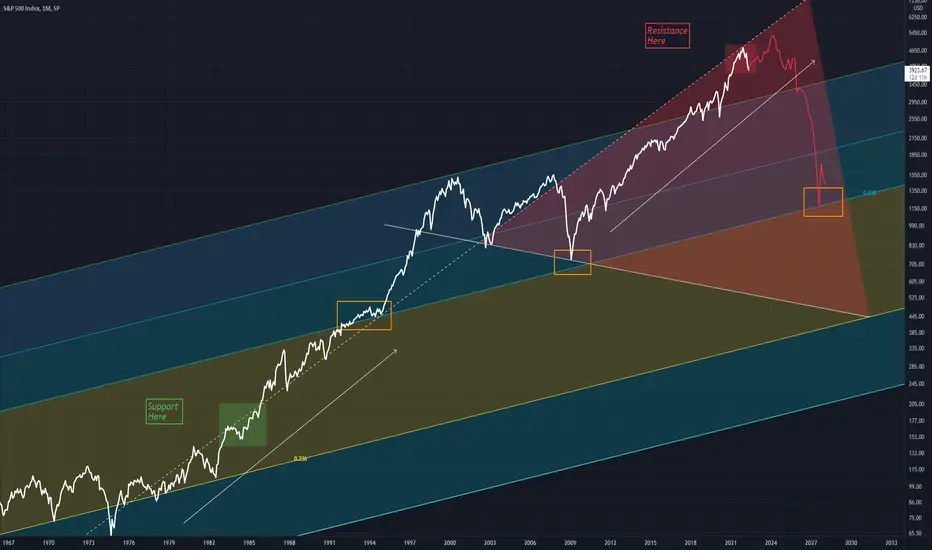
SPX Planned Formation Update 5/23/22Right now we are experiencing the early stages of a big breakdown on the SPX
I say this based on the formation provided, which has even been produced on a smaller scale for observation on the SPX chart
A break down like this will be disastrous, but not the end of the world
The formation provides bottom points along the dot come bubble, 08 crisis and what is yet to come.
The Aptiv chart shows also a great representation of this within the Fibonacci circle, with a big extension (similar to that on SPX) leading to big downfalls to complete the broadening wedge pattern
I have made charts of this in the past please check them out
Above is the smaller formation VS the larger formation we can see on the Monthly timeframe
Above is the original post

SPX Updated Thoughts 5/19/22I am continuing my bearish sentiment on SPX for now.
Most importantly on this chart is the dotted trendline that shows a support line converting into a resistance line where we are currently
I believe this will lead to bearish results and respect given to the solid downtrend line, finding support once hitting 0.618
Spx500 Short SognalGoing short Spx, looking like it will take out that “support”/double bottom. Overall daily bias bullish but a good setup in my opinion.
Goodluck everyone and always have good risk management!

Spx500 Short SignalGoing short Spx as overall price bearish and got a shift on the lower timeframe. Possibly the high of the day has just been made, goodluck today!
