2021 is like 73s2021 is like 73s. let's see how this play. if it went well, buy dips at bottom if you can.
1. The four most expensive words in investing are: 'This time it's different. '” So said Sir John Templeton, the legendary investor and mutual fund pioneer. The phrase contains tremendous wisdom, but only if you truly understand what it means. ... “This time it's different” has become a ubiquitous phrase...
2. we will see increasing inflation & Covid case worldwide rising this year. they printed many trillions for check stimulus also fourth stimulus check again? also seems coronavirus won't go anywhere. you can see that Covid cases is still rising on worldometers site. Imagine 1-10 million cases daily? it's not great for economy & stock market. seems vaccine is still processing but not completely at all.
3. some investors will say " dollar is in bubble but stock market won't go down" they say same thing in 73s. that's not how this works. dollar inflation makes stock market volatility & shock..
4. The Buffett Indicator at All-Time Highs Is This Cause for Concern?. it shows 223% radio of market value GDP, 79% higher than long term trend line not internet bubble.
seems too higher.
5. 2021. many poor & middle bought stocks & meme from check stimulus while rich people buying at same time. this doesn't age well. "BUY, BUY, BUY" poor getting rich, rich getting richer? nah.
that's not how this works. 2008 & 2020 was different because market was bottom but 2021 Is top not bottom. that's why. Illuminati stays. in 2030, we will see 0.1% top getting richer ever while poor & middle bottom.
my prediction could be wrong or right.
Thank you. Sorry For My Bad English. Enjoy.
Spx500forecast

SPX500 could continue to move up!Hey tradomaniacs,
after the previous breakout -> SPX500 could continue to move up.
I`ll be lookong for demand in market-depth here and try to find a good entry to go long!
SPX500 could MOVE UP!Hey tradomaniacs,
SPX500 could move up 👉
If thats the case we might see some US-DOLLAR-WEAKNESS today and more risk-on.
Good for our positions.🙏
Volatility is likely to continue in the market until the end of the quarter as we see a lot of re-balancing by institutions.
For example: Pension funds have an overweight in equities but are forced to have a certain ratio of different assets. (E.G. Bonds to Stocks).
Here some figures to show you how much capital different institutions have to distribute as announced:
1️⃣ Mutal -$107BN
2️⃣ Defined Pension -$110BN
3️⃣ Norges Bank -$65BN
4️⃣ GPIF -$34BN
At the same time market makers who are forced to Hedge their positions (volume about $31 BN).
LEAVE A LIKE AND A COMMENT - I appreciate every support! =)
Peace and good trades
Irasor
Wanna see more? Don`t forget to follow me

SPX500USD 2021 Mar 22 Week
OANDA:SPX500USD
SPX500USD 2021 Mar 22 Week
Weekly = Bullish | Daily = Bullish | H4
Last week's analysis, scenario 2 unfolded.
It appears high volume up bar Bar 1 has been negated by next bar's lower close.
Prefer to short on test of high, target 3844
Like and Follow if you find this useful : )
Have a good trading week ahead!


SPX500 Short SetupSPX500 Short Setup
🔵 Entry: $3,885.0
🟢 TP & RR: $3,787.4 (1.91)
⛔ Stop Loss: $3,936.1
Trade Reasons:
✔️ Price bounced off the upper trendline
✔️ Price still ranging within the triangle
✔️ Somewhat overbought levels

Head and Shoulders on SPX? SPX is drawing a Head and Shoulders pattern, it could be interesting if can cross the short-term uptrend.

SPX 50 Days MA, the line's relationship with price. (VERY OUD)The strangest thing you can notice (beside major correction, and pullback)
the more we have fake break down of the daily 50 MA the more steam we get
to the up side. VERY STRANGE RELATIONSHIP ???!!!

S&P 500 FractalHistory doesn't repeat but if often rhymes. Make as much money as possible between now and 2025, and get prepared for the dirty 30's.

S&P500 Short SetupS&P500 Short Setup
🔵 Entry: $3,934.7
🟢 TP & RR: $3,903.0 (1.46)
⛔ Stop Loss: $3,956.4
Trade Reasons:
✔️ 1.618 Fib Extension
✔️ Reached previous resistance level

SPX500 UPDATE with S/H/S-InverseHey tradomaniacs,
SPX500 is creating an S/H/S-Inverse-Pattern 👉
A break above the Neck-Zone could cause a clean bullish momentum as price is currently under a significant resistance-zone.
A trigger of stop-losses could attract more buyers to take action.
More risk-on-sentiment in the market would be awesome for our trades.
As you know, I can`t give you exact data for a trade as price varies from broker to broker❗️🙏
LEAVE A LIKE AND A COMMENT - I appreciate every support! =)
Peace and good trades
Irasor
Wanna see more? Don`t forget to follow me

SPX500 could MOVE UP soon!#UpdateHey tradomaniacs,
SPX500 aswell as other Indicies had a rough start into the day and we finally see some healthy retracements❗️
Looking at SPX500 you can see that price is re-testing a very interesting zone of a potential reversal 👉
Considering how weak the Forexmarket reacts to the global sell-off I really doubt that we are going to see a continuation of the current move, unless fundamentals by Powell will cause more uncertainy.
If SPX500 moves up from here we might see trend-continuations in the Forexmarket and strong pumps.
Let`s see what the Wallstreet is going to do.👌

S&P 500 Long PositionS&P 500 Long Position
🔵 Entry: $3,886.0
🟢 TP & RR: $3,929.1 (2.44)
⛔ Stop Loss: $3,868.3
REASONS FOR THE TRADE
✔️ Market Flow Green
✔️ Higher low on lower time frame
📝 I am expecting a small retracement upwards before price continues to go down. The second order I am looking to open is for a short at the $3,914.0 level.

SPX500 could move UP! Hey tradomaniacs,
Looking at SPX500 we can see a good rally after the expected fakeout#5 from yesterday 👉
As you can see we are currently re-testing the previous trendline of the entire weird and volatile correction.
If this level holds market could continue with its previous breakout and start a new rally!
If not.. SHORT IT ;-D
LEAVE A LIKE AND A COMMENT - I appreciate every support! =)
Peace and good trades
Irasor
Wanna see more? Don`t forget to follow me

PULLBACKS AND CORRECTIONS 2009 TO DATESWell, the chart speaks for it self. i Might have missed one or two :-).

S&P500 Long SetupSPX500 Long Setup
🔵 Entry: $3,911.9
🟢 TP & RR: $3,954.0 (2.48)
⛔ Stop Loss: $3,894.9
REASONS FOR THE TRADE
✔️ Market Flow Indicator went green
✔️ Trade in direction of the trend
📝 Not much to analyse here aside that it's a trade based on my system. With that being said the price may drop down to the support level, where I will be looking to open a long order again.

Shooting Star forming W chartHi everyone,
It is too early to confirm it but if this candle close like this next friday on the W chart in Shooting Star or Gravestone we will have something to worry about.
Best to you !

SPX500 BUY SETUP!Hey tradomaniacs,
As you know I can`t give any exact data as explained in the past but here is eventually a great chance to buy SPX500 👉
LEAVE A LIKE AND A COMMENT - I appreciate every support! =)
Peace and good trades
Irasor
Wanna see more? Don`t forget to follow me!

S&P500 Long SetupSPX500 Long Setup
🔵 Entry: $3,868.7
🟢 TP & RR: $3,3936.1 (3.05)
⛔ Stop Loss: $3,846.6
REASONS FOR THE TRADE
✔️ Resistance turned into Support
✔️ Market Flow Indicator Oversold
📝 Stop Loss is a bit close, so feel free to adjust it. If we break down from that level I will be looking to open a short order.

S&P 500 Short SetupS&P 500 Short Setup
Entry: $3,864.4
TP & RR: $3,750.7 (2.22)
Stop Loss: $3,915.7
REASONS FOR THE TRADE
Not much to discuss here, aside from the fact that we are looking to open a short position at an established resistance level. This is one of those trades that it's just too obvious, so I believe a lot of traders will be stacking orders there. When/If our position gets filled, we will be monitoring it and if volume continues to increase or we pierce that level convincingly, we may close the trade prematurely and potentially open a long trade.

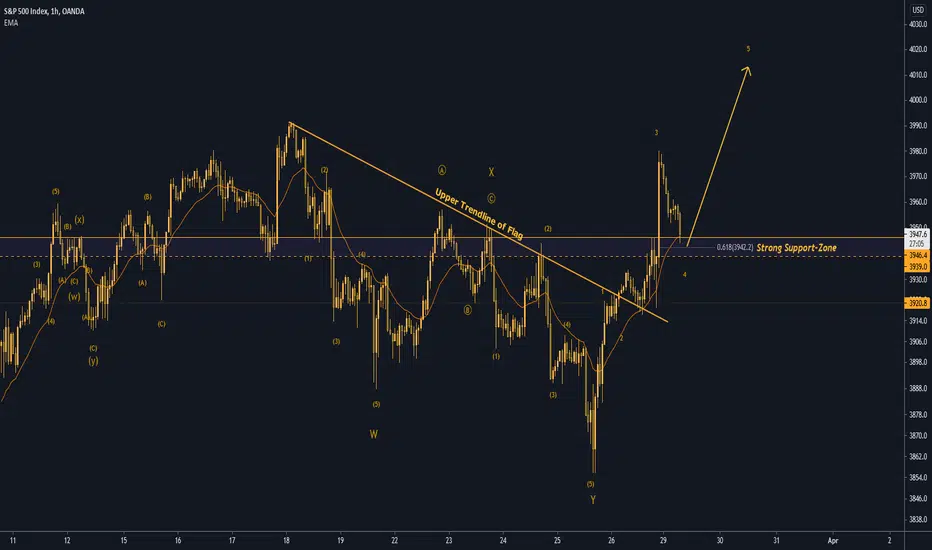
SPX500 could MOVE UP again!Hey tradomaniacs,
SPX500 is re-testing a significant resistance-zone👉
A move above price-zone 3750 - 3760 could cause more bullish momentum as the previous move would turn out to be a fake.
Trend-Fan and strong-support-zone were holding showing a strong demand with high volatility, which is often a sign of reversal.
Watchout for potential volatility as reddet-group wallstreebets continues to push SILVER and stocks like TAAT.
LEAVE A LIKE AND A COMMENT - I appreciate every support! =)
Peace and good trades
Irasor
Wanna see more? Don`t forget to follow me!

Massive Breakdown in markets?1) BEARISH: Our INDICATOR (green/red) is getting the first bearish signal.
2) BEARISH: On the Weekly, Montly and even Yearly we see a massive bearish divergence in RSI.
3) BEARISH: The WEEKLY MACD has as almost a bear cross.
4) BEARISH: Corona is getting worse, the stocks are only up en everybody is getting more money in stocks?
5) BEARISH: Only the FED is pumping money but for how long
6) BEARISH: DXY (Dollar) looks for a trend reversal for a couple of weeks now (DXY is bullish)
Companies are closed and we didn't get the first bankruptcies. But I think we will see a Massive Breakdown in this market.
I like to trade, but I don't like to gamble on a world wide pandemic while stocks are a ATH (all time high)
Let's see if we getting in the green again. But I don't think we go up for a while now..
Please share your vision below!
