Market Update: Nifty Faces Bearish Pressure, 17-21st feb
Nifty closed at 22,929 this week, marking a decline of 630 points from the previous week's close. The index reached a high of 23,568 and a low of 22,774. As highlighted in my previous post, the bearish sentiment in Nifty remains intact, as both the monthly and weekly timeframes show negative trends. Until there is a significant reversal on these timeframes, the bearish outlook is expected to continue.
Looking ahead to next week, I anticipate Nifty will move within a range of 23,450 to 22,400 . The 22,300/22,400 zone offers strong support, and if this level is breached, we could see Nifty heading towards the 21,800 levels. Given this volatility, Nifty might not be the ideal index for small investors, particularly those heavily invested in mid and small-cap stocks. Let’s now take a closer look at the mid-cap and small-cap indices.
The Mid-Cap Index is currently near its key support level of 48,700 on the monthly chart. If it manages to hold this support next week, a potential reversal could follow, offering some relief to investors. On the other hand, the Small-Cap Index is still far from its crucial support of 14,500, which suggests that we could witness further downside of 4-5% in this segment . This could add more pressure on small-cap stocks, which are already facing a tough environment.
On a global front, the S&P 500 has finally broken through the strong resistance at 6,100 and closed above this level. If it manages to sustain above 6,100, we could see it reach 6,225 or even 6,376. This could potentially provide some tailwinds for the Indian markets, but for now, it seems that the Indian market remains under the tight grip of bearish forces.
In conclusion, while there are some signs of potential recovery in specific indices, the overall sentiment remains cautious. Investors should stay vigilant, especially in mid and small-cap segments, as the road ahead could be bumpy.
Spx500forecast

Sideways Markets? Heres why Im still getting paidSideways Market? Here’s Why I’m Still Getting Paid | SPX Market Analysis 12 Feb 2025
The markets may be moving like molasses, but that’s no problem when you’re getting paid to wait. While others are watching charts in frustration, our Theta decay is quietly dripping profits into our accounts. No rush, no panic—just letting the market do its thing while we collect.
Let’s break it down…
---
SPX Deeper Dive Analysis:
📉 Markets Are Moving Sideways—And That’s OK
SPX is stuck in a range, drifting aimlessly while traders wait for direction. But unlike those who need a big breakout to make money, we’re already profiting while standing still.
💰 Theta Decay – The Power of Getting Paid to Wait
While the market meanders, options lose value
That lost value turns into profits for our income trades
Instead of hoping for a massive move, we collect steady gains
📌 The Current Market View
We still anticipate a move from the upper range to the lower range 📉
No need to force trades—our edge is patience
If SPX moves, great. If not, we still win
🔑 Why Income Trading Wins in a Sideways Market
Unlike traditional trading methods where:
❌ You need a strong directional move to profit
❌ You rely on timing the market perfectly
❌ You risk getting stopped out too soon
We simply:
✅ Let Theta decay work in our favour
✅ Profit even when the market goes nowhere
✅ Have time on our side—no need for constant action
📌 Final Takeaway?
The market may be stuck, but profits aren’t. Theta is working, our positions are intact, and there’s no stress—just steady gains.
---
Fun Fact:
📢 Did you know? The S&P 500 has spent nearly 80% of its time trading sideways rather than trending up or down.
💡 The Lesson? The market isn’t always moving—but smart traders don’t need it to. That’s why income trading thrives when others struggle.

The S&P sell before the NFPWe are expecting a drop in the S&P later tonight based on what the charts are telling us.
1) The high of S&P is at 6118 and 6130.
2) There is a pattern to sell at the current level of 6080.
3) Yesterday's high to resist the trade.
4) H1 divergence present as well
The optimistic target is 5930 (1:3 risk to reward). We will monitor and post updates here as the trade moves.

Bearish Bias Locked int - Now We wait for the dropBearish Bias Locked In – Now We Wait for the Drop | SPX Market Analysis 11 Feb 2025
The bullish chapter is closed, and our focus is now entirely bearish as we eye a move toward 5980. Futures are already pointing lower, teasing a 20-point drop at the open.
Will we get the full range move, or will SPX keep stalling?
Either way, we’re locked and loaded—now, we wait for the market to tip its hand.
---
SPX Deeper Dive Analysis:
📉 Bearish Positions Locked In
SPX is now fully bearish, with bullish trades wrapped up profitably or at break-even following the bear turn signal. This continues to aligns perfectly with our 6 money-making patterns, where we expect a move from range highs to range lows.
📊 Futures Hint at a Lower Open
Overnight futures are already down 20 points, suggesting:
✅ A weaker SPX open
✅ A potential move toward 5980
✅ Confirmation that momentum is shifting lower
🔍 ADD Still Has Room to Fall
Yesterday’s ADD reading hit the upper bullish extreme
That leaves plenty of downside wiggle room
If ADD pushes lower, indexes could also follow through
⏳ For Now, It’s a Waiting Game
The bearish setup is in place
Price action will dictate the next move
A clean range move to 5980 remains the primary target
🚀 Key Takeaway? The market is aligning with expectations, but we still need follow-through to lock in profits.
Fun Fact:
📢 Did you know? In 1987, the Dow dropped 22.6% in a single day—the biggest percentage crash in history. That’s the equivalent of the S&P 500 dropping over 1,000 points today!
💡 The Lesson? Even in structured markets, major moves can happen fast. This is why having a rule-based trading system keeps you ahead of the chaos.

Monday sell Off? History May Repeat Itself...Monday Sell-Off? This Setup Says It’s Coming... | SPX Market Analysis 10 Feb 2025
Another week wraps up, and as I eye Monday’s open, I can’t shake a sense of déjà vu.
The last two weeks started with a gap down, followed by a bearish finish into the weekend.
Super Bowl Sunday is also here – Can the Kansas City Chiefs complete an unprecedented three-peat in Super Bowl 59 or will the Philadelphia Eagles gain revenge? Just like the markets, only time will tell and we will have to wait and see.
That said, Friday’s setup is setting the stage for another pop ‘n drop. The only question? What triggers the fall this time?
...
SPX Deeper Dive Analysis:
📉 Mondays Have Been Bearish – Will This One Be Too?
The last two Mondays started with a gap down, followed by a bearish move into the weekend. If the pattern holds, next week could open with a bang – but not necessarily to the upside.
🏈 Super Bowl & The Markets – A Perfect Parallel?
The markets are playing their own Super Bowl showdown. Will the bulls make a comeback, or will the bears crush their hopes yet again? Just like the Chiefs vs. Eagles, we can only wait and see.
🔻 Friday’s Bearish Setup – A Warning Sign?
- V-shaped reversal entry ✅
- Bearish pulse bar confirmation ✅
- Similar daily bar pattern to the last two Fridays ✅
📌 So What Happens Monday?
If history repeats itself, we could see:
- A pop higher at the open, luring in buyers 🏹
- A sharp drop shortly after, trapping the late bulls 🕳
- A repeat of the last two weeks' bearish close 📉
🔑 Key Takeaway: The setup is there. Now we wait for the trigger.
Fun Fact:
📢 Did you know? The Super Bowl Indicator suggests that if an AFC team wins, markets go bearish, but if an NFC team wins, markets go bullish.
💡 The Lesson? As ridiculous as it sounds, market psychology is a wild beast. While we don’t trade superstition, it’s always fun to see how random events get tied to stock performance.

SPX500 Bullish Bias!
HI,Traders !
SPX500 is trading in an
Uptrend and the Indice has
Formed a bullish flag
Pattern so as the Indice
Is breaking out we
Are bullish biased
And we will be expecting
A further move up!
Comment and subscribe to help us grow!

US500/SPX500 "Standard & Poor" Indices Market Bullish Heist Plan🌟Hi! Hola! Ola! Bonjour! Hallo!🌟
Dear Money Makers & Robbers, 🤑 💰
Based on 🔥Thief Trading style technical and fundamental analysis🔥, here is our master plan to heist the "US500 / SPX500" Indices market. Please adhere to the strategy I've outlined in the chart, which emphasizes long entry. Our aim is the high-risk Red Zone. Risky level, overbought market, consolidation, trend reversal, trap at the level where traders and bearish robbers are stronger. Be wealthy and safe trade.💪🏆🎉
Entry 📈 : You can enter a Bull trade after the breakout of MA level 5960 (OR) Entry in Pullback 5820
Stop Loss 🛑: Using the 2H period, the recent / nearest low or high level.
Goal 🎯: 6000.00 (or) escape Before the Target
Scalpers, take note 👀 : only scalp on the Long side. If you have a lot of money, you can go straight away; if not, you can join swing traders and carry out the robbery plan. Use trailing SL to safeguard your money 💰.
Warning⚠️ : Our heist strategy is incompatible with Fundamental Analysis news 📰 🗞️. We'll wreck our plan by smashing the Stop Loss 🚫🚏. Avoid entering the market right after the news release.
Fundamental Outlook 📰🗞️
Expected Trend: The US500/S&P500 index is expected to move in a bullish trend.
Drivers of the Trend: The bullish trend is driven by:
Strong US economic growth
Low interest rates
A potential rebound in corporate earnings
Current Price: The current price of the S&P 500 is around 5802.
Client Sentiment: 51% of client accounts are holding long positions on this market.
Top Risers: Some of the top risers in the US500 index include stocks with percentage changes of:
27.55%
5.8%
32.96%
Top Fallers: Some of the top fallers in the US500 index include stocks with percentage changes of:
-26.21%
-17.09%
-49.06%
Dow Jones Index: The Dow Jones index has been holding support, despite rising yields putting pressure on global indices.
Earnings Growth: The S&P 500 is expected to report its strongest earnings growth since Q4 2021, with an 11.9% increase.
Market Sentiment:
Bullish Sentiment: 60% of traders and investors are bullish on the US500/S&P500, expecting the market to continue its upward trend.
Bearish Sentiment: 30% of traders and investors are bearish on the US500/S&P500, expecting the market to pull back or reverse its trend.
Neutral Sentiment: 10% of traders and investors are neutral on the US500/S&P500, waiting for more information or confirmation before making a trade.
Please note that this is a general analysis and not personalized investment advice. It's essential to consider your own risk tolerance and market analysis before making any investment decisions.
Take advantage of the target and get away 🎯 Swing Traders Please reserve the half amount of money and watch for the next dynamic level or order block breakout. Once it is resolved, we can go on to the next new target in our heist plan.
Keep in mind that these factors can change rapidly, and it's essential to stay up-to-date with market developments and adjust your analysis accordingly.
💖Supporting our robbery plan will enable us to effortlessly make and steal money 💰💵 Tell your friends, Colleagues and family to follow, like, and share. Boost the strength of our robbery team. Every day in this market make money with ease by using the Thief Trading Style.🏆💪🤝❤️🎉🚀
I'll see you soon with another heist plan, so stay tuned 🫂

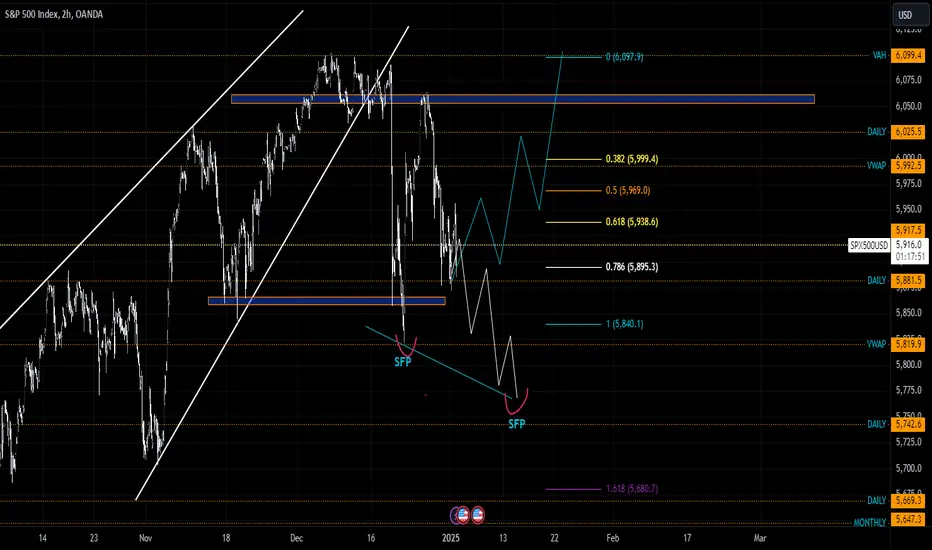
S&P Scenario 2.1.2025In this market, in order to consider some long setups, we need to hold the 6060 level or something around it, and since we didn't hold this support, we had a way to go short after the breakout. Now I see a scenario like this: the market should come for the sfp below the low as shown, or it will start to rise directly into the long, but as long as we are below the 6060 level, I'm considering a long setup. I would take that if the sfp below the low was met.
"US500 / SPX500" Indices Market Bullish Heist Plan🌟Hi! Hola! Ola! Bonjour! Hallo!🌟
Dear Money Makers & Robbers, 🤑 💰
Based on 🔥Thief Trading style technical and fundamental analysis🔥, here is our master plan to heist the "US500 / SPX500" Indices market. Please adhere to the strategy I've outlined in the chart, which emphasizes long entry. Our aim is the high-risk Red Zone. Risky level, overbought market, consolidation, trend reversal, trap at the level where traders and bearish robbers are stronger. Be wealthy and safe trade.💪🏆🎉
Entry 📈 : You can enter a Bull trade after the breakout of MA level 5960 (OR) Entry in Pullback 5820
Stop Loss 🛑: Using the 2H period, the recent / nearest low or high level.
Goal 🎯: 6100 (or) escape Before the Target
Scalpers, take note 👀 : only scalp on the Long side. If you have a lot of money, you can go straight away; if not, you can join swing traders and carry out the robbery plan. Use trailing SL to safeguard your money 💰.
Warning⚠️ : Our heist strategy is incompatible with Fundamental Analysis news 📰 🗞️. We'll wreck our plan by smashing the Stop Loss 🚫🚏. Avoid entering the market right after the news release.
Fundamental Outlook 📰🗞️
Based on the fundamental analysis, I would conclude that the US500 / SPX500 is : Bullish
Reasons:
US economic growth: The US economy is expected to grow at a rate of 2.5% in 2023, driven by a strong labor market, increasing business investment, and a rebound in the housing market.
Monetary policy support: The Federal Reserve has kept interest rates at a low level of 1.5%, which is expected to support borrowing and spending in the economy.
Fiscal policy support: The US government has announced a series of fiscal stimulus measures, including tax cuts and infrastructure spending, which are expected to support economic growth.
Corporate earnings growth: US companies are expected to report increasing earnings in 2023, driven by a strong global economy and a competitive dollar.
Valuation: The US500 / SPX500 is currently trading at a relatively high valuation, with a price-to-earnings ratio of 20, but this is still below its historical average.
However, it's essential to consider the following risks:
Global economic slowdown: A slowdown in global economic growth could reduce demand for US stocks and drive down the index.
Trade tensions: Escalating trade tensions between the US and other countries, particularly China, could impact the US trade balance and economic growth.
Inflation concerns: Rising inflation could lead to higher interest rates, which could negatively impact the economy and the stock market.
Key Fundamental Indicators:
US GDP growth: 2.5% (2023 estimate)
Unemployment rate: 3.5% (2023 estimate)
Inflation rate: 2.0% (2023 estimate)
Interest rates: 1.5% (2023 estimate)
Corporate earnings growth: 10.0% (2023 estimate)
Market Sentiment:
Bullish sentiment: 75%
Bearish sentiment: 25%
Neutral sentiment: 0%
Please note that this is a general analysis and not personalized investment advice. It's essential to consider your own risk tolerance and market analysis before making any investment decisions.
Take advantage of the target and get away 🎯 Swing Traders Please reserve the half amount of money and watch for the next dynamic level or order block breakout. Once it is resolved, we can go on to the next new target in our heist plan.
Keep in mind that these factors can change rapidly, and it's essential to stay up-to-date with market developments and adjust your analysis accordingly.
💖Supporting our robbery plan will enable us to effortlessly make and steal money 💰💵 Tell your friends, Colleagues and family to follow, like, and share. Boost the strength of our robbery team. Every day in this market make money with ease by using the Thief Trading Style.🏆💪🤝❤️🎉🚀
I'll see you soon with another heist plan, so stay tuned 🫂

THE Scariest Trend Line you will ever have to see/consider !!!This upper line of resistance is where its all breakdown or break out !!!

Year 2025 and Beyond: Where to Place Your Bets?S&P 500:
US indices may continue their upward trend until the first quarter of 2025. The ultimate target appears to be above 6300, where they may peak and begin a significant correction. A global stock sell-off could potentially trigger a stock market crash similar to that of 2008.
India's Nifty 50:
India's Nifty 50 may find support around the 23,000–22,700 range and resume its upward movement in the final fifth wave, targeting a peak near 29,000. The Nifty 50 is likely to follow a trend similar to the S&P 500. The bullish cycle that began in 2009 is expected to conclude near the 29,000 level. Subsequently, a significant sell-off in Indian indices could trigger a major bear market, potentially erasing up to 50% of market capitalization from its peak.
Gold:
Gold may continue its consolidation for another month or two. A final surge toward the $3,000–$3,100 range is expected to mark the end of the rally that began in December 2015 at the $1,050 level. However, the bear market in equities is unlikely to spare even the perceived safe haven, leading to a pullback in gold prices as well.
Brent Crude:
Since March 2020, Brent crude experienced a remarkable rise, surging from $15 per barrel to $139 per barrel by March 2022. Over the past 33 months, it has already corrected by more than 47%. Brent crude is still expected to decline further, potentially reaching $50 per barrel within the next 3 to 6 months. However, the current inflationary trend could drive Brent prices beyond $160 per barrel later in 2025, before eventually succumbing to a deflationary trend that may persist for several years.
US Dollar Index:
The US Dollar Index peaked at around 114 in September 2022. Since then, it declined to 100 by July 2023 before starting to rise again in a corrective A-B-C pattern, forming part of a larger (A)-(B)-(C) decline. The Wave C of (B) is expected to conclude near 109, followed by another decline toward 98 by the first half of 2025. However, a renewed bullish trend in the US Dollar Index could reinforce the "Cash is King" narrative during a global equity market downturn.
USD/INR:
The bullish trend in USD/INR, which began in January 2008 at the 39 level, has seen the Indian Rupee weaken by over 60% against the US Dollar over the past 17 years. In the short term, USD/INR may peak around 86. However, the Rupee is likely to weaken further, reaching 90 against the US Dollar by the second quarter of 2025.
US Govt. 10 years bond yield:
The long-term yield on U.S. Government 10-year bond's yield indicates rising interest rates for this decade. In the short term, the yield may ease to 3%-2.6% by the second quarter of 2025. However, fears of a U.S. Government default could push the yield to 10% or higher over the next couple of years. The "Bond Ghost," along with a global equity rout, may haunt investors again in 2025-2026.
Bitcoin (BTC):
Bitcoin's bullish trend may continue until the first quarter of 2025, albeit at a slower pace. BTC still has the potential to reach around $115k-$120k, concluding the bullish run that began in November 2022 from the level of $15,500. Over the past decade and a half, BTC has significantly outpaced any other asset class globally. However, global risk aversion, which may start with an initial global equity market sell-off, could pause Bitcoin's bullish journey for the rest of 2025. Before the end of 2025, BTC might lose up to 50% of its value from its peak.
In the longer run, however, BTC has the potential to become the most valuable asset class globally, even after experiencing a 50% erosion in its value.

Rate Cut Disappoints: Stocks and Gold Experience Sharp Declines◉ Abstract
On December 18, 2024, the Federal Reserve lowered interest rates by 0.25%, marking its third cut in a row. However, the Fed also said it might not cut rates much more in the future because it expects the economy to grow stronger and inflation to continue. This cautious message worried investors, causing a sharp drop in the stock market.
The S&P 500 fell about 2.96%, its biggest one-day loss since August. Gold prices also dropped by around 1.6%. The declines in both stocks and gold show that investors are feeling uncertain about the economy and are rethinking their investments based on the Fed's outlook.
Continue reading the full article:
◉ Introduction
On December 18, 2024, both the S&P 500 and gold experienced significant declines, driven primarily by the Federal Reserve's monetary policy decisions and market reactions to economic forecasts.
◉ Federal Reserve's Decision
● The Federal Reserve cut interest rates by 0.25%. This is typically a positive move for equities and commodities like gold.
● However, the Fed signalled a more cautious approach to future rate cuts, expecting stronger economic growth and persistent inflation.
● This cautious outlook raised concerns about the possibility of limited future rate cuts, which spooked investors.
◉ Market Reactions
1. Stock Market Decline
● The S&P 500 fell by approximately 2.96%, marking its largest single-day percentage drop since August 5th.
● The market's reaction reflected a realization that previous optimistic expectations about aggressive rate cuts were misplaced.
2. Gold's Decline
● Gold prices dropped sharply, with an intraday decline of about 1.6%.
● Gold, while a safe-haven asset, is less desirable in a rising rate environment due to increased opportunity costs.
● With the Fed's indication of fewer future rate cuts, investors shifted away from gold.
◉ Overall Market Sentiment
The simultaneous decline in both equities and gold can be attributed to a broader market sentiment that reacted negatively to the Fed's cautious outlook on inflation and growth prospects. This created a risk-off environment where investors were uncertain about both stock valuations and commodity holdings.

S&P 500 Potentially BullishFOREXCOM:SPX500 has been in a bullish direction. We have seen it make new highs and right now it is coming for a retest on the previously broken high. I will wait for a retest and see some price action at the 5,875.2 area before going long.
Until then, fingers crossed.
Past results does not guarantee future results, please do your due diligence
Like and follow for more

Is the financial system entering a new era?This chart is one of the clearest and most striking indicators of the S&P 500 and Monetary Expansion around the world on a monthly basis.
Is history repeating itself or is the financial system entering a new era ?
Markets are rising again after the Mortgage Real Estate Crisis in 2008 and the Covid-19 Pandemic in 2020. But what is behind this rise? Could the fact that the S&P 500 has held its value while the money supply has skyrocketed be a harbinger of a new growth cycle?
What is remarkable;
In the 2008 Real Estate Crisis, this ratio, which had been steadily moving above the trend line, was pulled down sharply and trapped below the trend line. For many years, there was an invisible pressure to maintain the trend below this line.
Whenever the trend line started to be tested again, this rate was pushed down again by the Covid-19 pandemic in 2020 .
January 2024 is a historic turning point;
It managed to rise above the trend line after exactly 16 years and entered a steady uptrend. This development sends strong signals that a brand new economic order has been established in the world.
So what happens now?
After testing a new ATH level , what crisis or crises await us in the markets? Or is the financial system heading for a completely different course from the historical scenario this time?

Scenario on s&p 500 13.12.24We have two scenarios for now, the first one is that if we want to get to the new ath, we need to keep the level around 6060, if that doesn't happen and we break below this level, it is possible that there will be a deeper correction, the first level is 6000, the deepest so far is 5880.

S&P Head and Shoulders by January - Knees and Toes by February?The S&P 500 has recently formed a solid left shoulder and is now halfway through developing the head of a potential Head and Shoulders reversal pattern and divergence suggest we could form the right ear this week. This classic chart formation is often a sign of an upcoming trend reversal, typically from bullish to bearish. If the current pattern continues to unfold, the index could complete the right shoulder by January, signaling a shift in market sentiment. The key to confirming this reversal will be a break below the neckline, which is the support level formed between the left shoulder and head (aka the pearl necklace). Traders will be watching closely for any signs of weakness in the market as the price approaches this critical level. While the pattern isn't set in stone, the possibility of a bearish trend emerging by early next year is something investors should keep an eye on. If the pattern completes, the S&P could experience a significant pullback, so keep your eyes peeled because it could get bananas. A move above the current zone could cancel out this pattern from forming.
Chance of forming: <50%

SPX500 / US500 Index Market Money Heist Plan on Bullish SideHallo! My Dear Robbers / Money Makers & Losers, 🤑 💰
This is our master plan to Heist SPX500 / US500 Index Market Market based on Thief Trading style Technical Analysis.. kindly please follow the plan I have mentioned in the chart focus on Long entry. Our target is Red Zone that is High risk Dangerous level, market is overbought / Consolidation / Trend Reversal / Trap at the level Bearish Robbers / Traders gain the strength. Be safe and be careful and Be rich.
Entry 📈 : Can be taken Anywhere, What I suggest you to Place Buy Limit Orders in 15mins Timeframe Recent / Nearest Low Point take entry in pullback.
Stop Loss 🛑 : Recent Swing Low using 2h timeframe
Attention for Scalpers : Focus to scalp only on Long side, If you've got a lot of money you can get out right away otherwise you can join with a swing trade robbers and continue the heist plan, Use Trailing SL to protect our money 💰.
Warning : Fundamental Analysis news 📰 🗞️ comes against our robbery plan. our plan will be ruined smash the Stop Loss 🚫🚏. Don't Enter the market at the news update.
Loot and escape on the target 🎯 Swing Traders Plz Book the partial sum of money and wait for next breakout of dynamic level / Order block, Once it is cleared we can continue our heist plan to next new target.
💖Support our Robbery plan we can easily make money & take money 💰💵 Follow, Like & Share with your friends and Lovers. Make our Robbery Team Very Strong Join Ur hands with US. Loot Everything in this market everyday make money easily with Thief Trading Style.
Stay tuned with me and see you again with another Heist Plan..... 🫂

S&P 500: Long Trade Targets AheadS&P 500 Trade Details:
The S&P 500 (SPX) on the 15-minute timeframe confirms a bullish breakout according to the Risological trading indicator . Target 1 (TP1) has been successfully hit, with higher targets in sight, as the bullish momentum sustains.
S&P 500 Key Levels:
Entry: 5889.16
Stop Loss (SL): 5872.22
S&P 500 Take Profit Targets:
TP1: 5910.09 ✅
TP2: 5943.96
TP3: 5977.82
TP4: 5998.75
Analysis:
The price action indicates strong upward momentum with consecutive bullish candles. The moving averages align to support the trend. Short-term resistance at higher targets may see consolidation before further upward movement.
Outlook:
With TP1 hit, the trade looks promising to reach TP2 and beyond. Keep monitoring momentum strength and secure profits as each level is achieved. Stay cautious of reversals near key resistance zones.

US500 SPX Technical Analysis and Trade Idea👀👉 The US500 has recently faced selling pressure, which could offer opportunities for short-term traders. In this video, we’ll break down the price action, assess the current trend and market structure, and look at potential counter-trend buy and sell setups during the retracement if the price action develops as anticipated. Risk Disclaimer: Forex trading carries significant risks, and market conditions may change suddenly. This content is for educational purposes only and does not constitute financial advice. 📉✅

SPX500 Will Fall!FOREXCOM:SPX500 is trading in a
Downtrend and the indice
Is making a pullback
From the horizontal resistance
Of 5771.33 from where
We will be expecting a
Further move down !

SPX500 Potential Short!SPX500 made a strong
Move upwards and the indice
Will soon retest a horizontal
Resistance of 5859.42 from
Where we will be expecting
A local bearish pullback
And a move down !

US500 S&P Technical Analysis & Trade Idea 👀👉 US500: I am carefully watching for a potential buying opportunity based on the key criteria discussed in the video regarding the SPX. In this analysis, we will examine the crucial price action signals to track and how to position yourself strategically to capitalise on the next market move. Disclaimer: This analysis is for informational purposes only and is not intended as financial advice.📊✅

S&P 500 (SPX) Hits All Targets! Bullish Rally CompletesThe S&P 500 Index has shown strong bullish momentum, with the long trade successfully reaching all profit targets.
Key Levels
Entry: 5719.98 – The long position was entered as the price broke above this level, confirming bullish sentiment.
Stop-Loss (SL): 5703.41 – Positioned below recent support to protect against potential downside risk.
Take Profit 1 (TP1): 5740.45 – The first target was hit, confirming the upward momentum.
Take Profit 2 (TP2): 5773.57 – The second target was achieved as the bullish trend continued.
Take Profit 3 (TP3): 5806.70 – The third target was reached, indicating continued strength in the market.
Take Profit 4 (TP4): 5827.17 – The final profit target was reached, marking a highly successful long trade.
Trend Analysis
The price is well above the Risological Dotted trendline, indicating a strong bullish trend. The steady upward movement suggests that the market sentiment is favorable for further gains, although all targets have been hit, marking the trade's conclusion.
The long trade on the S&P 500 Index successfully hit all profit targets, with the final target at 5827.17 signaling a strong rally. The upward momentum was supported by the Risological Dotted trendline, reflecting solid market conditions for bullish trades.
