S&P 500 short position/SPX SELL and DROP=SHORTSPX shows signs of serious weakness having on mind technical side of the story.
TECHNICAL PART:
- DAILY MACD BEARISH
-WEEKLY MACD BEARISH
-DAILY STOCH RSI BEARISH.
-WEEKLY STOCK RSI BEARISH
From technical side i don't have doubts that stock market will experience one more crash which will be followed by inflation of USD towards 1,26 and 1,35 instance over EUR.
From fundamental side, S&P 500 had three technical years historticaly (continual growth since 2008-nowdays) followed by a big crash on January 30.th when index fell from 3400-2200 index points.
THATS 12 YEARS OF CONTINUAL GROWTH APROXIMATELY, since 1 technological year equates to 4-5 calendar years.
USD MADE TRIPLE JUMP IN TECHNOLOGICAL SECTION BRINGING TECHNOLOGY to 5 NM.
THEREFORE, I DO EXPECT SIMULATIOUS DROP ON NDAQ AND DJI.
Now, after this " butterfly pattern" manifests, index of this unsustainable price will bring #SPX index to 2400 points and lower levels including very top of it at 1867 level.
GERMAN ECONOMY WILL FOLLOW, I've stated it in the other chart of mine :
CLEAR YOUR POSITIONS.
Cheers
Spx500forecast

S&P 500 Long Setup!I think we will have one more leg up at least before the election. If you find this useful please leave a like I would appreciate it :)

SPX500 BUY SIGNALey tradomaniacs,
welcome to a new free trading-setup.
SPX500: Daytrade-Execution
Market-Buy-Order: 3465,00
Stop-Loss: 3435,00
Target 1: 3495,00
Target 2: 3510,00
Target 3: 3535,00
Target for One-Target-Trader: 3510,00
Stop-Loss: 30 pips
Risk: 0,5% - 1%
Risk-Reward: 2,30
LEAVE A LIKE AND A COMMENT - I appreciate every support! =)
Peace and good trades
Irasor
Wanna see more? Don`t forget to follow me.
Any questions? PM me. :-)

SPX500 could move UP soon!Hey tradomaniacs,
looking at the current structure of SPX500 we could see a move up as we see a falling wedge here which is a trend-continuation-pattern.
Of course, a pattern itself is no buy.signal, but it is an evidence for a possible break to the topside.
Fundamentals such as corona-figures, STIMULUS and tradewar will tell us.
In case of a breakout we could execute a long-position with a nice risk-reward-ratio. :-)
LEAVE A LIKE AND A COMMENT - I appreciate every support! =)
Peace and good trades
Irasor
Wanna see more? Don`t forget to follow me.
Any questions? PM me. :-)

Spx500 Break and retest entryS&P looking like its making a morning star at the 61.8% on the Fibonacci and the retest zone. Going to target the previous high.


SPX500 Long SetupPrice will come into this area and find support as it will be a 15min HL and a double bottom on the 5 min at a previous HL. Easy pips you enter here

S&P 500 1D-TIMEFRAME ANALYSIS✨S&P 500 1D-TIMEFRAME ANALYSIS✨
Hello ladies and gentlemen
This is my new idea for the SPX
My idea is that the index will go higher
Target
3820
I hope my idea is clear
Support me by like and share
Good luck💰💯

SP500- rallies should be soldAs I expected, 3500 zone is strong resistance for SP500 and with this new fail it became even stronger.
I expect a drop to 3200 zone but, considering the 50% rally from March's low, I would t be surprised of a fall to 3k zone till the end of the year.
Sell rallies around 3500 could be a good strategy

S&P 500 Breakout Opportunity Short-TermS&P 500 Breakout Opportunity Short-Term
Go long in SPX if it gives upside breakout and go short in case it breaks downside.

SPX500 Making Head & Shoulders PatternMake sure you like the post if you enjoy the publication! Thanks for the support!
Price currently making a head and shoulders pattern on the 2HR. Looking to target the daily retest zone to look to possibly take a long from there next. Wait for the 2HR candle to close for confirmation. We want a doji, spinning top or a bearish candle and will enter at close immediately.

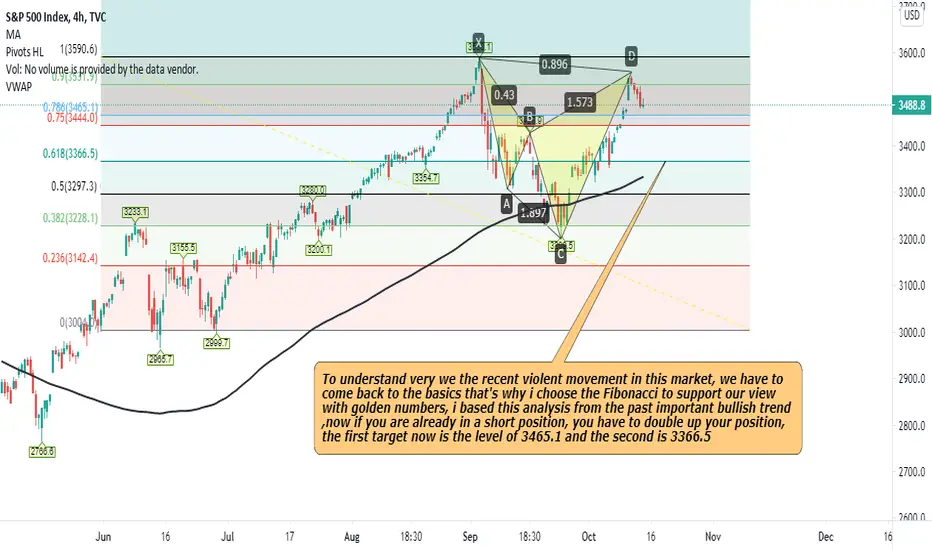
SPX AND THE BIG SHORT To understand very we the recent violent movement in this market, we have to come back to the basics that's why i choose the Fibonacci to support our view with golden numbers, i based this analysis from the past important bullish trend ,now if you are already in a short position, you have to double up your position, the first target now is the level of 3465.1 and the second is 3366.5

S&P 500 4H-TIMEFRAME ANALYSIS 💡S&P 500 4H-TIMEFRAME ANALYSIS 💡
Hello ladies and gentlemen
This is my new idea for the S&P 500
My idea is that SPX will continue to downtrend
Targets
3200
3070
I hope my idea is clear
Support me by like and share
Good luck 💰💯

SPX500: Possible long for todayEntry: 3355
SL: 3344
TP: 3366
------------------------
Trading Kitchen

S&P 500 4H-TIMEFRAME ANALYSIS 💡S&P 500 4H-TIMEFRAME ANALYSIS 💡
Hello ladies and gentlemen
This is my new idea for the S&P 500
My idea is that SPX will continue to downtrend
I hope my idea is clear
Support me by like and share
Good luck💰💯


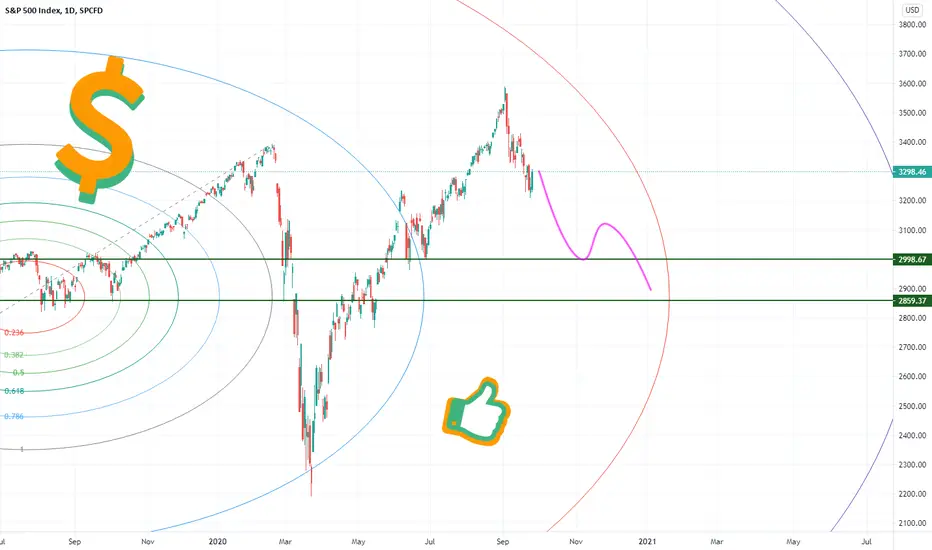
S&P At Unsustainable Levels???For the past 9 years the S&P 500 has not been able to live outside of this channel for long, eventually it's pulled back inside like a metal to a magnet.
Zooming out and viewing from a macro scale I would say we are going to revisit the channel soon possibly after the next leg up around the election or shortly after..

SPX500 possibile sell for todayPossible intraday SELL
(to do within 3pm, eventually)
Entry: 3322
SL: 3334
TP: 3283

S&P 500 1D-TIMEFRAME ANALYSIS 💡S&P 500 1D-TIMEFRAME ANALYSIS 💡
Hello ladies and gentlemen
This is my new idea for the S&P 500
My idea is that SPX will continue to downtrend
Targets
3000
2850
I hope my idea is clear
Support me by like and share
Good luck💰💯
SPX RALLY OVER? I THINK NOT YET.expecting one more strong bounce again soon.
TP Level : 3600+
Stop < 3090 daily close.

SP500 (SPY) Hard SELL off of 3440-3500. Good for 400 points!Let's hope it gets up there, first! (Currently scalping/long for bounce.)

SPX's Possible Touch Down Area ( if history is repeated !?)simple. we are now the same as we with the 200 day moving average the last time we did it.
wish you all the best
