Optimism is good but (1500-1600) can't be ignoredStocks markets, risk assets, Cryptos are rallying (maybe recovering is a better term) as markets participants try to price in a possible slowdown in the COVID-19 pandemic.
But, even if the Pandemic miraculously disappeared today, the massive economic shock won't disappear anytime soon.
Major indices all over the world have already plummeted into Bear Territories and the recent rally is simply a correction. In fact, if you look at previous bear markets, you will find plenty of temporary Bullish rallies within the larger Bearish move.
So, I would advise everyone not to get carried away by this. This, of course, doesn't mean that you shouldn't buy good value stocks. In fact, I have already bought some stocks last month and I plan on investing in good value stocks over the next 12-20 months and hold them till the end of the next Bull market.
In the next few months, we will be dealing with bad economic data, a bigger than 2008 recession(probably), job cuts.
So, such rallies as the one we are seeing now will be sold aggressively and markets will plummet into fresh lows. Until a 50%-55% drop has happened, we can't start thinking about bottom formation. And in my opinion, we are at least 18-36 months away from that.
Spx500forecast


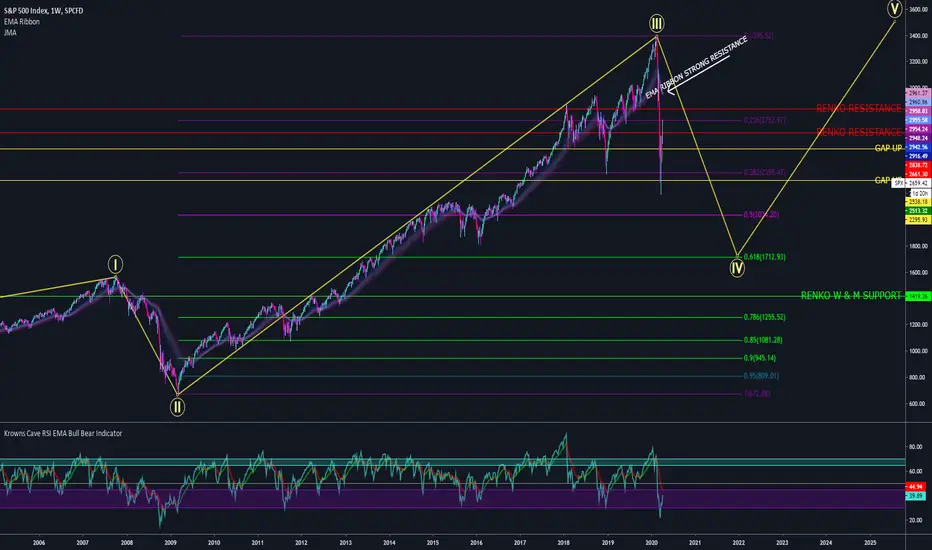
SPX S&P 500 - Loss of momentum on W and M - High resistanceHello, hope your safe and on your guard in those difficult moments. My analysis on the Weekly Chart just before the Heikin Ashi candle close. Right now it doesn't look good. The tails like to be eaten, but let's wait and see how the candle will end. At this moment the look that he want to reject it. The most concerning things for me is the break down of the EMA Ribbon.. this is usually a sign that the retracement will be much longer but market makers could play with that. They actually want you to put back your money inside the market.. to eventually eat more liquidity. They want to let you think that the market is ready to get back on track when the market is only retracing to a gap down exactly on the daily ema ribbon resistance. What I see is that the market can let believe believe a little more that this trend up is there to stay when in reality they will eat all the liquidity around Easter and pull back quickly on the fib 0.5%. Please note that I have not included a Gap Down as I consider that they will eventually be filled upwards by wave 5. Here are some important details for the S&P 500:
Renko Resistance: 2838.72
Renko Resistance: [/boquer2661.30
Gap Up: 2538.18 (bottom part of the gap up)
Gap Up: 2295.93 (bottom part of the gap up)
JMA: [/boquer2513.32 (currently support)
Fibonnaci [/boquer0.5 à 2034.20
Fibonnaci 0.618 to 1712.93
Momentum: MACD is down in change of direction on the weekly and downhill on the monthly ... so losing momentum in the long term ..
RSI: In BEAR territory on Montlhy and Weekly
Eliott Wave: As we are on a cycle III retracement wave and the wave 2 retracement was 0.618%, I believe that the 0.5% and 0.618 retracement are the more likely and the 0.382 retracement has been smashed and is not sharp.
look with new lens I think we are at the point where there could be a rapid change in sentiment based on the viruses progress, global tensions, oil price war, etc.
If there is no "event" to push the market down rapidly, I believe the return to "normal" will be slower than anticipated for many people. The virus obviously has had, and continues to have, major effects on every industry/sector.
lines on chart are levels of interest/loose trends based on
blue = 3M
purple = 1M
grey = 1W
I think we may reach 2300-2400 before the end of the month and then head to retest the previous lows.

SPX Idea4H timeframe (shorter timeframe) looks bearish with the development of a rising wedge, while weekly chart looks bullish with the development of a broadening wedge. Weird pair however on the weekly chart, couldn't find all the data.

SPX500USD technicaly based forecast
📌Short intro:
I am full time trader - analyst * High accuracy of ideas * Technicaly and Fudnamentaly side in analysis * Comment if have any questions or want to send support
📌Why DepaDigitalTrading:
*Analysis based on my program and tactic readings
*Fundamental side in analysis
*Price action - FIBO - Candl pattern
*FX - STOCK - CRYPTO
*Day trader - Swing trader - Position trader - "Sniper"
*Simple ideas
💡 SPX500USD technicaly based idea, technicaly indicators showing we can expect higher push up in price, we can see strong bulish candels formed, technicaly picture good, expecting to see push in price till FIBO 0.6
📌Have on mind, trading involves risk, check idea on your own tactic, if have questions pls comment!
Thanks on supporting!
All best, good luck!

SPX500USD Weekly Chart - Short - Trade Set Up RIP U.S. ECONOMY Forex & Chill
Chilling to witness the death of the U.S. Economy on the charts.
Fortune 500 companies crumbling
cryptocurrency booming
what a time to be alive
thank you god for all of your blessings

SPX500 SHORT SET UP SELL S&P500
ENTRY 1 2424
ENTRY 2 2432
SL 2448
TP.1 2402
TP.2 2386
TP.3 3358
Tp.4 3328

SPX500: next 2 scenarios#SPX500 has just touched the strong bearish trendline you can see on Daily.
Now 2 scenarios.
First Scenario: The price breaks it and go up until 2800 (Fibo 50%) first and then 2935 (Fibo 61%)
Second Scenario (on our opinion the most credible): the price breaks the support, bounces on hit and go to complete the Elliot Wave on point 5 (and 1.618%) at 2000.

market crash finally here, been waiting 2 years for itWe all knew it was going to happen, here it is, the markets have been propped up by the feds and global economies haven't been good for a while, been waiting for the straw that broke the camels back....
aaaaaannd, here it is, coronavirus shutting the global economies down will make this a recession and eventually a depression soon.

SPX | S&P500 | Very easy Elliott Forecast and some ideasI will wait 6 months before investing in stocks. Now time for Oil, Gold and Forex :-)

SPX500: Bull Rally May ResumeHi Traders,
Until the drop we had on February 20th, price was making a strong case for continuation towards 4000. This may still happen, as this current drop has completed a WXY expanding flat (i.e. wave 4 on the higher degree).
I'm therefore looking for price to confirm long setups as it is expected that the bull rally may resume.
Trade with care!
Regards
Wave Theorist


SPX500 LONG SET UPS&P500 BUY LIMIT
ENTRY 1 2698
ENTRY 2 2686
SL 2654
TP.1 2720
TP.2 2764
TP.3 2828
TP.4 2900


S&P500 LONG SET UP (CORONA VIRUS ANALYSIS)S&P500 BUY LIMIT
ENTRY 1 2938
ENTRY 2 2868
SL 2800
TP.1 3068
TP.2 3138
TP.3 3268
TP.4 3338

SPX500 - the beginning of a recession?😲Good afternoon! It was a fun week for traders! The stock market is flying down. Is coronavirus so quickly led to such consequences, or is it just a reason to make money?
The graph shows the price movement options. We have already observed a correction of more than 21% in 2018. and everyone was expecting a recession. However, the price pushed off support and continued to grow. What will happen this time ??? There are several options. Which one will work time will tell.
Thanks to all my subscribers and readers for your attention! 🙏
Success and profit!
Do not leave, without like, and if you liked my analytics sign up, and you definitely will not miss anything!
Disclaimer:
I do not give entry and exit points.
I share with you my opinion and ideas, which may differ from yours.

SPX Long IdeaJust a trading idea, not trading advice.
Quit the shock of a move over a little bit of virus fear that will almost certainly soon blow over.
Not even 100,000 recorded patients infected to date, with a world population of over 7,700,000,000.
Some predict further, some predict recession, some predict the end of the world.
At least in the short term, I predict a dip that is about to reverse.
Let's see where it goes shall we?
Opinions?

S&P500 SPX LONG SET UP AFTER CORONAVIRUS HIT MARKETBUY LIMIT S&P500
ENTRY 1 3014
ENTRY 2 3006
SL 2980
TP.1 3054 & TP.2 3106
Tp.3 3154 & TP.4 3206
TP.5 3254 & TP.6 3306
Stock market’s 6-day drop flirts with fastest slide into correction territory since 2008
Another sharp fall for U.S. stocks on Thursday pushed major indexes into correction territory, marking a drop of more than 10% from all-time highs. Here’s where major indexes would need to close to formally mark a correction.
MarketWatch · 9 minutes ago

S&P500 - crucial support needs to holdS&P futures reached major support area, which definetely needs to hold now for possibility of another ATH in 2020
Otherwise, if price is going below 3000, equity markets are in major trouble and we are likely entering phase of major bear markets and economic recession, last seen during 07-08 period.
Therefore, long ideas should be attempted with major caution and tight stops. Yes, it may be another opportunity to buy the dip, but if it is not, we should be prepared.

S&P500 LONG SET UP AFTER (CRONAVIRUS DESTROYED MARKET)S&P500 Trade
BUY S&P500
ENTRY 1 3102
ENTRY 2 3086
SL 3071
TP.1 3142
TP.2 3206
TP.3 3286
Tp.4 3320
