SPX500 New Entries + Exits (Best Reverse + Momentum Strat Ever)The 1on1 video is currently out, if you would like it in order to understand how to play my analysis FULLY, please let me know privately.
All likes/comments and feedback are very much appreciated!
How to play my chart:
Buy at support, sell at resistance. When you open this chart you'll see a green entry and a red entry. When the candlestick hits the green entry, you place a buy. If however that support buy doesn't go into profit and goes negative -35 or -60 pips (depending if it was a fast break/or if the break landed on a minute 15 zone), if it breaks you would then exit your buy and immediately enter the sell. You would then ride that sell down to green TP1, or you could then repeat and play the buy/break there.
The same exact thing goes for resistance sell/break plays!
Spx500idea

Spx500 Short SignalGoing short on Spx as it’s extremely bearish on almost every timeframe. Going for a 3R trade. Goodluck and have proper risk management if you take this as well!

S&P 500H&S target 3500
Black dashed line, ciould provide support for a week or so, RSI is near overesold.
However the weakness in May shoudl be used to sell and book profits/losses to enter at 3500 levels.

S&P 500 4 HOURSThe post complements the previous chest of stock SP500
*********
My diagnosis last month was still valid
**********
I hope not as I see it, but there is a possibility of falling to 4150
**********
TANKS

S&P 500 See, according to the existing page, our external harmonic bat pattern enters the fall from 4632 to 3875
*******
Fibonacci says we may have a 50% return, maybe up to 38 Fibonacci and sometimes 23 Fionachi will go back.
*******
We now see 4 strong downward contexts
******
But this 200 pp rise does not mean that stocks are rising
*******
With this situation, the news that indicates inflation in the world and traders are going all the way to gold.
********
I hope you are not fooled by HFT institutions in transactions
***********
We are the market fuel, so let 4500 be completed and the market trend be determined

Spx500 Short SignalJust set a sell limit right here on spx500. Had a nice bullish run but didn’t break the high or low. Also the weekly will likely still close bearish so I expect price to take out those lows. Have a nice 15m shift leaving some imbalance to fill and have my stop above the swing High. Use proper risk management and fingers crossed we get triggered in after this nice bearish 4h closes!
S&P chart from a different perspective / Plan HI think the technical chart is like a galaxy, and the easier it is to look at it from a distance.

GBPJPY Entries + ExitsThe 1on1 video is currently out, if you would like it in order to understand how to play my analysis FULLY, please let me know privately.
All likes/comments and feedback are very much appreciated!
How to play my chart:
Buy at support, sell at resistance. When you open this chart you'll see a green entry and a red entry. When the candlestick hits the green entry, you place a buy. If however that support buy doesn't go into profit and goes negative -35 or -60 pips (depending if it was a fast break/or if the break landed on a minute 15 zone), if it breaks you would then exit your buy and immediately enter the sell. You would then ride that sell down to green TP1, or you could then repeat and play the buy/break there.
The same exact thing goes for resistance sell/break plays!

SPX Zig Zag ABC for Cycle Wave 4Hi everyone, SPX is currently playing Impulse Intermediate wave 5 of a Main A Wave. Most probable targets for this Wave 5 are 4212 and 3976. Because last Wave 2 (in blue) was very strong, im expected at least a troncated wave 5 at 4212. 4358 (100% of fobonnacci) is the 1st possible Wave 5 target but i would be very surprised if the market makers are not bringing the market down to 4212 because a double bottom would provide us a better bounce back for the next B wave and can at the same time create a bullish divergence on lower timeframes like the 4 hours or 1 day chart. We should not forget that the last january 04rt SPX began a Cycle wave 4 retracement. Here are the most probable targets for this full Cycle Wave 4 Retracement :
0.24% = 3878.24
0.30% = 3643.26
0.382% = 3322.12
0.50% = 2860
0.618% = Golden fib at 2398
We must keep in mind Cycle Wave 2 of SPX was pretty strong in March 200, which make this Cycle Wave 4 more chance to be light. Usually most probable target for a W4 is in between 0.3% and 0.5%. With inflation currently slowly stablizing a little , 3643.26 or even 3878.24 are on the table and pretty realistic.
For now im projecting the next B Wave in between 4443.89 and 4729.88.

S&P INDEXHello traders. I expect the price to correct at least 50% of its previous uptrend after the end of the pullback. Be profitable

SPX500 TRADING PLAN - BUYLooking for s&p to fill in the imbalance and potentially run higher.
2 entries have been identified, one where price could tap into the imbalance (which is also a quarter point level) and run higher
The other, price could retrace into the daily orderblock and then run higher, this entry provides a better R:R
DISCLAIMER: I am not a financial advisor and nor is this financial advice.

S&P500 INDEX - ATH is comingHello friends.
Please support my work by clicking the LIKE button(If you liked).Thank you!
Everything on the chart.
I'm waiting for an upward movement from the current ones or through ~4650.
TP: 4850 and 5000
cancellation of growth, consolidation below 4500
risk is justified
Good luck everyone!
Follow me on TRADINGView, if you don't want to miss my next analysis or signals.
It's not financial advice.
Dont Forget, always make your own research before to trade my ideas!
Open to any questions and suggestions.

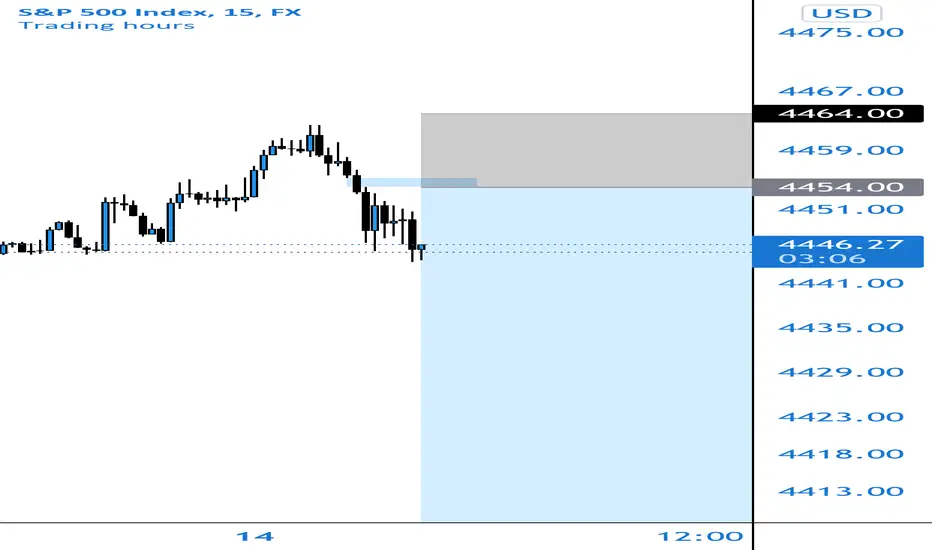
SPX500 Entries + Exits for FREE!The ENTRY/TP zones are your entries as well as your exits.
Everything above the current candlestick is resistance, you would treat every zone above as a sell/potential buy break.
Everything below the current candlestick is support, which you would then treat every zone below as a buy/potential sell break if it hits the pip rule.
More info on the strategy and how to play it:
How To Play The Chart Entries/Exits:
Buy at green support entry, if it breaks by -35 pips (count it out) then enter a sell and ride to TP1, 2 and 3. Trail stop at each TP which means place your stop loss in profit but with enough room to be able to continue the sell if it continues. Same thing at resistance, sell but if broken by 35 pips then enter the buy and ride to TP1. Each TP is a support or resistance zone , so you could then even take a sell after TP1 for the buys have been hit and if it breaks out then just repeat.
All likes/comments and feedback are very much appreciated! Thank you to all of those who support me on a weekly basis, it really does mean a ton to me!

S&P 500 Forecast: Index Wipes Out Most of Wednesday LossesThe S&P 500 has rallied significantly during the course of trading on Thursday to wipe out the losses from the Wednesday session. We managed to close above the 50 day EMA, as it looks like markets are ready to continue to go to the upside for a longer-term move. All things being equal, this is a market that I think continues to see plenty of interest, as we have seen so much in the way of bullish behavior over the last several months.
Yes, the market has negative for a while, but that has been the most recent behavior, and at this point in time it is but a blip on the radar of the longer-term trend. That being said, the market is likely to continue to see buyers looking for value, especially as the end of the year approaches, and people will be looking to reach some type of benchmark for their clients. Because of this, we have the so-called “Santa Claus rally” that typically happens at the end of every year, and I do not see this year being any different. Because of this, I think what we have is a scenario where every dip will be bought into, and we will eventually go looking towards the 4800 level.
The market is currently hanging around the 50 day EMA, so that will attract a lot of trading, but at the end of the day the most important thing to pay attention to here is the fact that the jobs number is coming out on Friday, and it will almost certainly cause a significant amount of volatility. The market selling off quite drastically on Friday will almost certainly be bought back into, which is typically the case with the Non-Farm Payroll Friday situation. This is because liquidity disappears, and people will find some type of narrative to start buying the dips. That is what Wall Street does, it finds reasons to go higher. Furthermore, even though the Federal Reserve is pretending like it is worried about inflation, the reality is that the first time Wall Street throws a serious tantrum, they will step in and save the banks. Because of this, it is not really a market so much as it is a bidding war to see who can push things higher over the longer term.

SPX Long SetupShould see price reacts nicely from here for some longs. May not make new daily highs but will definitely get a bullish reaction from here.

SPX500 Short SetupSPX500 Short Setup
🔵 Entry Level: $4486.0
🟢 Take Profit: $4426.9 (1.28R)
⛔ Stop Loss: $4532.1
Reasons:
- Reaching resistance level at $4485
- Expecting either divergence or highly overbought level on the PVS Indicator by the time price reaches that level.
Game plan: If the price flips this resistance into support (tests it), I may close the trade prematurely and open a long trade until the next resistance level is reached at $4548

SPX finds floating ground for nowHello everyone, as we all know the market action discounts everything :)
_________________________________Make sure to Like and Follow if you like the idea_________________________________
The S&P 500 index traded below its 50-day moving average, its first major breach in more than six months.
The S&P 500 was able to find a floating ground after teetering developer China Evergrande said it would pay some bond interest due on Thursday. Removing fears of a big and messy collapse that had scared investors.
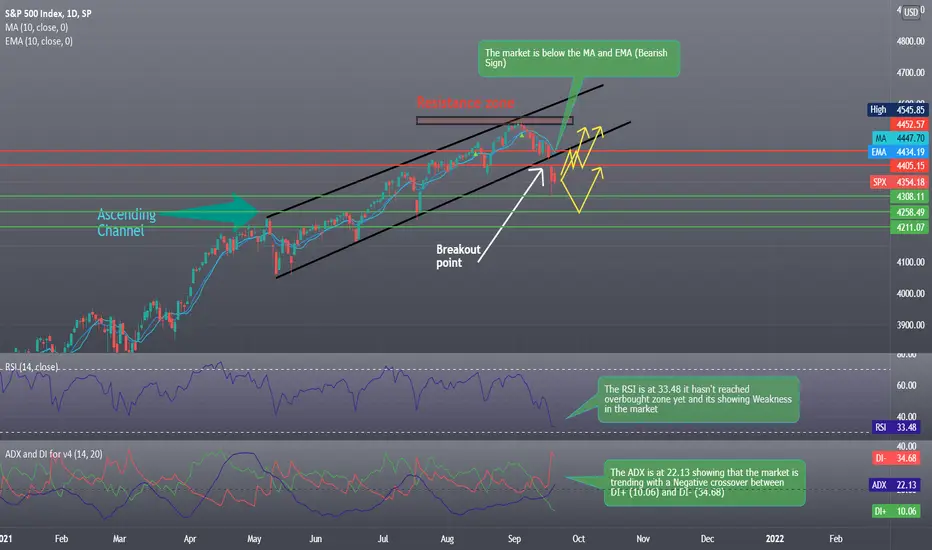
The Index price has dropped 2.6% in the last couple of days but now the market seems to be stabilizing and an increase in value might start bringing the SPX back into the Ascending Channel range.
Possible Scenarios for the market if the China situation was resolved :
Scenario 1 :
If the Bulls were able to gather the force need to gain control then we will see an increase in the market that would reach the 4452.57 resistance level where we might have a small correction that will bring the price near the 4405.15 level before the index goes back into the Ascending Channel range.
Scenario 2 :
After a drop like that it could take a bit of time for the Bulls to go in and push the market up, in that time we will see the price reach the first support level located at 4308.11 where most likely the buyers will go in, but if they failed to support that line then we might see a bigger drop reaching the 4258.49 or even the 4211.07 support before going back up.
Technical analysis show :
1) The market is below the 5 10 20 50 MA and EMA (Bearish Short-Term Trend) But still above the 100 and 200 MA and EMA (Bullish Long-Term Trend)
2) The RSI is at 33.48 it hasn't reached the overbought zone yet and its showing Weakness in the market
3) The ADX is at 22.13 showing that the market is trending with a Negative crossover between DI+ (10.06) and DI- (34.68)
Daily Support & Resistance points :
support Resistance
1) 4308.11 1) 4405.15
2) 4258.49 2) 4452.57
3) 4211.07 3) 4502.19
Weekly Support & Resistance points :
support Resistance
1) 4409.33 1) 4475.22
2) 4385.67 2) 4517.45
3) 4343.44 3) 4541.11
Fundamental point of view :
Bloomberg reports that Hengda Real Estate - the main unit of troubled Chinese property developer Evergrande - will make its Thursday bond coupon payment. This hardly means Evergrande is out of the woods - indeed a restructuring at some point still remains likely - but a disorderly unwind seems off the table at the moment.
Concerns over China Evergrande Group have put investors on edge and added to recent worries over economic growth from the Delta variant.
Persistent default fears overshadowed efforts by Evergrande's chairman to boost confidence in the firm on Tuesday, while Beijing showed no signs it would intervene to stem any effects across the global economy.
Investors are waiting for the end of this week's Fed meeting that may shed light on when its massive purchase of government debt will begin to ease. According to Reuters
This is my personal opinion done with technical analysis of the market price and research online from Fundamental Analysts and News for The Fundamental point of view, not financial advice.
If you have any questions please ask and have a great day !!
Thank you for reading.
S&P 500 : Trade plan for 23 July🕘 S&P 500 : Trade plan for 23 July🕘
Target can act as Support or Resistance,
Trade What you SEE,
Trail Profits at every target or SL at cost.

Potential Buy setup into 43951)Top-down analysis
Monthly - Previous monthly Closure, Shooting star
Weekly - Very correlated with monthly
(The momentum is very bullish in monthly and weekly)
2) Confluences
a. FIB
b.Trendline 3rd touch
c. Key level

Why SPX is bullish short term Elliot ending parallel with wave 2 and wave 4 drawn support line.
This channel top trendline is marking the end of 12 bullish years in the market. As the wave 2 of five was a throw-under of the trendline the market now need to retrace back into the channel quick.
The resistance i 4450 is heavy. Low volume will offen mean that upper trendline is not touch and hallo BEAR market. But in periodes of low volatility the market can move big time so a push up to a throw-over can happen. Summertime and drained trades combined with falling volume is toxic combo - so expect larges moves in short time frame.
But toppish 4450-4600 area and retrace to under 2000 with in one year

SPX500: double entry intraday tradeHi Traders,
This is my view on this pair for the next few days
#SPX500
Double entry (wait for evidence after NY opening)
SELL 4255
SELL 4257
SL 4262
TP 4240
I remind you that this is only a forecast based on what current data are.
Therefore the following signal will be activated only if specific rules are strictly respected.
If you follow my strategy you will be able to identify the right filters and triggers to enter correctly the market and avoid fake signals.
I really hope you liked this video and I would like to know what do you think about this analysis, so please use the comment section below this video to give me your point of view.
Thank You
———————————
Pietro from Trading Kitchen

SPX500: my multi-timeframe analysisHi Traders,
This is my long-term overview of SPX500 on a Wyckoff point of view
I remind you that this is only a forecast based on what current data are.
Therefore the following signal will be activated only if specific rules are strictly respected.
If you follow my strategy you will be able to identify the right filters and triggers to enter correctly the market and avoid fake signals.
I really hope you liked this video and I would like to know what do you think about this analysis, so please use the comment section below this video to give me your point of view.
Thank You
———————————
Pietro from Trading Kitchen

