SPX500USD 2021 Mar 29 Week
OANDA:SPX500USD
SPX500USD 2021 Mar 29 Week
Weekly / Daily / H4 = bullish
Last week's short target of 3844 not reached, as price reversed at 3856 instead.
With climatic up bar into previous resistance,
may have opportunity for short when we see toppish pattern.
3844-3856 will be the immediate support.
Entry preference will be a the SR and the yellow line price reaction zone.
Like and Follow if you find this useful : )
Have a good trading week ahead!
Spx500idea

SPX500 Short SetupSPX500 Short Setup
🔵 Entry: $3,885.0
🟢 TP & RR: $3,787.4 (1.91)
⛔ Stop Loss: $3,936.1
Trade Reasons:
✔️ Price bounced off the upper trendline
✔️ Price still ranging within the triangle
✔️ Somewhat overbought levels

SPX 50 Days MA, the line's relationship with price. (VERY OUD)The strangest thing you can notice (beside major correction, and pullback)
the more we have fake break down of the daily 50 MA the more steam we get
to the up side. VERY STRANGE RELATIONSHIP ???!!!

S&P500 Short SetupS&P500 Short Setup
🔵 Entry: $3,934.7
🟢 TP & RR: $3,903.0 (1.46)
⛔ Stop Loss: $3,956.4
Trade Reasons:
✔️ 1.618 Fib Extension
✔️ Reached previous resistance level

PULLBACKS AND CORRECTIONS 2009 TO DATESWell, the chart speaks for it self. i Might have missed one or two :-).

S&P500 Long SetupSPX500 Long Setup
🔵 Entry: $3,911.9
🟢 TP & RR: $3,954.0 (2.48)
⛔ Stop Loss: $3,894.9
REASONS FOR THE TRADE
✔️ Market Flow Indicator went green
✔️ Trade in direction of the trend
📝 Not much to analyse here aside that it's a trade based on my system. With that being said the price may drop down to the support level, where I will be looking to open a long order again.

S&P 500 Short SetupS&P 500 Short Setup
Entry: $3,864.4
TP & RR: $3,750.7 (2.22)
Stop Loss: $3,915.7
REASONS FOR THE TRADE
Not much to discuss here, aside from the fact that we are looking to open a short position at an established resistance level. This is one of those trades that it's just too obvious, so I believe a lot of traders will be stacking orders there. When/If our position gets filled, we will be monitoring it and if volume continues to increase or we pierce that level convincingly, we may close the trade prematurely and potentially open a long trade.

SPX500 quick intraday short for tomorrowHi Traders,
This is our view on this cross for the next days.
#SPX500
SELL 3834
SL 3848
TP 3820
We remind you that this is only a forecast based on what current data are.
Therefore the following signal will be activated only if the rules of our strategy are strictly respected.
Eventually, any updates will be given in the comment section below
———————————
Trading Kitchen

SPX500USD 2021 Jan 25 Week
SPX500USD 2021 Jan 25 Week
After the recent high showing supply, 2nd last bar again is a sign of weakness.
Besides, it has fallen out of channel and
If price broke 3820 and it becomes resistance
and let's see if a lower high is formed to confirm change in trend in the near term.
Resistant3 = 3927.5
Resistant2 = 3883.90 - 3894.20
Resistant1 = 3862 - 3869
Support1 = 3820 - 3833
Support2 = 3774.5 - 3784
Support3 = 3723.5 - 3728
Remember to Like and Follow if you find this useful.
Have a safe and successful trading week ahead. OANDA:SPX500USD

S&P 500 Reaches a Level of Resistance - Short TradeSPX500 - Short Position(s)
Entries: $3,784.4 / 3826.8
TP & RR: $3,728.8 (3.29 / 4.12)
Stop Loss Levels: $3,801.3 / $3,850.6
REASONS FOR THE TRADE
I think it's time for the SPX500 to take a break from this bull run. As such, I am expecting that price will reach either of the two levels that I would like to short. The Risk:Reward Ratio is favorable and the Stop Loss is just above the invalidation levels.
Now, you may be wondering why the SL of the first short is not placed higher, somewhere around the second order's SL. The problem is in the Risk:Rewards Ratio. If I am to do that, I will need to adjust my position size to account for the bigger gap between entry and SL. Also, the RRR of 3.29 will fall down to 0.84. So, even if I short from the first level and the setup proves to be valid, I will increase my capital by less than 1%, compared to over 3% if I keep the trade as it is.
Even if the first setup is invalidated, and we open a profitable short on the second level, the profit of 4.12R will compensate for the 1R loss and we will be at a profit of 3.12R. Of course, it would be unpleasant to lose 1% of the account, but that's just how trading works. You either take the risk or you lose the chance.
On a side note, since it's Monday, I am not placing those as limit orders, rather I have set alerts at the levels. When we reach them I will look at the volume, the 1h candle close, and will update the idea. We don't want to blindly place orders and hope for the best.

S&P 500 FUTURES 1D-TIMEFRAME ANALYSIS✨S&P 500 1D-TIMEFRAME ANALYSIS✨
Hello ladies and gentlemen
This is my new idea for the SPX500
My idea is that the index will go higher
T1
4500
I hope my idea is clear
Support me by like and share
Stay Safe💯
Good luck💰

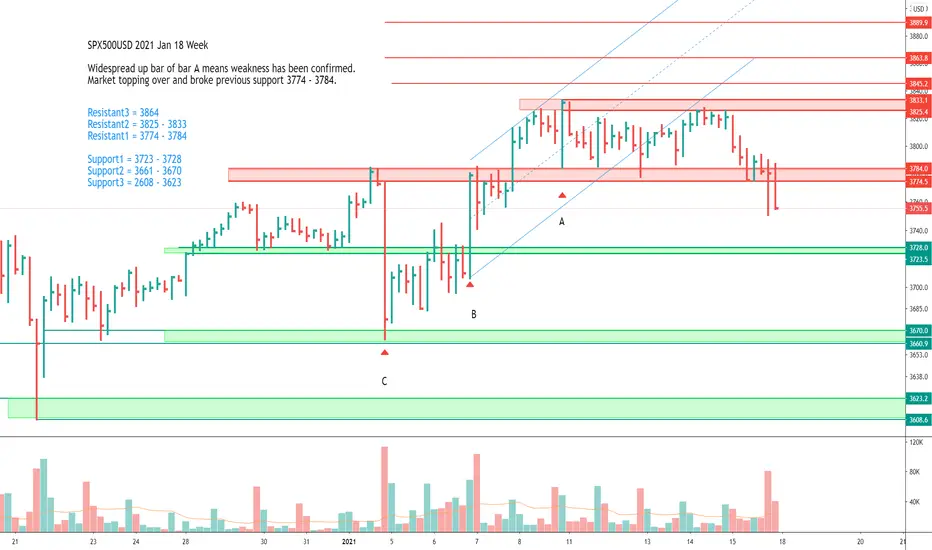
SPX500USD 2021 Jan 18 Week
SPX500USD 2021 Jan 18 Week
Widespread up bar of bar A means weakness has been confirmed.
Market topping over and broke previous support 3774 - 3784.
Resistant3 = 3864
Resistant2 = 3825 - 3833
Resistant1 = 3774 - 3784
Support1 = 3723 - 3728
Support2 = 3661 - 3670
Support3 = 2608 - 3623
Like and Follow if you find this useful : )
S&P 500 Long PositionS&P 500 Long Trade
Entry: $3,807.4
TP & RR: $3,871.4 (2.29)
Stop Loss: $3,779.5
REASONS FOR THE TRADE
Building upon yesterday's SPX500 trade on which we got stopped out, I am once again trying to catch a bounce up from the lower trendline in a channel.
This time the SL is set much lower and I am not a big fan of having such a wide distance, but I don't want to get stopped again.


SPX500/S&P500 ( DONT MISS THIS)here is SPX500 a.k.a S&P500 , we can see that price is moving respecting a bullish channel in 30 min, Then price has already tested the support of the channel, from here we are looking for buying in order for the price to test the upper boundary of the channel ( BUY AFTER RETEST)

SPX500 Within a Channel - 2 Possible LongsSPX500 Long Setup Idea
Entry Levels:
1) $3,785.7
2) $3,764.8
TP & RR: $3,870.7 (4.89 and 5.71)
Stop Loss Levels:
1) $3,768.3
2) $3,746.1
REASONS FOR THE TRADE
SPX500 may be due for a small correction and I want to catch the indicated level, which is a flip from resistance to support. I believe it should hold well, but what I am really looking for is a quick, clean wick to the entry or worst-case scenario a close and then a quick trend up. If the price closes under that level, then the trade will be invalidated and I will be looking to open the second long order with an even better Risk : Reward. I will also be looking at the Trend Volume RSI Analysis and what it prints in terms of trend and divergences.

SPX's Daily Purchase/Sale filing for directors/officers ***The legendary Fidelity Investments manager Peter Lynch once said, "Insiders might sell their shares for any number of reasons, but they buy them for only one: they think the price will rise.” this guys is just simply smart.
***Beautiful data presented here very useful for long investors . Simple strategy, with every consideration you would usually take , just buy after these guys start buying : -) .
***No success rate here, just extremes reading here that's all
*** I wish Tradingview would add this to their indicators.
-------------------------------------------
***Trigger line to start watching for, for buying, is reading above 300:
-----------------------------------------
Date Reading
Mar, 16 2020 465
Aug, 10 2011 357
Mar, 10 2009 356
Dec, 1 2008 302
Nov, 28 2008 606
Oct, 14 2008 306
Nov, 13 2007 307
Nov, 20 2007 329
Aug, 6 2007 303
-----------------------------------------------------------------
***Trigger line to start watching for, for buying, reading between 200-300 :
------------------------------------------------
March 2, 2020 207
Dec, 11-26 2018 204*217* 229*220*226
Nov, 21 2018 215
Nov, 13 2018 250
Nov, 14 2016 217
Nov, 12 2015 202
Aug, 24 2015 239
Nov, 13 2012 220
Nov 12, 2009 204
Aug, 17 2007 295
May 11, 2004 212
May, 4 2004 216
----------------------------------------------------
***Selling reading above 400 are reflected here Red Arrows

SPX500 and a NICE BUY-CHANCE!Hey tradomaniacs,
SPX500 could move up 👉
Todays sell-off pushed price down into a price-zone with possible bullish confluence.
Primary Trendline pls horizontal support-zone can be a very attractive zone for buyers as soon as we see a confirmed rejection.
In terms of correlations a perfect match with the GAP-CLOSE of DXY (US-DOLLAR).
LEAVE A LIKE AND A COMMENT - I appreciate every support! =)
Peace and good trades
Irasor
Wanna see more? Don`t forget to follow me.

SPX500 could PUMP again!Hey tradomaniacs,
After a re-test of the current trendline and key-support-zone we could see another bounce upwards in order to complete the impulse-wave-pattern.
Price-Action showing demand at this zone and so higher bullish confluence.
A pump today could be important for pairs such as NZD/USD, AUD/CHF and NZD/JPY to break their key-resistance-levels.
Since price and spread can vary for this assets I don`t make an call with exact Entries.
LEAVE A LIKE AND A COMMENT - I appreciate every support! =)
Peace and good trades
Irasor
Wanna see more? Don`t forget to follow me.
Any questions? PM me. :-)

SPX BREAK DOWN BULLS & BEARS WHAT DO YOU THINK ?YOU NEED THIS PRINTED AND HANGED INFRONTE OF YOU.
WISH YOU ALL THE BEST.

S&P500 ShortIf the daily candle closes below the upper trend line we would like to short with confirmed price action on lower timeframes.


S&P 500 Long Setup!I think we will have one more leg up at least before the election. If you find this useful please leave a like I would appreciate it :)
