NDX & SPX , Stay heavy on positionsNDX & SPX , Stay heavy on positions (QLD, TQQQ)
Market sentiment is currently tilted toward betting on downside volatility, which ironically supports the case for the stock market to continue its upward trend.
Spx500long
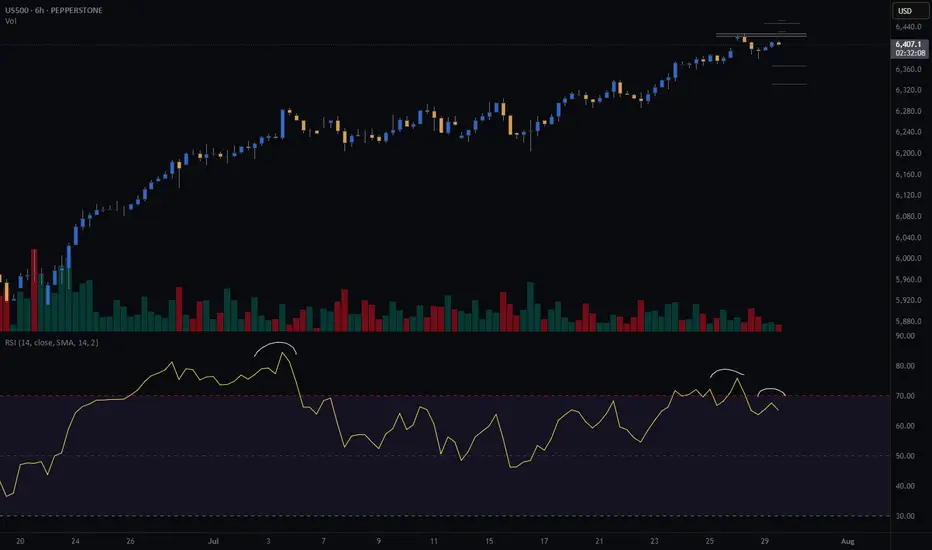
S&P500 (CASH500) SHORT - Double top H6Risk/reward = 3.7
Entry price = 6432.6
Stop loss price = 6 454.1
Take profit level 1 (50%) = 6367.7
Take profit level 2 (50%) = 6332.6
Still need confirmation from some variables before entering the trade
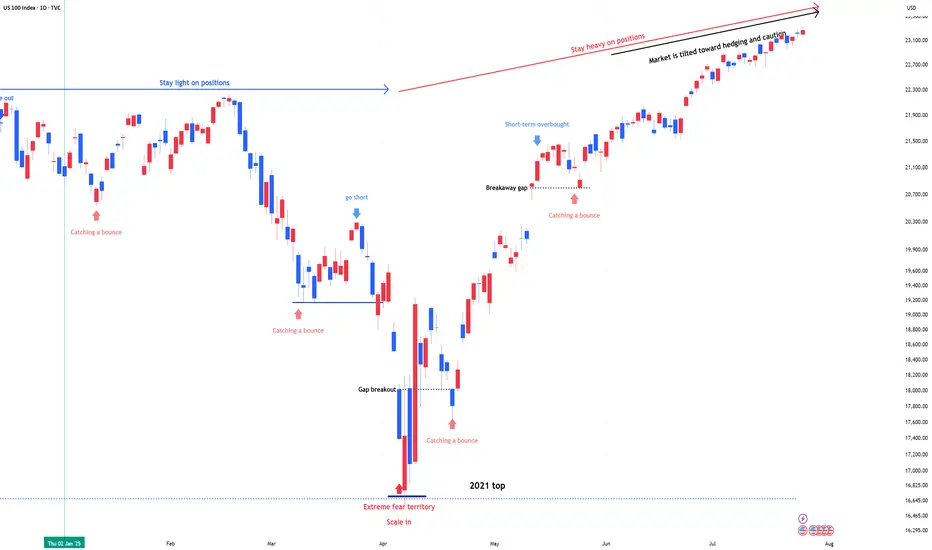
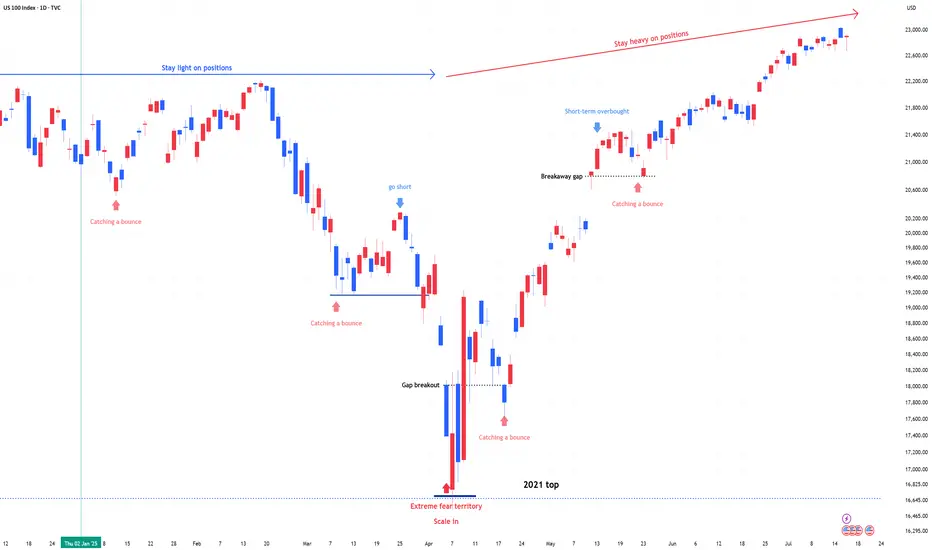
US 100 (NDQ) : Stay Heavy on Positions1) April Fear & Buy Signals
In early April, the Nasdaq 100 experienced a sharp sell-off, triggering extreme fear sentiment across the market.
At that point, scale-in buy signals appeared—classic "buy the fear" conditions.
2) Current Market State: No More Fear, but Watching
Since then, the market has stabilized.
The fear has disappeared, but we are still in a wait-and-see mode as traders assess the next move.
Momentum is holding, but participation remains cautious.
3) Stay Heavy on Positions
Despite short-term uncertainty, I’m maintaining an overweight position on the Nasdaq 100.
As long as we don’t see a major breakdown, the bias remains bullish.
SPX500 Update: Monster Trigger Ready to Launch!Welcome back, traders, it’s Skeptic from Skeptic Lab! 😎 With news of the unemployment rate rising, stock and crypto markets have been surging hard, and right now, we’ve got a killer trigger on SPX500 you don’t want to miss. Its breakout could spark the next major bullish leg. Let’s dive into the Daily and 4-hour timeframes to unpack this setup. here’s the play:
✔️ Daily Timeframe:
After a strong rally, SPX500 hit an all-time high (ATH) at 5,249.14 before entering a deep correction. Here’s what many traders miss: support/resistance levels aren’t static—they shift over time. The resistance that was at 6,146.89 has now climbed to 6,290. Breaking 6,290 signals the start of a major bullish trend after 146 days of correction. This is our primary long trigger.
📊 4-Hour Timeframe (Futures Triggers):
Long Trigger: After a solid uptrend with strong momentum, we entered a time-based correction within a box pattern. Breaking the box ceiling at 6,290 is the long trigger, aligning with the Daily breakout.
Short Trigger: Breaking the box floor would trigger a short, but this goes against the trend, so stop-loss risk is higher, and your win rate could take a hit—stay cautious.
📉 Key Insight: The 6,290 breakout is the big move to watch, fueled by market momentum from the unemployment news. Shorts are riskier due to the bullish trend, so prioritize longs with volume confirmation.
🔔 Confirmation: For longs, confirm the 6,290 break with RSI entering overbought.Risk management is critical—cap risk at 1%–2% per trade to survive the market’s swings.
🔼 I’ll update if the structure shifts! Thanks for vibing with this analysis! <3
💬 Let’s Talk!
Which SPX500 trigger are you locked on? Hit the comments, and let’s crush it together! 😊 If this update lit your fire, smash that boost—it fuels my mission! ✌️

S&P500: Target Zone DeactivatedThe S&P 500 extended its bullish trend yesterday, moving beyond our now-deactivated (formerly magenta) Target Zone. Existing positions remain intact, as the stop set 1% above the upper boundary has not been triggered. In our updated primary scenario, we anticipate continued upward movement within magenta wave (B), potentially reaching the resistance at 6675 points. Once this peak is established, we expect a corrective decline to begin in the form of wave (C), which should guide the index into the green Long Target Zone between 4988 and 4763 points. There, the larger green wave is expected to complete. A sustained breakout above the 6675-point level would shift the outlook in favor of the alternative scenario. In that case, green wave alt. would be considered complete—a trajectory we currently assign a probability of 40%.
📈 Over 190 precise analyses, clear entry points, and defined Target Zones - that's what we do.

SPX'S BULLS !6200 Will get touched easily soon !
because the much vol up there waiting to be hunted at 6100+
𓄀𝓈𝓉𝒶𝓎 𝓉𝓊𝓃ℯ𝒹 𓃓

Skeptic | SPX 500 Analysis: Long Triggers Ready to Rip!Hey, what’s good? It’s Skeptic! 😎 Last week, we scored a nice R/R on SPX 500, and now it’s looking ready for another big move, super close to our long trigger. Let’s check it out with a multi-timeframe breakdown to grab those long and short triggers!
Daily Timeframe: The Big View
The SPX was riding a strong bullish wave, then hit a deep correction. Here’s what’s up:
It’s bounced back most of that drop and is nearing its ceiling at 6128.55. 🏔️
A break and hold above 6128.55 could kick the bullish trend into high gear, per Dow Theory.
Watch the daily RSI—if it goes overbought, we might see a fast, big rally. 🚀
This is our long-term play, so let’s zoom in for the short-term action!
4-Hour Timeframe: Long & Short Triggers
On the 4-hour chart, here’s the plan for our trades:
Long Trigger: Break above 5990.67, with RSI above 66.57 to show the move’s got juice.
Stop Loss: Your choice—put it below 5955.77, or check 1H or 15-minute charts for a tighter stop under the last low. 🎯
Short Trigger: A drop below 5856.93 lets you short, but it’s against the trend, so keep it low-risk. Take profits quick, use a small stop loss, and close when you hit a good R/R. ⚠️
Shorts are tricky here, so play it safe and don’t go all-in!
RSI Trick & Your Input
Love RSI? I’ve been using it forever, and I think most guides get it wrong. They say overbought RSI means sell, but for me, it’s a go sign for longs! Want a full RSI tutorial? Tell me in the comments, and I’ll hook you up! 📢
💬 Let’s Talk!
If this got you hyped, hit that boost—it helps a ton! 😊 Got another pair or setup you want me to hit? Drop it in the comments. Thanks for chilling with me—keep trading smart! ✌️

Something Brewing on SPXCup and handle brewing on the SPX daily. All time highs are near. See you there before the pullback

SPX week & month review 5/30/25Intrigued by today as we closed the month and week. The charts appear bullish until something changes that. Key points I noticed...
*Monthly morning star pattern
*RSI above 50 on month and week chart
*MACD over zero line and signal up on month and week chart
*Key levels holding up (21 ema, FVGs)
We are still in volatile times and narratives are being thrown all over the place. Do you see what I see? Enjoy your weekend.

Skeptic | SPX 500 Update: Bullish Breakout Brewing?Hey everyone, Skeptic here! It’s been a while since we’ve checked in on the SPX 500 , but the market’s now flashing a killer long opportunity with a high R/R—don’t miss this one! 😊 Stay with me to the end for the full breakdown. Let’s dive into the Daily Timeframe to set the stage. 📊
Daily Timeframe: The Big Picture
The SPX 500 pulled off a deep correction , dropping from a high of 6154.64 to lows around 4810.39 with some wild shadows that caught everyone off guard. But now, it’s firing up with fresh momentum, carving out higher highs and higher lows that scream bullish strength. The corrections in this new uptrend are super shallow and flow with the trend—exactly what we want to see! After hitting resistance at 5961.82 , we’ve had a slight pullback, but it looks like this correction is wrapping up, and we’re on the verge of the next big uptrend leg. Let’s zoom into the 4-Hour Timeframe to hunt for long and short triggers.
4-Hour Timeframe: Long & Short Setups
On the 4-hour chart, the correction shaped up as a descending trendline . We broke it, pulled back, and now we’re primed to crack 5895.39. A breakout above this level is our main long trigger. To get more precise, let’s check the 1-Hour Timeframe.
For the long setup , a clean break above 5896.34 gets us in the game. This move also busts through P.P. Level 1, giving us solid confirmation, and we could ride the wave up to P.P. Levels 3 or 4, targeting 5930.83 to 5956.97 . Those are prime spots to lock in some profits, but don’t close the whole position—since we’re trading with the trend, we can hold for more upside. For shorts, I’ve got nothing. Going against this bullish momentum would be pure madness! I’d wait for a sharp drop below support at 5849.67 before even considering short triggers, but right now, there’s zilch.
💬 Let’s Talk!
If this update sparked some ideas, give it a quick boost—it means a lot! 😊 Got a pair or setup you want me to tackle next? Drop it in the comments. Thanks for hanging out— let’s grow together and remember: Weathermen forecast. We trade! :))) ✌️

Spx500usdThere u go by decimals, almost there,
Here you go, it might be in bull today, I just hope so
Keep Ur own trades safe guy and DYOR
Do always Your Own Reseach

Spx500usd up? 1min chart at 23h London time?As it is , all I hope is that spx 500usd starts here at that blue line, after all, if it starts at the blue line the stock as might be up again, I'm not into the fundamentals by this time, I'm just making some Elliot and indicators-some mine, others don't, and trend analysis
Hope u guys all in profit
After all we all looking for the same
Keep Ur trades safe
And Do Always Your Own Research
DAYOR
Keep it safe
This my my graph at 1min candles, returned to 15min chart
Keep it safe.
And keep cool.

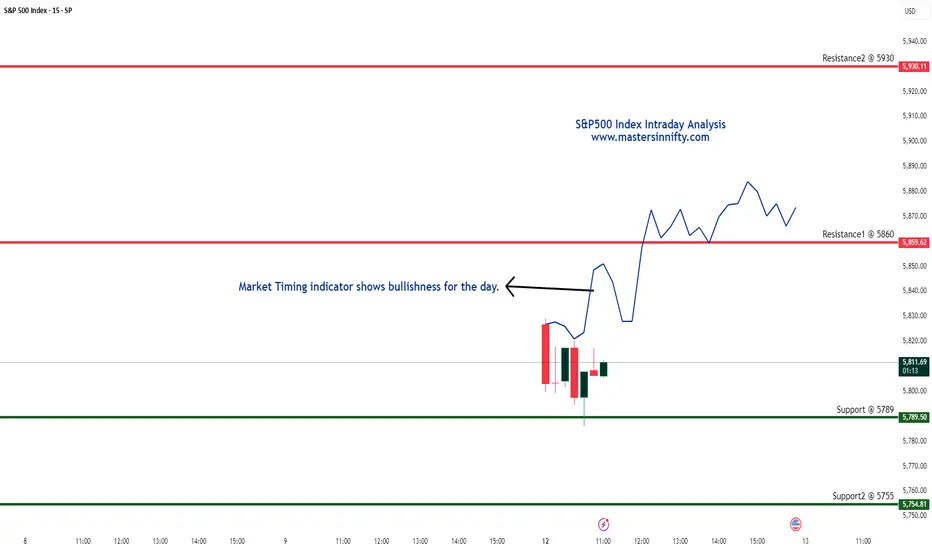
S&P500 Index Intraday Trend Analysis for May 12, 2025The S&P 500 Index is displaying bullish indications for the day. Key support levels are observed at 5789 and 5755, while resistance is expected around 5860 and 5930.
Please note, this is solely my personal view. Traders are advised to conduct their own technical analysis and ensure proper risk management before making any trading decisions.
STOCKS | MARKET WATCH | Why Long-Term Investing Still Wins🤯 The start of 2025 was a bit of a rollercoaster for stocks.
Global markets got seriously rattled in the first few months by some sudden jitters. When President Trump announced those aggressive tariffs, it caused significant concern among investors, sending stock markets tumbling and prompting a flight to safety. Like Reuters said, April was "epic" for crazy market swings – the VIX fear index shot up to levels we hadn't seen since 2020 and 2008, and then just as quickly dropped back down. Markets went wild.
But then, by late April, the panic kind of ... disappeared. Once President Trump paused the implementation of the most severe tariffs, stocks bounced back pretty sharply. The S&P 500 recovered most of what it lost. After that nasty drop, it ended April only about 5% lower than it started the year. The Nasdaq, with all its tech stocks, pretty much ended the month where it began. So, after all that drama, major US stock markets weren't far from their all-time highs, showing how fast that "fear" can vanish.
📊 How key indexes did
S&P 500 (USA): 📉 Dipped in early April but bounced back late. Ended April around -5% for the year, after almost hitting a bear market.
Nasdaq Composite (USA): 📉 Similar story. Tanked on the tariff scare, then rallied when things calmed down, ending April pretty much flat for the year.
MSCI World (Global developed markets): 🤷♂️ Had its ups and downs along with the US markets. By the end of April, it was pretty much flat for the year – no big moves for the overall world index.
MSCI Emerging Markets: 📉 Didn't do as well as developed markets. Asian stocks, especially, took a hit early April because of trade war worries, so this index lagged, even though it recovered a bit by the end of the month.
FTSE/JSE All-Share (South Africa): 🇿🇦 The odd one out! The JSE jumped about +5% in the first three months of 2025, mainly thanks to mining stocks. It even hit a record high in March. The April craziness shook it up too, but because it did so well earlier, it was still slightly up for the year by late April.
Takeaway? Global stocks were jumpy, but they mostly recovered. By late April, most major indexes were close to where they started the year. South Africa's market was the exception, having a good first quarter that helped it weather the April storm.
⏳ Staying invested beats trying to be a stock Wizard
All this back and forth can make investors nervous. You start thinking, "Should I just sell now before it drops even more?" But history usually says that's the wrong move. Just sticking with it usually works out better than trying to guess the market's next move. BlackRock's iShares recently pointed out that "waiting for the 'right time' to invest might mean missing out on the best days," while staying invested lets you benefit from that "compounding" thing and get through the short-term bumps. Simply put, if you sit on the sidelines during big swings, you often miss the big rebound days. One study even showed that if you missed just the five best market days over 20 years, you'd end up with way less money than someone who just stayed in the market.
The legendary investor Charlie Munger put it simply: "The first rule of compounding: never interrupt it unnecessarily." Trying to jump in and out of the market around all the volatility is super tough – the biggest up days often follow right after the biggest down days. On the other hand, patient investors who just ride out the noise tend to grab more of those long-term gains. After all, with compounding, those small gains build on each other over time.
💰 The awesome power of compounding over time
Compounding basically means the sooner you invest and the longer you stay invested, the more your returns build on each other like a snowball rolling downhill. For example, the total return JSE All-Share index was up almost 23% over the last year. That kind of gain shows how just staying invested during good times can really grow your wealth. If you'd panicked and pulled out, you would have missed most of that growth. Over longer periods, like 5 to 10 years, the JSE has almost always gone up. The big lesson is that it's about "time in the market," not trying to "time the market," that really makes your returns grow and smooths out those bumps along the way.
🌍 What's driving the markets and the economy
There were a few big things happening that explain why the markets moved the way they did.
🇺🇸 US GDP Slowdown: The US economy actually shrank a bit in the first quarter of 2025. A lot of people blamed this on a big surge in imports as businesses bought stuff ahead of those potential President Trump tariffs. Even though this news spooked the stock market briefly in late April, underlying consumer spending was still looking pretty decent.
📈 US Company Profits: On the bright side, US companies reported some pretty strong profits. Analysts were expecting good growth in earnings for the S&P 500 in the first quarter, even with the economic slowdown. And it turned out even better – a lot of companies beat expectations, and overall earnings were up quite a bit from last year. This helped keep stock prices from falling too much during the pullbacks.
🇪🇺 European Spending Boost: In Europe, governments are starting to spend more. Germany, for example, proposed a huge fund for infrastructure and energy. The EU is also loosening its spending rules and increasing defense budgets. Some experts think this could actually boost Europe's economic growth a bit each year, which would mean better profits for European companies. Some even think European companies might see faster profit growth than US companies in the next few years because of this spending.
🇨🇳 Asia and Trade Wars: Asia was the weak spot. China's economy showed some signs of trouble, with a survey suggesting its manufacturing activity might have shrunk in April after a couple of months of growth. This seemed to be a direct result of the US tariffs. Asian stock markets took a hit on the tariff news, which dragged down the overall emerging markets index. Basically, tariffs and trade tensions hurt growth in Asia and its markets, which then affected returns in emerging markets globally.
✅ The bottom line
Early 2025 reminded us that markets can freak out quickly – but they can often bounce back just as fast. The swings felt scary, but history tells us that just sticking with your investments usually pays off. Major stock markets are pretty much where they were a few months ago, while economies and company earnings are still moving forward. For long-term investors, that wild week in April just reinforced an old lesson: stay invested and let compounding do its thing. As some experts say, "get invested and stay invested" because the most volatile times often have the biggest market gains. By sticking to your plan, you avoid missing those big up days when the "fear" fades and markets recover.
_________________________
SP:SPX
Sources: Recent market reports and data including the April SATRIX 2025 market newsletter “Once Again, Volatility Blinked and Fear Lost., nasdaq.com, reuters.com, ishares.com, insight.factset.com, reuters.com, iol.co.za

S&P 500 Bearish Reversal Setup: Short Entry Below Key ResistanceEntry Point: Around 5,678.79
Stop Loss: Around 5,833.61 (above recent resistance zone)
Target Point: Around 4,831.37 (indicating a bearish target)
2. Technical Patterns:
The price hit a resistance zone (highlighted in purple) and reversed—this is often a bearish signal.
The trendline break (marked with the orange dot and blue arrow down) suggests a potential trend reversal.
The moving averages (likely 50 EMA and 200 EMA) indicate the price is still above the support zone but weakening.
3. Risk/Reward Ratio:
Risk (Stop Loss – Entry): ~154.82 points
Reward (Entry – Target): ~847.42 points
Risk/Reward Ratio: Approximately 1:5.5, which is favorable for shorting.
4. Trade Sentiment:
Bearish bias based on the breakdown from the resistance zone and confirmation from chart patterns.
If the price fails to hold above 5,682.87, a short trade may be validated with the target at 4,831.37.

S&P 500 records 9 days of gains, longest streak in 20 years🚨S&P 500 records 9th consecutive day of gains, the longest winning streak in over 20 years..
🚨
MartyBoots here , I have been trading for 17 years and sharing my thoughts on ETH here.
SP:SPX
Watch video for more details

Hurst's 4.5 Year cycles is in "Time wise"=Trough is close or notHurst's Cyclic Theory:
The basic tenant behind this theory is that markets achieve significant lows (or troughs) at the beginning (or end) of a cycle. Cycles have varying degrees based on wave length (in time) and are harmonized with the higher level cycles.
- Blue is 4.5 starting the day of the IPO !!!

UBER Long Breakout Play | 4H ChartUber Technologies Inc. (UBER) just broke out of a long-standing descending trendline, confirming a bullish structural shift.
Entry: $79.43
SL: $70.45
TP: $86.93
R:R : 1:1.8
Technical Highlights
• Clean breakout above descending trendline and horizontal resistance at $77.35
• Retest and hold above previous resistance confirms bullish strength
• Strong bullish momentum and candle close above key levels
• Targeting the next major resistance zone near $87
Bias
Bullish continuation as long as $77.35 holds as support.
Plan
Trail stop if price sustains above $82. Look for volume confirmation on breakout retest.

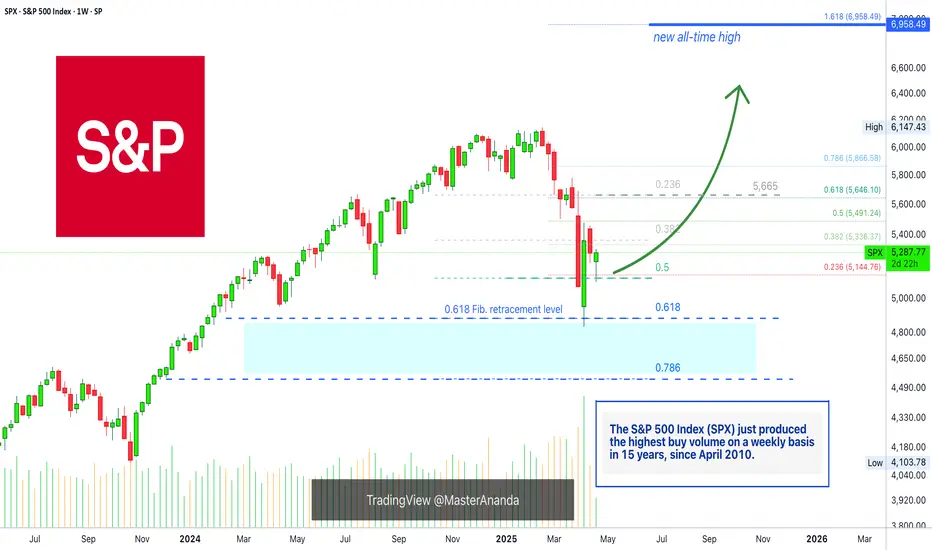
The SPX On Track To A New All-Time High In 2025 (6,958— Soon!)Do not let anybody distract you, do not allow yourself to be deceived. Know that the market is very resilient and this has been true for the longest time ever. The catastrophe that everybody is always expecting and is always due is never true. Ok, there was a correction, but that's it, from now on the market grows. That's just how it works.
Very, very strong bull markets, and the bear markets weak and short.
The S&P 500 Index (SPX) looks great right now and nothing can surpass the wisdom that comes from a chart. A chart cannot lie nor can mislead you in any way.
The charts have pure raw data, you can make your own interpretation of this data but there are no mistakes.
Here the chart shows a very strong higher low. The 0.5 Fib. retracement level was tested and it holds. Now, saying a "new All-Time High" might be speculation, but saying that prices will rise is simply how technical analysis works.
A low first pierced 0.5 and challenged 0.618 fib. The candle closed above and full green, the highest volume since 2010 and that is a clear signal that the correction reached its end.
The SPX is bullish now of course.
The next week we get a red week and this led to the present day, a higher low. A higher low is bullish and notice, the 0.618 level is no longer relevant. The correction that happened was really strong, there is absolutely no need for more.
So a strong correction developed and what comes next?
Prepare for a major rise, a new impulsive bullish wave.
The minimum target starts at 5,665. This is the resistance where the drop got started, this level needs to be tested based on TA. Depending on how this level is handled, we can extract how the market will continue to behave.
» I will make a prediction, the SPX will hit a new All-Time High in the coming months.
Thank you for reading.
Namaste.
S&P500 Index Intraday Trend Analysis for April 22, 2025Intraday Trend is Bullish with Resistance1 @ 5410 and Resistance2 @ 5507. Market Timing tool is bullish for the day and other indicators are in the green. Overall the S&P500 Index intraday trend is Bullish.
This is my view but not a recommendation to buy or sell. Traders are advised to do their own technical study before entering into the trade with proper risk management.

S&P 500 Pullback Nearing End? Hammer + Elliott Wave Say Rebound!The S&P 500 Index ( FOREXCOM:SPX500 ) is one of the most important indexes in the financial market these days , with the cryptocurrency market and especially Bitcoin ( BINANCE:BTCUSDT ) having a strong correlation with this index .
After Donald Trump suspended tariffs on 90 countries (except China) , the S&P 500 Index started to rise and seems to have managed to break through the Resistance zone($5,284-$5,094) and is pulling back to this zone .
One of the signs of a reversa l of the S&P 500 Index can be the formation of the Hammer Candlestick Pattern , which announces the end of the pullback .
In terms of Elliott Wave theory , it seems that the S&P 500 Index is completing a corrective wave that could be in the form of a main wave 4 ( it is correcting both in time and price ).
I expect the S&P 500 Index to resume its upward trend in the coming hours, if nothing special is released , and to reach the Resistance zone($5,680-$5,500) and Yearly Pivot Point . If this happens, today's Bitcoin analysis could also be correct .
Note: In the worst case, if the S&P 500 Index touches $5,050, we should expect a further decline in the S&P 500 Index and Bitcoin.
Do you think the S&P 500 Index will return to an upward trend, or is this increase temporary?
Please respect each other's ideas and express them politely if you agree or disagree.
S&P 500 Index Analyze (SPX500USD),1-hour time frame.
Be sure to follow the updated ideas.
Do not forget to put a Stop loss for your positions (For every position you want to open).
Please follow your strategy and updates; this is just my Idea, and I will gladly see your ideas in this post.
Please do not forget the ✅' like '✅ button 🙏😊 & Share it with your friends; thanks, and Trade safe.

S&P to find buyers at current market price?US500 - Intraday
Closed the day little net changed.
An overnight negative theme in Equities has led to a lower open this morning.
Immediate signals are hard to interpret.
Bespoke resistance is located at 5853.
Bespoke support is located at 5536.
Dips continue to attract buyers.
We look to Buy at 5609 (stop at 5572)
Our profit targets will be 5719 and 5853
Resistance: 5719 / 5737 / 5853
Support: 5616 / 5607 / 5536
Risk Disclaimer
The trade ideas beyond this page are for informational purposes only and do not constitute investment advice or a solicitation to trade. This information is provided by Signal Centre, a third-party unaffiliated with OANDA, and is intended for general circulation only. OANDA does not guarantee the accuracy of this information and assumes no responsibilities for the information provided by the third party. The information does not take into account the specific investment objectives, financial situation, or particular needs of any particular person. You should take into account your specific investment objectives, financial situation, and particular needs before making a commitment to trade, including seeking advice from an independent financial adviser regarding the suitability of the investment, under a separate engagement, as you deem fit.
You accept that you assume all risks in independently viewing the contents and selecting a chosen strategy.
Where the research is distributed in Singapore to a person who is not an Accredited Investor, Expert Investor or an Institutional Investor, Oanda Asia Pacific Pte Ltd (“OAP“) accepts legal responsibility for the contents of the report to such persons only to the extent required by law. Singapore customers should contact OAP at 6579 8289 for matters arising from, or in connection with, the information/research distributed.

S&P 500: The Correction Is Not Over Yet – Targets Around 5000At the moment, the S&P 500 is holding relatively stable, but I believe the current decline is just part of a larger correction following decades of growth.
Right now, the index is retracing to the 50% pullback area (marked on the chart), which aligns with a typical retest before a potential continuation of the downward move. In this zone, a manipulation is likely, after which the decline may resume.
An additional confirmation of this scenario is the unfilled gap below, which remains uncovered. Historically, the market tends to close such gaps. Moreover, there are untested price levels lower on the chart, suggesting a high probability of further downside movement, with targets around 5000 points.
I will keep monitoring the situation and update my outlook as new data emerges.
