SPX500 LONG IDEAPrice has broken channel down pattern, if consolidate above the resistance zone there is a huge potential upwards.
Spx500long

SPX Trading TodayIt is important to take note of the indecision and slight downside bias that is retained in the market.
This is the reason for the fall and stall and it is why you should give caution to longs you are taking. We are at Key support levels + Tech confluence, but we are also wary of where to market may fall to based and price action rules.
Trade Lightly at the current and below long zone(s).

S&P 500 See, according to the existing page, our external harmonic bat pattern enters the fall from 4632 to 3875
*******
Fibonacci says we may have a 50% return, maybe up to 38 Fibonacci and sometimes 23 Fionachi will go back.
*******
We now see 4 strong downward contexts
******
But this 200 pp rise does not mean that stocks are rising
*******
With this situation, the news that indicates inflation in the world and traders are going all the way to gold.
********
I hope you are not fooled by HFT institutions in transactions
***********
We are the market fuel, so let 4500 be completed and the market trend be determined

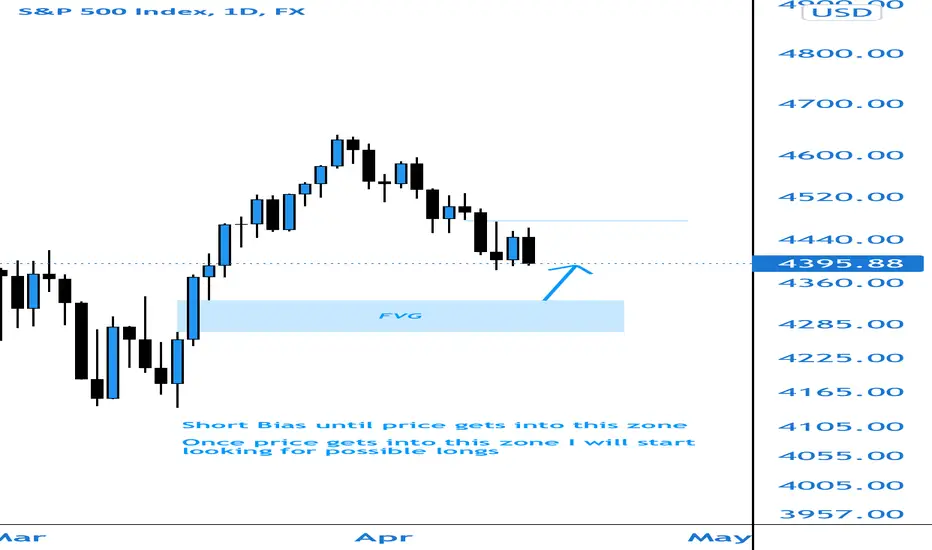
Spx500 Weekly OutlookShould start this week with 2 or 3 bearish days until we get into the FVG. From here we can look to take longs as a reaction from it being filled. Not sure if it will switch bullish but should get a good push up from there at the very least.
Goodluck this week and feel free to leave your opinion below!
SPX heading to 4660 rangeExpecting for the price to hit this price range shown on the chart and a little retrace..
Bigger time frame shows, it will go LONG for a while...
It is still a bullish pattern on Weekly time frame.. Still has not crossed the bearish mark...
Expecting Monday to be a GREEN DAY and GREEN WEEK ..overall..
_____________________________________________________________________________________________
Ecclesiastes 5:10 ESV
He who loves money will not be satisfied with money, nor he who loves wealth with his income; this also is vanity.
Hebrews 13:16
Do not neglect to do good and to share what you have, for such sacrifices are pleasing to God.

SPX Long zonesThe SPX is resting upon some very early support. Long zones lower are much more preferable..
For that, you will need some PATIENCE..

SXP500 Index: It flies like a brick!Today we are here to talk about the SXP500 index.
Today: The index is trading at 4588. We saw a sideways trade in the last trading session. Which was expected, here is a link to the idea.
What's on the market now:
The market is in a phase of uncertainty and many players are looking for the beginning of a new trend, but there is no clarity. The market is accumulating energy for a sharp exit. Our main task for today is to continue protecting positions from 4450. And wait for the market to move towards the target zone of 4550.
What are we waiting for today:
We are waiting for a market reversal attempt to move towards the 4550 level. However, if the reversal attempt fails, then the market will go to 4330 and open new levels for buying from 4330.
What I recommend:
If you want to open short:
You can open a short position above 45 50 (limiting risks) speculative exit.
If you want to buy:
It is better to refuse from purchases, a sharp price movement to the 44 00 zone is possible
Please don't forget to like. This greatly motivates me to share my trading ideas and market knowledge.
Also take a look at my profile where you will find the full history of trading every day on the SPX 500. Contact me in 1 or 2 days for further trading advice.
I hope these tips were helpful to you, let me know in the comments below. don't forget to subscribe to my channel.
I post SPX 500 analytics every day, so check back tomorrow!
See you next time,
Bye!

SPX S&P500 inverse Head and Shoulders patternSPX S&P500 is looking bearish for now.
I think we might see an inverse head and shoulder chart pattern before closing higher this year.
Looking forward to read your opinion about it.

SP500. TURNED UPSP500 TURNED UP - it's a matter of time, we can leave the current price, we can from a level that is lower, so everything is going according to plan, the way up for bitcoin is open.

SXP500 Index: Fell and pulled out? Today we are here to talk about the SXP 500 index.
Today: The index is trading at 4581. In the last trading session, we saw movement to the target zone, which is what we expected. Here is a link to the idea.
What's on the market now:
The market is in the phase of exit from the correction. This is evidenced by the volume of trade. Our main task today is to protect positions if they were opened yesterday from the level of 4450. Also, the market still has the possibility of moving towards 47 50.
What are we waiting for today:
We are waiting for the price to stabilize and are trying to reverse the market to move towards the level of 4525. However, if the attempt to reverse is not successful, the market will go to 4330 and open new levels for purchases from 43 90.
What I recommend:
If you want short:
Opening short positions is already risky. It had to be done from 45 85.
If you want to buy:
The local minimum for buying at the level of 44 50 was yesterday, and today you need to protect your long positions, limit risks at least at the last local minimum.
Next purchase prices 43 90-44 30.
And yes, please don't forget to like this greatly motivates me to share my trading ideas and market knowledge.
Also check out my profile for a full daily trading history on the SPX 500. Contact me in 1 or 2 days for further trading advice.
I hope these tips were helpful to you, let me know in the comments below and don't forget to subscribe to my channel.
I post selected SPX 500 reviews every day, so check back tomorrow!
See you next time!
Bye!

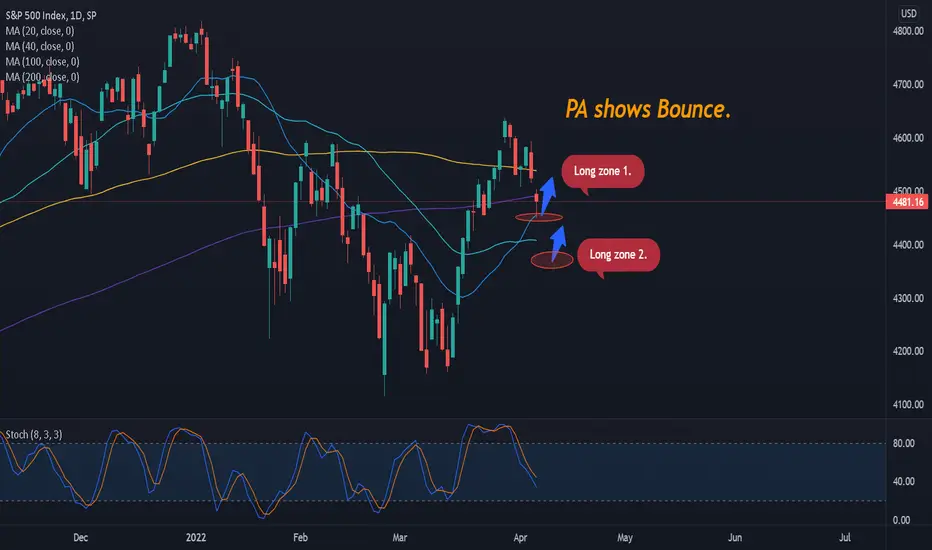
SPX Long zone TradingAs you will know from my recent SPX videos/analysis, we looked at this Index short.
On the fall we are reaching Short targets with new Long entry zones.
This comes with early PA and indicator/TECH confirmation.
SXP500 Index: The day when hope die!Today we are here to talk about the SXP500 index.
Today: The SPX500 index is trading at 45 70. In the current trading session, we have seen a slight increase in price towards our target zone, which was discussed yesterday, the link to the idea is below.
What's on the market now:
Now the market is moving into a profit-taking phase, and you should also think about it. But in the last trading session, the market opened new horizons for us at 4750.
However, globally, the market also has a correction trend at 3750. Let's deal with this.
What are we waiting for today:
Looking forward to a further move to 4600 and then a pull back to 4450 and if that happens it would be a great place to go long.
What I recommend:
If you want to open short:
You can open short positions from 4585, limiting the risks.
If you want to buy:
Longs are possible from the level 4450, limiting the risks.
And yes, please don't forget to like. This greatly motivates me to share my trading ideas and market knowledge.
Also take a look at my profile where you will find the full history of trading every day on the SPX 500. Contact me in 1 or 2 days for further trading advice.
I hope these tips were helpful to you, let me know in the comments below and don't forget to subscribe to my channel.
I post reviews about SPX500 every day, so check back tomorrow!
See you next time!
Bye!

Is S&P500 going to make a LL soon?If we break above 0.786, then it's more likely we might make a new ATH. S&P500 getting above 200 DMA that is already a positive sign. IMO I don't believe S&P will make a new ATH anytime soon. ATM we still have more space to go lower even making a LL.

SXP500 index: And Biden with oil barrel under arm.Today we are here to talk about the SXP500 index.
Today: The index is trading at 45 45. And in the last trading session, we saw the price stabilize. The reason for this was the decision of the US to "open" oil reserves, which of course should help the US economy.
What is important: this decision was made at a critical moment for the market. I see it on the charts and of course the purpose of this decision is to ensure the economic growth of the indices and also to prevent a recession into which all countries of the world will plunge.
Well, it's clear from the graphs.
What's on the market now:
They are trying to hold the market and prevent it from collapsing. For this involved strategic resources in the US. In the near future, we will see the price move towards the level of 4600. As planned earlier. Here you can open short positions, at the same time. Converting risks to 0.
And what is important: we have the opportunity to move to a new level at 4750. Of course, the market movement to 4750 is an unlikely event, however, measures to support the US have been taken and they will have a positive recent and this cannot be ruled out.
What are we waiting for today:
We are waiting for further movement to 46 00.
What I recommend:
If you want to open short:
It is better to open short positions from the level of 45 90 short positions, while limiting risks to 0. You will have a chance to limit losses.
If you want to buy:
A good place to buy would be around 44-50 but you can try buy at 4522, while limiting risks to 0. You will have a chance to limit losses.
And yes, please don't forget to like. This greatly motivates me to share my trading ideas and market knowledge.
Also remember to contact me in 1 or 2 days for further trading advice.
I hope these tips were helpful to you, let me know in the comments below and don't forget to subscribe to my channel.
I post selected reviews every day, so check back tomorrow!
See you next time!
Bye!

Target reached 3/29/22, bullish close = final bull move (4700+)At the beginning of the week , I called SPX hitting 4626 and SPY 460 by the end of the week but it seems it has reached to the price a lot faster than expected.
Moving forward, todays close is imperative to future movement as one more bull run might be imminent before the eventual correction . If SPX is to close around the 4620s , I could see it pushing one last time up to a total price of 4700 + specifically 4707 . Once reached, there may be more of a reason to short the entire market even if temporarily to 4504 .
As for SPY, 470 is possible given the price closes bullish today.
Thank you for reading.

SPX W-Shaped RecoveryI think we might see the end of the war soon.
Russia says the first phase of its “military operation” in Ukraine is mostly complete.
I am considering a W-Shaped Recovery on SPX and a price target of $4710.
Looking forward to read your opinion about it.

S&P 500 IndexThe world’s most important stock market index, the S&P 500, rose firmly last week, despite earlier making the first “death cross” / “bear cross” (50 day moving average crosses below the 200-day moving average) seen since the coronavirus shock of March 2020.
The price closed Friday with strong short-term bullish momentum just a fraction below the 200-day moving average. If the price can now get established above that moving average, it will be a bullish sign that the bull market is likely to continue after pulling itself out of correction territory.
There is an obvious key resistance level at 4596.

SPX IS LONGMy views on SPX is bullish heading towards the resistance line of 4780.43 to retest it or break it.

SPX LONG ZONE UPDATEDFor More Daily Detailed Analysis, Go ahead and click on the Follow Button,
Here we have our US INDEX chart of the SPX.
We are looking to the long side on improved sentiment and the current price action zone we arrive at.
We can look to the north side for an exit at some comfortable resistance.

SPX LONG ZONEFor More Daily Detailed Analysis, videos and Trading lessons please feel free to click on the follow button.
Here we have our SPX chart.
As we return to key market memory zones we can look for an upside move from upside bias. Market sentiment is improving which helps this Particular bias..
for exits we can look towards our KEY MA's and some early resistance as noted.
Use eclipse/arrows for price guidance.


SPX RE LONGHere we have our SPX updated chart.
We previously looked short falling to previously hit long zones. As we approach these areas we can start to form our upside bias.
Look to enter around previous price action and exit at early resistance.

Something That Bothers Me - SPX On the Weekly chart it can be seen that the wedge pattern is respected with three down waves
The same pattern arose on the Monthly timeframe, yet a third wave is absent, and bullish continuation was the result
Thoughts?
