SPX news PLAN.For more Daily Detailed analysis, go ahead and click on the follow button. If you have any questions, please do ask them!
As we have seen the US Rate hiking reports, mixed with current Poor sentiment with global news has caused the SPX and other major markets to be spooked.
We are looking to get long on the SPX and take advantage of lower prices. We buy low and we sell high for a gain.
As price falls it reaches comfortable support/Technical areas. These consist of strong price action and are often accompanied by key support areas.
look for exit at the eclipse symbol area. Updates for RE longing will follow.
Spx500long

S&P INDEXHello traders. I expect the price to correct at least 50% of its previous uptrend after the end of the pullback. Be profitable

SPX falling To riseFor more Daily Detailed Analysis, Go ahead and click on the follow button. Also if you have any questions, please do ask them!
Here we have our SPX chart. Current news has shocked markets amid a Tech sell off as well as remaining inflation fears. This has caused stockmarkets to drip and provides room to get long..
On this fall in Price we are entering new long zones. This is because the price is getting much lower and fast. however, It is advised to wait for a change in direction before entering when catching knives.
Remember to make your positions small also. We are falling to older comfortable support levels/ Price action levels on higher TF's, we are also nearing the 200 MA on our 1H chart..
Look to start to get long when it is appropriate and exit around the eclipse symbol area.

sp500Anyone ever look at #SPX500 12 M chart? Looks to me like we are in an obvious W3. Question is W3 going to hit that 3.618% Fib level B4 tanking back down to test the 1.618% or is W3 done here?
The way #SPX cuts through fibs I think 5,700 is more likely 1st.

SPX - TRADING PLANLooking at the 4hr SPX500USD chart I have found a couple of price levels where price may reach for and target before hitting the 5000 mark.
We see price has been consolidating for some time now and making volatile moves both up and down. This has created and left liquidity pools which I believe should and could be reached for. The dashed trendlines showcase the areas where there is liquidity sitting and are also in places where I have identified an inefficiency.
Thus, I believe price could come down even more and target these before moving up strongly and quickly.
Another confirmation of another move and down here is the head and shoulders pattern formed by the market.
Although I anticipate a drop in the market, I will not be selling until I see a valid setup and will mainly be focused on securing the buy.
There are 3 potential trade ideas here. The first one has a more aggressive stop loss to maintain a good risk to reward while the 2nd one has the same entry but a more conservative stop loss.
The 3rd entry is very deep into the retracement and may not be filled hence the earlier entries.
I personally will be placing 1% risk on the first, 0.5% on the second and 1% on the third; giving us a maximum of 2.5% loss.
The black horizontal lines represent my take profit areas.
DISCLAIMER: I am not a financial advisor and nor is this financial advice. Only risk what you can afford to lose and this type of speculative trading can result in loss and/or profits.

SPX looking longFor more daily Detailed analysis, please feel free to click the follow button. If you do have any questions, please do ask them!
After hitting our short side targets we are looking to flip long. This is because we are reaching previous key PA zones and comfortable support.
Exit is at higher eclipse symbol on the long side.

SPY Super Predictable.Hello Traders,
It's been awhile since I've shared with the class, so I figured I'd give a little Christmas treat.
In Dec., SPY has been extremely predictable so far. Those trendlines (the 2 red and 2 long green and blue), those were drawn around the 6th. As you can see, the PA has been very true to the trend.
Now, this is where it gets a little more exciting. IF TODAY CLOSES ABOVE THE NECKLINE, which happens to be the trendline, or one of the upcoming days... There is a potential IH&S (inverse head & shoulders aka H&S bottom).
I realize that is a little tight with that right shoulder only a point or so away from the bottom of the head, but technically it still applies. Since it is I would guess that this means there could be more Throwback (moves down before up) and this would hurt post breakout performance.
Note: this IHS could totally wipe since it's unconfirmed so far. Also, the target is not a prediction of date, could happen sooner, could happen later. The other wrench is the throwback, if we see a lot of it, the target will significantly be reduced. Even if we decide it's not going to be a IHS it's still an (Eve & Adam) double bottom with a fast reversal on the Adam side, so bullish either way.
With all that said, I think we are looking at a nice little melt up to end the year and pending any crazy news, we should also have a pretty bullish January. So move all of your doomsday predictions out at least a month bears.
Good luck and Merry Christmas.
Sincerely,
Mike
****Be sure to Like, Follow, Support****

S&P500 INDEX - ATH is comingHello friends.
Please support my work by clicking the LIKE button(If you liked).Thank you!
Everything on the chart.
I'm waiting for an upward movement from the current ones or through ~4650.
TP: 4850 and 5000
cancellation of growth, consolidation below 4500
risk is justified
Good luck everyone!
Follow me on TRADINGView, if you don't want to miss my next analysis or signals.
It's not financial advice.
Dont Forget, always make your own research before to trade my ideas!
Open to any questions and suggestions.

BUY SPX500Good morning traders, after the analysis I've made on the S&P it shows that it will go long for today. Buy it and place TP and SL on your own.

SPX long at MA's.don't forget to click on the follow button for more daily detailed analysis. Please do also ask any questions should you have them,
Here is our SPX chart.
We are still long after the fall. Price is low and we are looking for market sentiment to drive our trades.
Resting at Key support + MA's. Price action confirms entry.
Exit NOTED by eclipse symbol.

SPX500 Long Setup$SPX500 Weekly Analysis (Long)
Based on the formed ascending channel, I believe price is currently in overbought territory, and as such it will retrace back down to the lower trend line. The zone of interest is between $4,646 and $4,710.
That is of course in case the price doesn't go through the highest high level ($4,815), in which case I will either be buying the breakout or wait for a pullback in order to open a long.
Those with higher risk appetite may decide to short the security down to the above mentioned level. I personally may do that, but I'm still waiting for some more solid confirmation

BUY SPX500USD As I said in the previous post, S&P and NASDAQ are going long. Buy them and post SL and TP on your own.

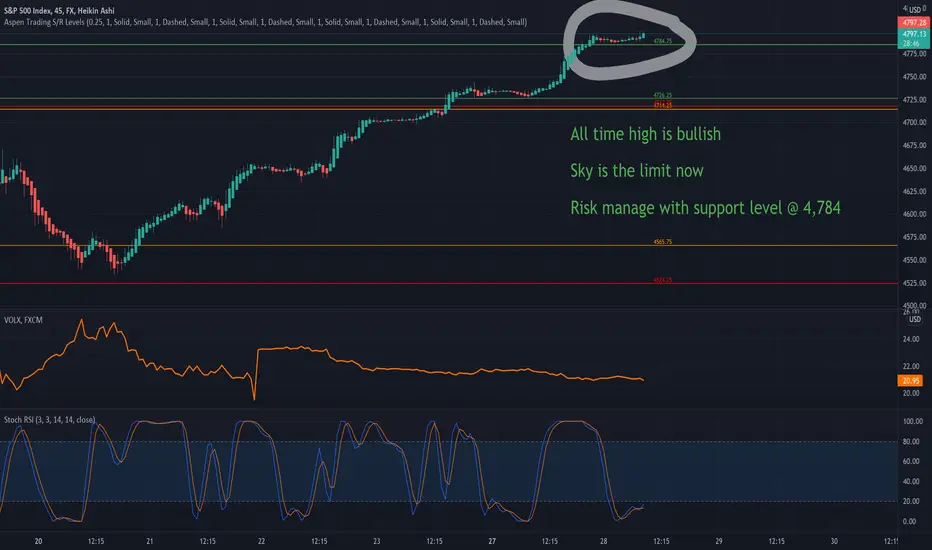
SPX sky is the limit now SPX is trading at all time highs now. We remain bullish but will keep a support level at 4784 to manage our risk.
We use Aspen Trading Support & Resistance Levels to risk manage our positions. These levels are invite only and can be accessed through url in my profile information.
Disclaimer: This analysis is for information purpose only and does not constitute any investment advice.
S&P500 History repeats.Movements are not casual! Bullish💥Hi All, my main 3 take-outs from this analysis are the following:
1- 100 Moving Average is still working well as dynamic support and prices are bouncing from there aheading to 470
2- It is realistic to think that beginning of 2022 might start with a retracement still towards the support sitting at 455, with a movement that might bring to the formation of a lateral continuation channel, but in my opinion the asset is well familiar with this kind of movement and my next closets target would be 470.
3- Once the price reaches 470 I would count on an extension of the movement towards 490, also with the help of Fibanocci extension of the previous upward leg
Not a financial advice, just personal opinion. Do your own due diligence and good luck!


S&P 500: Clarity Delivered and Potential Bright Drive AheadThe S&P 500 begins today’s trading on the cusp of all-time highs and speculators cannot be faulted for anticipating the day ahead with excitement. Yesterday’s FOMC statement from the US Federal Reserve delivered clarity for financial institutions, and perhaps more importantly, met expectations.
This propelled equity indices higher and the major US stock markets rocketed higher in unison. The notion that the S&P 500 could break new records is actually not a major headline event; it is where the index could finish this week of trading that may prove to be breathtaking.
The trend higher in the S&P 500 is evident, and even contrarian speculators who believe the end of the bull market will end sooner rather than later must be feeling nervous at this time. Resistance levels continue to look vulnerable and targets above continue to look attractive. Yes, the index is certainly capable of producing a move lower, so it is important to have realistic expectations.
Conservative amounts of leverage must be used to protect against movements which are unexpected. However, technically the bullish momentum remains alluring, and the potentially correct wager.
Early future calls for the US markets appear to be optimistic and there is reason to suspect record values will be seen early today and junctures like the 4755.0 to 4765.0 marks will be seen relatively soon. Traders who are looking to buy the S&P 500 on slight dips in the market may find that they are being a bit too conservative today. Perhaps a better cautious approach to the index may be to become a buyer when resistance levels are penetrated; this means placing a buy order above the current market conditions and anticipating that a major juncture proving vulnerable could spur on additional speculative fury to the upside.
If a trader wants to sell the S&P 500 today on the notion they can find a profitable reversal downward for a quick hitting result, this to prove all of the optimists wrong, good luck, but it may feel like spitting into the wind. The trend of the S&P 500 has been upward and yesterday’s interest rate report from the Federal Reserve may prove to be a catalyst for the major indices heading into the holiday season.
Traders at financial institutions like nothing more than achieving highs as Christmas and the New Year approach, and they may achieve their aims handily. The potential for the S&P 500 to be near the 4800.0 juncture near term looks like a legitimate goal for those looking ahead.
S&P 500 Short-Term Outlook
Current Resistance: 4751.0
Current Support: 4727.0
High Target: 4785.0
Low Target: 4713.0

ES1! - 4HR - Santa and His (REIN?)Bulls! - LONGSANATA AND HIS REINBULLS ARE COMING TO TOWN!! (doesn't feel catchy, but it fits.. I guess?)
Next weeks(possibly even months) outlook is looking pretty dang clear.. The bulls are in full force!!
-Shorts squeezed out
-Good Ol' Cup n Handle formation
-Break through the 50D,20D, moving averages, bounced back with 100% recover.
-Heavy long volume accumulated in the Value Zone( Volume Profile - Point of Control)
Excluding the recent drop, there's been 4 weeks of balance between November and December between 4650-7010 price area. With that being said, I believe there's still long-term holders that accumulated in the Nov5-24th + the 3 day balance between Dec8th,Dec 10th. There's a ton of bulls in the game right now!! With the recent drop and recover, it's apparent the bears couldn't shake the bulls and the longs are back in FULL FORCE. An explosive move up has been bottling for sometime now and it's ready to POP! The coming weeks should be pretty straight forward, its clearer than ever that this market is going up..
Looking to end the year strong, I'll be entering with heavy conviction and heavy options futures contracts this month. Here's a look at a trade im entering coming into Monday:
Enter at pullback: 4687(Value Zone + .382 Fib Correction from last leg up on 30m chart)
Targets: 4800(Long Term TL,) 4874(1:1 Fib Ext)
Stop: 4681(Break below value zone + violation of the baby cup n handle formation and likelihood of further chop n balance)
This could top my chart for one of my best trades if it plays out. I may or may not get the desired entry at the pullback as it's definitely likely we could see a gap up Sunday/Monday. I'll take the entry at the break of balance either way and adjust my stops.
A little helpful link to check the historical average gains/losses of specific months, take a look at December: 53 up years; 18 down years; ave. return = 1.39%. Here's the link: www.moneychimp.com
30m chart:

S&P 500 Forecast: Index Pulls Back From 4700 Yet AgainThe S&P 500 has pulled back during the trading session on Thursday to show signs of weakness at the 4700 level yet again. This hesitation is something that we have seen more than once, therefore it suggests that it is going to take a significant amount of momentum to finally break out to the upside. The 50 day EMA underneath sits just below the 4600 level, which is an area that has been noisy here recently as well. That being said, I think the market is probably going to continue to see a lot of volatility as we head towards the end of the year, but I do believe that the “Santa Claus rally” is still going to be the big story.
On a pullback, I will be looking at this market for signs of strength and a bounce, therefore I will get long again. I have no interest in shorting this market, we are far too strong and although the last couple of days have been a bit difficult to deal with, we are only down about 0.2% or so from the all-time highs. This is hardly a market that is falling apart, so I think it is only a matter of time before we see value hunters taking control of this market yet again. I think at this point in time it is difficult to get overly aggressive one way or the other, but if we get a significant selling move, then I will be looking to “leg into the position.” I will add slowly and wait for opportunities on signs of recovery to get involved in a market that is obviously heading in one direction over the longer term.
I believe that the 4500 level is going to be a bit of a floor in the market, and therefore I think we continue to see plenty of money managers out there willing to pick up value due to the fact that they are chasing those returns. If we were to break down below the uptrend line, then we could go looking towards the 200 day EMA, but it is very unlikely that we will see that happen. If we do, then it could be due to a lack of liquidity as we head towards the holidays. That being said, this is a market that retains its overall shape.

ConclusionAt the morning I posted the the S&P will go long but it didn't, unfortunately it decided to stay consolidating in the channel you see in the picture, by going to the daily chart we have a beautiful spring box which is an acceleration of the bullish trend.
See you tomorrow in a new forecast !

BUY SPX500Good morning traders !
You might wonder why I said that the market will go long while it's consolidating and we can't decide if it surely will. Following my strategy and some analysis I've made it will long.
Buy S&P now and place SL and TP on your own.

BUY SPX500Good morning traders !
It's been a while I haven't posted however today I managed to post today's signals on the S&P and NASDAQ. We've got a signal to buy S&P even though we had a bullish trend on the Asian and the European session. Buy it now and place TP and SL on your own.

Inverse H&S (bottom) on the 1hr SPYHello Traders,
This is a follow up on my last post. Some traders have never heard of the term Head & Shoulders Bottom, it's a small technicality, so I will be more clear. Looks like we have confirmation. So we could have some throwback, but ultimately the direction is up. You may see more shorts jump in angrily, but that's how it is. Unfortunately, there are always people on the right side of the trade and the wrong side.
Also, with throwback and only 71% of meeting that 2nd (longer target) it doesn't make things so cut and dry; however, December is typically a smooth riding month, so I wouldn't be surprised if we see a bit of a melt up. The odds are very much in the Longs favor here.
Lastly, please note, there is also a Double Bottom (Adam & Eve DB). Confirmation was at around 459.05.
I wish you all the best!
Cheers,
Mike

S&P 500 Forecast: Index Wipes Out Most of Wednesday LossesThe S&P 500 has rallied significantly during the course of trading on Thursday to wipe out the losses from the Wednesday session. We managed to close above the 50 day EMA, as it looks like markets are ready to continue to go to the upside for a longer-term move. All things being equal, this is a market that I think continues to see plenty of interest, as we have seen so much in the way of bullish behavior over the last several months.
Yes, the market has negative for a while, but that has been the most recent behavior, and at this point in time it is but a blip on the radar of the longer-term trend. That being said, the market is likely to continue to see buyers looking for value, especially as the end of the year approaches, and people will be looking to reach some type of benchmark for their clients. Because of this, we have the so-called “Santa Claus rally” that typically happens at the end of every year, and I do not see this year being any different. Because of this, I think what we have is a scenario where every dip will be bought into, and we will eventually go looking towards the 4800 level.
The market is currently hanging around the 50 day EMA, so that will attract a lot of trading, but at the end of the day the most important thing to pay attention to here is the fact that the jobs number is coming out on Friday, and it will almost certainly cause a significant amount of volatility. The market selling off quite drastically on Friday will almost certainly be bought back into, which is typically the case with the Non-Farm Payroll Friday situation. This is because liquidity disappears, and people will find some type of narrative to start buying the dips. That is what Wall Street does, it finds reasons to go higher. Furthermore, even though the Federal Reserve is pretending like it is worried about inflation, the reality is that the first time Wall Street throws a serious tantrum, they will step in and save the banks. Because of this, it is not really a market so much as it is a bidding war to see who can push things higher over the longer term.
