S&P 500 FUTURES 1D-TIMEFRAME ANALYSIS✨S&P 500 1D-TIMEFRAME ANALYSIS✨
Hello ladies and gentlemen
This is my new idea for the SPX500
My idea is that the index will go higher
T1
4500
I hope my idea is clear
Support me by like and share
Stay Safe💯
Good luck💰
Spx500long

SPX500 close to LongHi Traders,
This is our view on this cross for the next days.
#SPX500
BUY 3775
SL 3755
TP 3845
We remind you that this is only a forecast based on what current data are.
Therefore the following signal will be activated only if the rules of our strategy are strictly respected.
Any updates will be given in the comment section below.

US500 Good luck to you!
Don't forget to like and share, it really helps.
Follow for more.
This is just an idea, not financial advice.

S&P 500 Long PositionS&P 500 Long Trade
Entry: $3,807.4
TP & RR: $3,871.4 (2.29)
Stop Loss: $3,779.5
REASONS FOR THE TRADE
Building upon yesterday's SPX500 trade on which we got stopped out, I am once again trying to catch a bounce up from the lower trendline in a channel.
This time the SL is set much lower and I am not a big fan of having such a wide distance, but I don't want to get stopped again.

S&P 500 Ascending Channel - Long SetupS&P 500 Ascending Channel - Long Position
Entry: $3,795.3
TP & RR: $3,873.6 (3.26)
Stop Loss: $3,771.3
REASONS FOR THE TRADE
I believe the price will respect the lower trendline in this ascending channel and will continue trending up. Initially, we had the order at a lower level, but it seemed that we wouldn't get a fill, so we trialed it up.
Needless to say, if the price breaks through it, I am expecting a fairly sharp drop and will be looking for a short position. The current entry is at a support level, which while being a bit conservative, gives us a good RR with the SL far enough and with enough room for the trade to breathe. If the price dives down or does something unexpected, we will close the order prematurely.

S&P 500 Channel - Long OrderSPX500 Long Position
Entry: $3,772.9
TP & RR: $3,849.1 (2.92)
Stop Loss: $3,746.8
REASONS FOR THE TRADE
SPX500 has formed an ascending channel, so I am looking to open a long order at the lower trendline. In addition to bouncing off the trendline, I also want to see a divergence in the Market Flow indicator, which will signal a potential reversal. In any case, I will be carefully examining this level, because I will not be too surprised if the price breaks through it and makes a sharp drop.
Stop Loss is relatively close here, but the entry is also fairly conservative. To get filled, the price should make a small drop and then gradually start going up. If it does touch the trendline above my entry I will examine the situation and might open a long there with a SL just under the lower trendline.


SPX500/S&P500 ( DONT MISS THIS)here is SPX500 a.k.a S&P500 , we can see that price is moving respecting a bullish channel in 30 min, Then price has already tested the support of the channel, from here we are looking for buying in order for the price to test the upper boundary of the channel ( BUY AFTER RETEST)

SPX500 Within a Channel - 2 Possible LongsSPX500 Long Setup Idea
Entry Levels:
1) $3,785.7
2) $3,764.8
TP & RR: $3,870.7 (4.89 and 5.71)
Stop Loss Levels:
1) $3,768.3
2) $3,746.1
REASONS FOR THE TRADE
SPX500 may be due for a small correction and I want to catch the indicated level, which is a flip from resistance to support. I believe it should hold well, but what I am really looking for is a quick, clean wick to the entry or worst-case scenario a close and then a quick trend up. If the price closes under that level, then the trade will be invalidated and I will be looking to open the second long order with an even better Risk : Reward. I will also be looking at the Trend Volume RSI Analysis and what it prints in terms of trend and divergences.

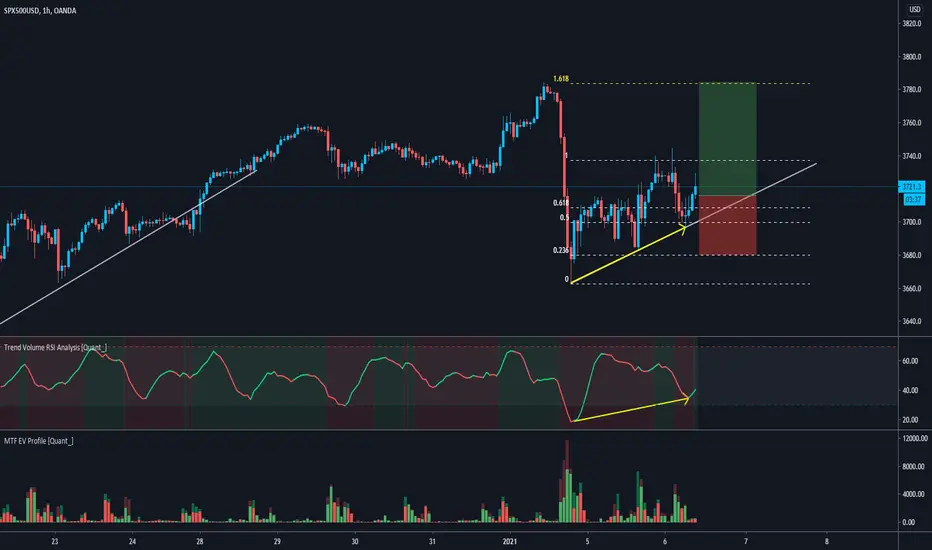
S&P 500 Index Long SetupSPX500 LONG SETUP IDEA
Entry: $3,715.9
Stop Loss: $3,680.5
TP Levels and RR: $3,784.4 (1.94)
REASONS FOR THE TRADE
I know that I am posting this with a bit of hindsight, but by the time I opened my order and came back to do the analysis the price has already gone up. Anyway, I am posting this in case there's a small retracement and you decide to jump on board.
The indicator Trend Volume RSI Analysis shows a clear divergence in the volume and you can also see the buying and selling distribution in the Multi Time Frame Effective Volume Profile below. I have also applied a Fib Retracement to this ascending triangle, which indicates that the take profit should occur somewhere near the potential resistance.
The SL level is put at a level far enough from the trend line. You can be slightly more aggressive here and move the SL up, which would significantly improve your RR Ratio. Generally speaking, breaking down this trendline would invalidate the setup, so if you have taken that particular trade you may close your position before hitting the SL.
SPX500 and a NICE BUY-CHANCE!Hey tradomaniacs,
SPX500 could move up 👉
Todays sell-off pushed price down into a price-zone with possible bullish confluence.
Primary Trendline pls horizontal support-zone can be a very attractive zone for buyers as soon as we see a confirmed rejection.
In terms of correlations a perfect match with the GAP-CLOSE of DXY (US-DOLLAR).
LEAVE A LIKE AND A COMMENT - I appreciate every support! =)
Peace and good trades
Irasor
Wanna see more? Don`t forget to follow me.

S&P500 possible moves the indice can make coming into the new week.
lets watch the pair for a while, i will give an update on the same on Monday.

What are your ideas?
TVC:SPX
If you liked the analysis, follow me so that you can be informed of the analysis in the shortest possible time.
Support me with your likes and comments
S&P500 LONGBreak out loading....
lets watch and see how the market plays out.
I am bullish on s&p500.

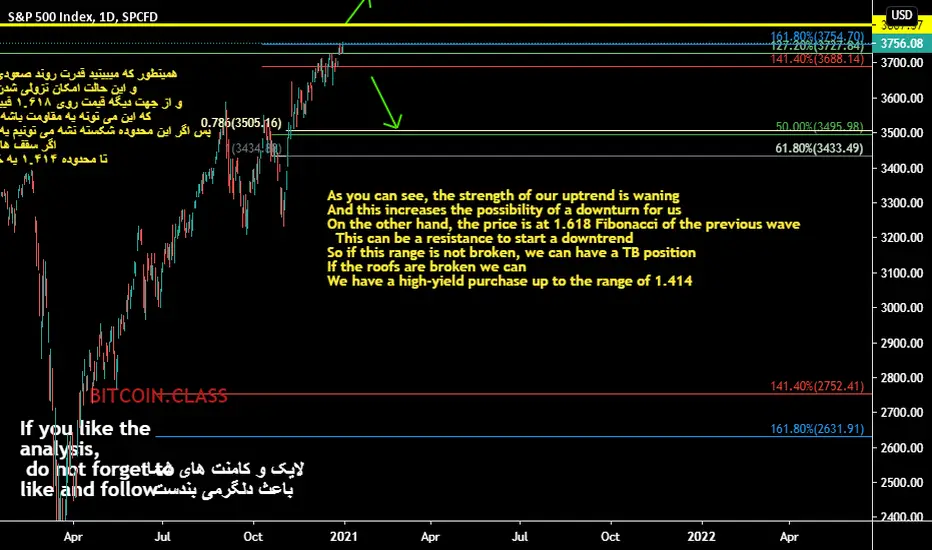
SPX WARNING! BE CAREFUL, END OF WAVE 3 IN APPROACH?Hi evreyone,
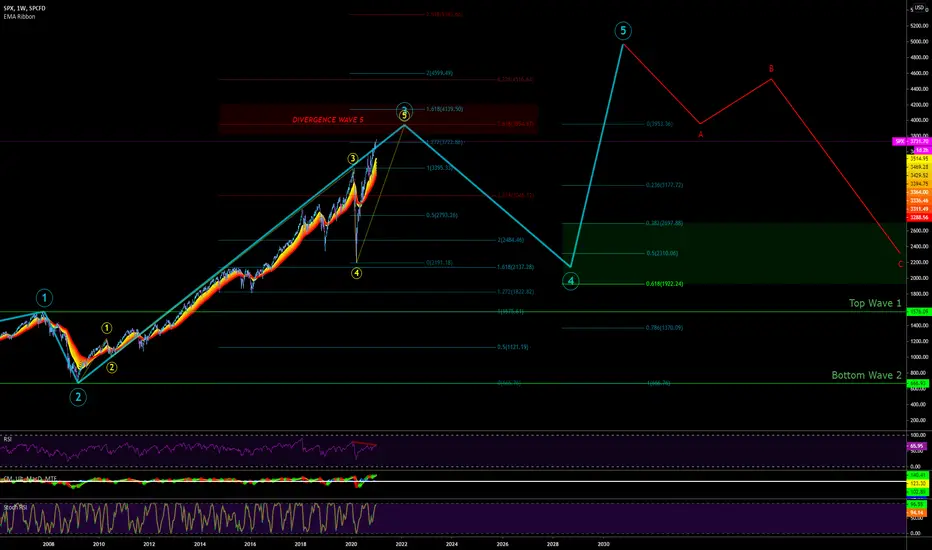
With a clear divergence on this last wave since january 2020, i believe investors must be careful with this main wave 5 inside the super cycle wave 3. If you ask me if it's the time to enter? My answer will be... "Bottom of wave 2 was the time to enter or bottom of main 4" which was the last march retracement.. but not now. On this chart you will see that many more entry points will be available on the retracement of Cycle Wave 4. For sure we can reach higher than 361.8% and make an extension... but i'm pretty sure that SPX will face big time resistance around 4000.00 and usualy 3.618% is the last exit for many patient investors. Also there is a clear bearish Divergence which is confirming Main W5. Long trader are now looking to exit slowly for cycle wave 4, HFT Bots will follow.
If Main Wave 5 Stop at 3.168% = 39 here are some entry points
0.398.87 = 2698.87
0.5 = 2310.86
0.618 = 1922.86 Golden Fib
You will find a lot of buyers between 0.5 and 0.618.
For sure those entry numbers refers only to a retracement that would start from the 3.618% a little less than 4k. The arrival of the Joe Biden
will be a great pretext, just be careful.
Defensive sectors would be appropriate right now like HEALTH. Health care tend to generate stable profit throughout all phases
of the economic cycle. Consumer Staples, Health Care, Utilities, Telecom services.
-If you take a look on the daily chart the daily EMA Ribbon is complety reversed which give more place to volatility and
retracements. I will post the EMA RIBBON under. For me this Look pretty scary at the moment, i would not be a buyer.
A gap like this usually can last around 65days to 80 days, this bring us between to the 6th and 21 of january.
Super Cycle wave 5 tend to loose strenght... but this wave can bring us around 5000 and more.
Have a wonderful christmas, best to you !
SPX500 could go NOW!Hey tradomaniacs,
After-Lunch-Session begins in 10 minutes and we could see a boost of SPX500 👉
Technically a nice entry to go long!
As mentioned, I don`t make any SPX500 calls as price and spread can vary from broker to broker.
LEAVE A LIKE AND A COMMENT - I appreciate every support! =)
Peace and good trades
Irasor
Wanna see more? Don`t forget to follow me.

S&P wave (3) rally SPX rally on going looking to break higher into wave iii upside target of 13,300. We are tracking a motive impulse with this year end rally. So far this wave iii rally is suggesting the rally that could take us through end of 2020.

Just went long SPX500 SPX500 it’s trending to the upside on the higher timeframes, looks like price is making a double bottom on the 15min for a higher low on the 1H and a possible continuation to new highs💯

SPX500 could PUMP again!Hey tradomaniacs,
After a re-test of the current trendline and key-support-zone we could see another bounce upwards in order to complete the impulse-wave-pattern.
Price-Action showing demand at this zone and so higher bullish confluence.
A pump today could be important for pairs such as NZD/USD, AUD/CHF and NZD/JPY to break their key-resistance-levels.
Since price and spread can vary for this assets I don`t make an call with exact Entries.
LEAVE A LIKE AND A COMMENT - I appreciate every support! =)
Peace and good trades
Irasor
Wanna see more? Don`t forget to follow me.
Any questions? PM me. :-)

A Planned Formation - WedgeSPX is clearly extending above levels of speculation and lacks reality.
evaluating crisis based on impact, it is clear COVID is the dominator.
The price does not accurately represent the current state of the economy, not just in the US but around the world, it is clear we are in times of turmoil.


SP500- up, up, up!After US election, SP500 has started to rise and now is trading more than 10% up since the recent low and just under all-time high.
Although I don't see any fundamental reason for this rise the market always knows better.
From the technical point of view, the index broke above the trendline resistance of a symmetrical triangle and we can see a new all-time high and a run to 4k zone.
Dips should be bought for SP

SPX500 BUY SIGNAL Hey tradomaniacs,
welcome to a new free trading-setup.
SPX500 (US500): Daytrade-Execution
Buy-Stop: 3609,00
Stop-Loss: 3600,00
Target 1: 3617,00
Target 2: 3623,00
Target 3: 3635,00
Stop-Loss: 9 (90) pips
Risk: 0,5%
Risk-Reward: 2,95
LEAVE A LIKE AND A COMMENT - I appreciate every support! =)
Peace and good trades
Irasor
Wanna see more? Don`t forget to follow me.
Any questions? PM me. :-)
