SPX Short Bias Remains.. 13:27:23 (UTC) Fri May 22, 2020SPX Short Bias Remains..
13:27:23 (UTC) Fri May 22, 2020
Spx500long

It's time SPX correlates with economy and society again.Let’s take a step back. What do we see on the bigger picture?
Early and late 2019, we saw two big bull runs after a downwards correction lasting a month.. Both bull runs lasted roughly 5 months.
What did we see in those five months? Very quickly declining buy volumes.
What did we see after there where too little buyers left? A correction downwards lasting roughly a month. This is also what we saw in February/March 2020.
The huge drop in February was enormous and went very quick. The correction upwards, went much slower. And we know: Impulse takes more price than time, correction takes more time than price. And that is what we are seeing here, ladies and gentleman.
So we have a very strong (but relatively slow compared to the drop) correction upwards, taking a lot of price(but even more time), where we see the volume is declining much faster than the strong upward moves in 2019.
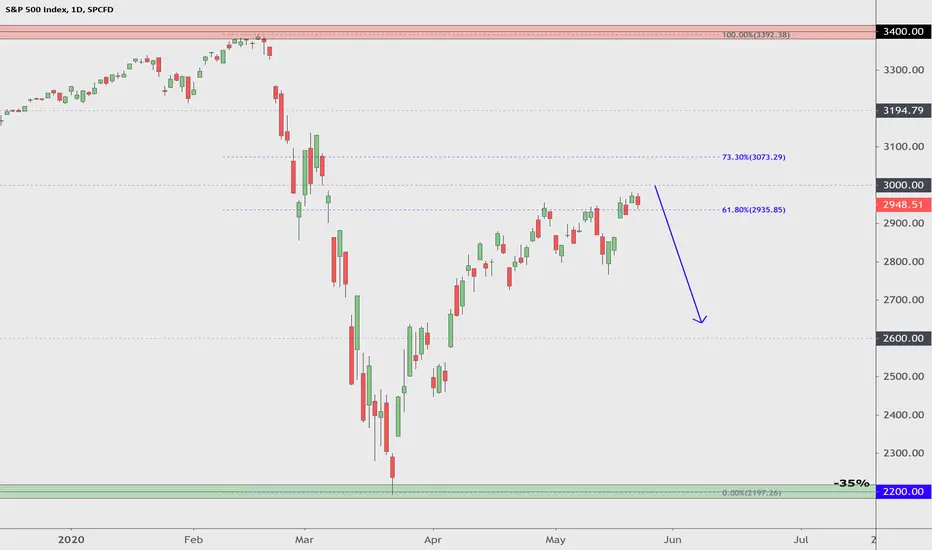
We are having a holiday in many countries now, and a Friday is waiting for us. If, and I say IF, this week would close weak, we could close below the green trendline (support for long time, seems to be resistance now), below the 50 Weekly EMA (and 100 Daily EMA) and potentially below the 0.618 Fibonacci retracement level at 2935. Doesn’t that sound bearish? Given this graph?
It starts to look like a good moment for correction downwards. Let the SPX reconnect with the economy and society again, rather than being a de-correlated product of speculation. If not now, then soon.
And no, it’s not different this time.

Price versus Volume. A hidden signal?A quick view on the SPX500 future shows something interesting. It is not rock-solid analysis, but just something fishy that caught my eye and I want to share. Discussions are welcome.
In the last week, we can see two interesting phenomena:
- Big downwards price moves happen with big volume, mostly day time activity(blue)
- Big upwards price moves happen with small volume, mostly night time activity(orange)
Of course there are examples in this graph where things make sense (green) or where we see downwards momentum with little volume and upwards momentum with higher volume. But still… I find it interesting.
It seems market is very willing to push this down, but overnight news/players pushing it, cause it to keep strength.
And look at that candle to 2980! No volume at all! It’s fake. Fake news eheh.
For me this is another signal how this is a bubble that is about to burst.
Do I dare to trade on this now, in size? No. Not without more confirmation.
Do I think this should go down? Hell yes.

SPX500USD Buy SIgnal SetupEnjoy a free signal
Trade at your own risk;
Know your risk to reward
We had a breakout of monthly S/R area and now market has come back down to retest the resistance. If it holds, this shall play out.
Symbol: SPX500USD
BUY
Entry: $2940
Best entry: $2935
Sl: $2920 (-200 to -150 pips from best entry)
TP: $2980 (+400 to +450 pips from best entry)
TP2: $3015 (+750 to +800 pips from best entry)

SPY indicators turning bullishThis will not stop, will always trend in it's bullish channel. I expect it to get stronger even more as indicators turn very bullish in 4hr


The bears have entered the stage - waiting for retracementSPX has shown it’s bearish strength last 2 days. We went from the 2950 levels - where SPX was battling with the previous high, the Weekly 100 EMA and the Daily 50 EMA – to a new local low of 2765. One can see that the impulse with which the market went down was very convincing.
However, market did not accept the low and traded up super strong after the low was set, showing bullish strength.
Showing this kind of strength, I believe we should rally up again, but I think setting new high’s will be tough.
A good plan of action for me is to keep a good eye on the battle around 2870 (Weekly 100 EMA), and the 2900 (Daily 100 EMA, psychological level). Since new low’s suggest weakness, setting new high’s is not impossible but unlikely.
Good entry strategy could be to sell at 2900 or slightly above with stop loss at 2980. New high would invalidate the bearishness, thus invalidating your short.
First target should be the blue box at mid 2600 levels, where we have 0.382 Fib retracement, Weekly 100EMA and previous S/R level. Note 2725 could be a support too. Note though that drifting away to much lower levels than 2650 is definitely possible when 2650 level is reached since bearish trend would be confirmed.

Critical Move For The Markets. (SPX)We are watching this compression point currently under this horizontal Resistance level.
Paying attention to the upward support that we are approaching after breaking our first price average as the candle crosses over the black line.
We hold that as bearish movement.
Would like to see it crack and have a nice Retracement.
50% short. Playing roughly 3% stop-loss, we will stay on top of it and see how she wants to move.
Have an awesome trading week! Cheers. ✌😁✌

Did We Bottom in the S&P 500?Bullish:
5 waves off the lows;
Some huge caps are bullish (AMZN, GOOG...);
Prices squeezed between the daily and 4H Vegas waves and still not dumping;
Hidden bullish divergence on the 12H RSI;
Daily RSI bear market resistance around 50 seemingly reclaimed.
Bearish:
Geometry is horrible (upward pitchforks median lines untouched, prices channel well);
Volume is anaemic;
June VIX futures at support.

Analyzing recent moves on SPX - in bulltrend with bearish signalWe saw last week 2950 was a super strong resistance. We tested it three times in a few days.
This level coincides with the Weekly 200 EMA and the 100 Daily EMA. Also it has been a strong S/R historically.
After being rejected for the third time, SPX lost it’s support and broke through the support trendline formed by the early march low and a low early may. This support was tested 3 times this month and showed promising. Now it failed to hold.
We see SPX fell down and was caught by the support trendline formed by last 2 low’s and supported by the Daily 200 EMA. SPX is now heading up again, hoovering at the 50 Weekly EMA.
We are still strong, bullish trend is not over, but the speed of the move down was significant, showing some bearish strength. However, it is very important to note the bears were not able to realise a new local low. First we need to make new low’s before any real bearish sentiment can be confirmed.
I have no clue where SPX will go and this post is purely analyzing where SPX went and found S/R.
Personally I think it's about time to get some correction downwards, but only time will tell if the bears are strong enough.

SPX: Potential Corrective Trend 1D (May 12)X Force Global Analysis:
The S&P500 index has been showing a clear bull trend for the past few weeks. However, as the "V" shape recovery takes place, we witness a weakened bullish momentum, and a probability for a corrective trend to take place. In this analysis, we explore the bullish and bearish technicals to determine the probability of a correction.
Bullish Evidence
- First of all, it's important to note that we have broken through the descending trend line resistance, marked in the dotted red line
- In doing so, we have created what looks like a reverse head and shoulders pattern, a bullish reversal pattern
- The Relative Strength Index (RSI) shows a clear uptrend, with higher lows
- And the Moving Average Convergence Divergence (MACD) still demonstrates bullish histograms after a golden cross
Bearish Evidence
- However, based on Elliott Wave counts, there is a probability for a corrective trend to take place
- We have seen a clear Impulse Wave count (12345), and are expecting a Corrective Wave (ABC) to play out, possibly down to the 0.618 Fibonacci support
- The MACD is looking for a death cross, with decreasing bullish histograms
- It's also important to note that while we have been in a bullish trend for the past few weeks, the EMA (Exponential Moving Average) Ribbon has not converged yet
- Thus, solely based on the EMA Ribbon, it's too early to confirm the continuation of a bullish trend
- Moreover, we are not only testing the upper Bollinger Band resistance, but the band width is also narrowing
- The narrowing of the band width usually occurs before a big move
Market Sentiment:
Surprisingly, the market sentiment still remains at fear, as we are at 44 on the fear and greed index. This indicates that the market participants are cautiously bullish.
What We Believe
We believe that a correction is highly probable, based on Elliott Wave counts, and a number of other bearish indicators. However, should we see further bullish momentum from this point, it could serve as a confirmation for a continuation of a bullish rally.
Trade Safe.

SPX Not Willing To Go South?SPX500 is possibly finding support above the channel upper boundary line. Lets wait and see how we close the daily.

It all comes down to this point - the battle for 2900.We are approaching an exciting moment. A big battle in the far right corner, with SPX retesting the support line it broke out from last week, and meanwhile finding support on exactly the same level on the trendline going from the low late march to the recent low’s early may. A downwards trendline. An upwards trendline. Colliding.
And that exactly on the 2900 level. How is it possible? I don’t know.
Where will it go? No clue.
Should we step in if it breaks out? Hell yeah.
The battle of 2900.
This is the moment that waiting is more important than action.

LONG MCDKeep your trading simple
Bullish Swing
T1 = minimum risk reward 1:1
I always leave 1/3 of my position for long term gains - moving my stop to my entry if I need to give room for the volatility or using trailing stop for maximum gains.
For maximizing your profits you can use Options.
Not a financial advise just my view - trade smart trade safe.
Follow me to support my work, Thanks!

H&S SPX, High R/R sell opportunityIn my previous post I indicated my change in sentiment from bullish to bearish because of two trendlines that were invalidated due to new local low’s. I initiated a good sell zone in the top blue bar, given that price would move there.
Yesterday we saw a strong rally up, moving into my sell zone, and even beyond. Instead of heading to my aimed level of 2885, the high around mid April, the bulls pushed it through till 2900.
I do not sell before I see confirmation/reversal. There was an early sign of reversal on the 5th of May at 05:00 but it was not strong enough for me to enter. Now, after a night of sleep we see market pushed till 2900, and got rejected. A perfect head and shoulder pattern is forming with rejection of the major psychological 2900 level.
We are still in my sell zone box after rejection and a correction downwards. For me that is enough indication to sell.
Sell at 2865, with a SL at 2905(tight) or 2925(wider) and a TP of 2755(tight) or 2670(wider).
This 2670 is the Weekly 200EMA and the 0.618 Fib retracement with the March 2180 low as starting point and last week's 2970 as high.
Below you can see my analysis from last post, waiting to see correction upwards to enter a sell:


SPX / S&P 500 - DROPWait until price breaks out of consolidation and sell to blue area.. potential to go to orange area but risky

Zooming in the SPX. Black Friday incoming? Or Another Bear Trap?One higher high left on the 1H TF? This upward correction looks more like a B than a 2.
2H bearish divergence on the RSI.
1H bearish divergence on the MACD.
Currently at the trend-line. Now or never for the bears?

SPX at the Trend-line. Now or Never for the Bears?2H bearish divergence on the RSI. Currently at the trend-line.

Careful! Sign of strength in SPXIn my previous post I indicated a good R/R sell opportunity. A small update now given the latest development.
We see SPX is retracing back up. It found support on a trendline (clearly testing it), and locally we do not see a lower low but a higher low. It seems SPX is gonna test the resistance of the right shoulder top(orange line) that was recently formed. However, if it finds again support on the trendline it is a good opportunity to battle to new local high's.
I'm not saying the good R/R entry is invalidated, but a signal of strength has been given by the market with the higher low/support on trendline. Be careful. Let the market give clear signs of direction first - one of the two drawn scenario's - before you take position.

S&P (SPX500USD): Make this Money Printer Go Brrr!✨ We provide charts every day ✨
Like and Follow to help us grow family! 🎉
---
Let's see if that money printer can make it rain friends!
Today we are looking to see if the uptrend can continue with the S&P (SPY, SPX, SPX500USD, etc). Longing the uptrend in equities has been profitable recently, let's assume that trend continues and talk about entries, exits, and key levels.
---
1. S&P is currently in an uptrend within a channel as illustrated on the chart. We recently saw a reaction off the bottom of the channel which produced a long signal.
2. With the strategy in use we want to go long ONLY when Fractal Trend signals an uptrend (Green background color) AND Breakaway Scalper then signals an uptrend (Green bar color).
3. With a long signal having been recently produced, we are watching R1 and R2 for reactions. If rejected at R1 we will watch for a retest of the trend line or even a trip down to S1. If price can get past R1, then the levels to watch above are R2 and R3.
4. If the uptrend channel is broken, S1 and S2 are the next levels to watch for support.
5. Regardless of which way the price goes, we will be using the built in trailing stop on Breakaway Scalper to reduce risk and lock in profits if we move to the upside.

S&P 500 Index (1H) / Primary EW Count (Green or Orange) S&P 500 Index (1H) / Primary EW Count (Green or Orange)
