SPX: A Technical Approach to the Stock Market 1H (Apr. 20)X FORCE GLOBAL ANALYSIS:
In this analysis, we take a purely technical approach to the S&P 500 Index.
Bullish Evidence
- We see a bullish divergence, with higher lows on the price, and lower lows on the indicator
- The Relative Strength Index (RSI) shows lower lows, as well the Moving Average Convergence Divergence (MACD)
- We are also creating higher lows and higher highs in an ascending trend line, having broken through a lot of strong resistances
- The RSI is looking for another breakout through the descending trend line resistance
Bearish Evidence
- However, we also spot a bearish divergence, in which the price forms higher highs, and the indicators show lower lows
- The RSI is trading within a downtrend, showing signs of weakening strength, forming lower highs and lower lows
- The RSI is at overbought levels
- The MACD also shows greater bearish histograms and a downtrend in the moving averages, showing a lack of momentum
- On the bigger picture, we are trading within a bearish ascending wedge
Market Sentiment:
We are still at the 'fear' zone in the fear greed index, but as the stock market showed a strong bounce, bullish sentiment begins to kick into the market again.
What We Believe
Based on purely the technicals demonstrated in the chart above, it seems as though the probabilities for a bearish case are higher. However, given that we take into consideration the amount of money the US government and Fed is looking to pour into the financial market, as well as the improving situation of the Corona Virus (Covid-19) in the states, the bullish scenario's probabilities aren't comparably too low either.
Trade Safe.
Spx500long

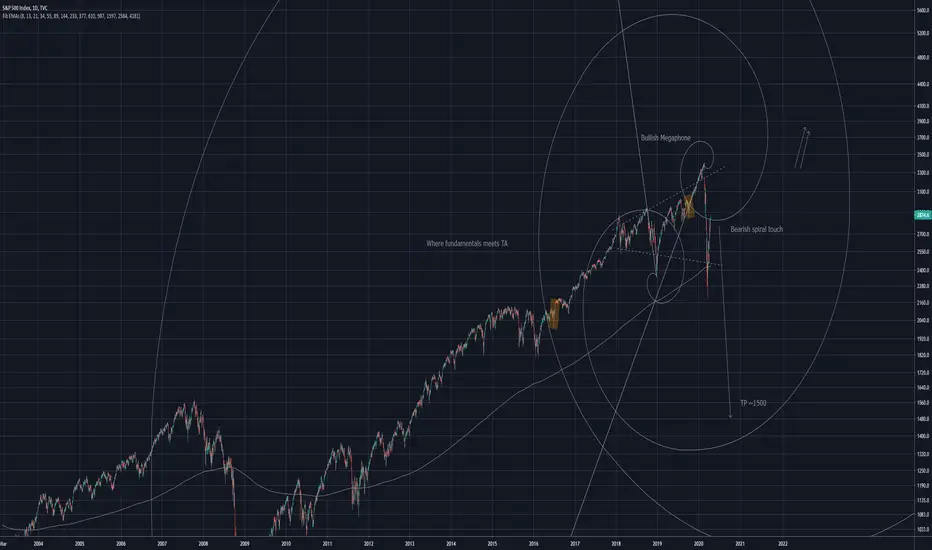
SPX Too good to be trueIt seems too good to be true! a bullish megaphone has emerged amidst all this chaos. This is where TA and fundamentals clash. Or do they?
As you can see the Fibonacci spiral provides sufficient resistance for a large drop. With the price gapping over the spiral!
I believe this to be one of the biggest bull traps i've seen.
I highly DOUBT we will see a follow through of this bullphone and a collapse is next.
Top Could be in Place in the S&P 500Top could be in here at the 1:1 extension confluent with the ML of the channel and the 2-year key horizontal level (around 2875). Notice that the C of the Y would be short here, like the C of the W. We are just below the GZ. We are drifting away from the ML of the PF. Nice 4H bearish divergence. Lets see what happens before the close.

S&P 500 INDEX (SPX) WeeklyDates in the future with the greatest probability for a price high or price low.
The Djinn Predictive Indicators are simple mathematical equations. Once an equation is given to Siri the algorithm provides the future price swing date. Djinn Indicators work on all charts, for any asset category and in all time frames. Occasionally a Djinn Predictive Indicator will miss its prediction date by one candlestick. If multiple Djinn prediction dates are missed and are plowed through by same color Henikin Ashi candles the asset is being "reset". The "reset" is complete when Henikin Ashi candles are back in sync with Djinn price high or low prediction dates.
One way the Djinn Indicator is used to enter and exit trades:
For best results trade in the direction of the trend.
The Linear Regression channel is used to determine trend direction. The Linear Regression is set at 2 -2 30.
When a green Henikin Ashi candle intersects with the linear regression upper deviation line (green line) and both indicators intersect with a Djinn prediction date a sell is triggered.
When a red Henikin Ashi candle intersects with the linear regression lower deviation line (red line) and both indicators intersect with a Djinn prediction date a buy is triggered.
This trading strategy works on daily, weekly and Monthly Djinn Predictive charts.
This is not trading advice. Trade at your own risk.

Don't Ignore This Clean Bullish Alternate in SPX FuturesBelieve it or not, this is the cleanest count in the S&P 500 futures. The second W2 didn't even reach the 0.236 which is quite doubtful, especially below such a potentially strong resistance. Are we hyper bullish? I don't think so but this market is capable of anything and may want to pump at each pretext (covid19 vaccine rumour like last night, tweet, etc.). Of course, these must not impact our technical approach.

One Final Push in the SPX?The Elliott wave micro count is getting very tricky and not ideal. Within the suggested upward corrective structure here, we can see a clean impulse coming off the low, followed by a flat. The third move is composed of 7 subwaves where we should expect 9 to complete this pink submicro ABC up.

SPX "Lazy Elliott Forecast"- Wave 2 bounced off near 50.0 - 61.8% of the "Lazy Fib" Levels.
- "Lazy" Wave 3 projected at around EMA 200

S&P 500 INDEX (SPX) MonthlyDates in the future with the greatest probability for a price high or price low.
The Djinn Predictive Indicators are simple mathematical equations. Once an equation is given to Siri the algorithm provides the future price swing date. Djinn Indicators work on all charts, for any asset category and in all time frames. Occasionally a Djinn Predictive Indicator will miss its prediction date by one candlestick. If multiple Djinn prediction dates are missed and are plowed through by same color Henikin Ashi candles the asset is being "reset". The "reset" is complete when Henikin Ashi candles are back in sync with Djinn price high or low prediction dates.
One way the Djinn Indicator is used to enter and exit trades:
For best results trade in the direction of the trend.
The Linear Regression channel is used to determine trend direction. The Linear Regression is set at 2 -2 30.
When a green Henikin Ashi candle intersects with the linear regression upper deviation line (green line) and both indicators intersect with a Djinn prediction date a sell is triggered.
When a red Henikin Ashi candle intersects with the linear regression lower deviation line (red line) and both indicators intersect with a Djinn prediction date a buy is triggered.
This trading strategy works on daily, weekly and Monthly Djinn Predictive charts.
This is not trading advice. Trade at your own risk.


Every MAJOR Market Cycle! (SPX)Symbol: SPX
Open your eyes this could just be the beginning of a new disaster.
----------------------------------------------------
Want to level up your trading skills?
We just realesed our new course! Follow our tradingview page and visit the link in our bio if you are looking for new strategy to add to your arsenal.
Also checkout our trading indicator available in the link on our page.
---------------------------------------------------
Thank you for your continued support, God bless.
- Major League Trader

SPX, S&P500 Daily Short Range - Thu Apr 9, 2020SPX, S&P500 Daily Short Range - Thu Apr 9, 2020
12:22:08 (UTC)
Thu Apr 9, 2020

SPX Why the bears could have been wrongSince my last SPX idea, the market has made a few moves that leads me to think bears may have been too bearish on the market. let me explain..
I think the market was always one step ahead and we completed wave A on the ABC reversal and we are already in B wave (where I stated COVID PEAK and optimism will lead the market higher). The move yesterday and today should confirm the B wave of the ABC and that the market is still headed down to around 1500 for the SPX.
Or are we?
Bulls argue that we are in a wave 4 of 5 of a longer bull market and that not only has the bear market ended but that we will now set a new all time high soon due to the feds unlimited QE. How could this be with all the disruption to the market and world economy? Well its hard to fight the fed but its also hard to not see how COVID has damaged the world economy. But then the world leaders are printing vast amount of money to stimulate the economy.
On a Technical bases, I will make an argument for both cases:
For the Bear Case - We are in an ABC reversal in which we are now in the B wave up which is the optimism that we are now turning the corner on COVID. I expect the rally to continue to day based on the futures which should lead to the bull trap zone.
The first resistance is the R1 which is around 2730. If the market break this then we are in what could be a bull trap since that is the former support. once the market is in the bull trap zone, the next resistance will be 2800 which is the .5 re-tracement of the whole A wave. If the bears fail to stop the bulls then the final resistance is the .618 (R3). With that broken, we could very well be in Bull market.
In my opinion looking at the weekly MACD, it does not look as though we could easily turn the tide but this is where the feds unlimited QE comes in with the bull case
For the Bull Case - This market "crash" has been all just a big misunderstanding which is being rectified by the feds action and Unlimeted QE. The crash was to sudden to be a long term bear market and it instead was a quick correction/wave 4 of a larger bull market to all time highs.
The trap set by the bears right above 2730 and below 2900 will turn into bear trap (since bears will anticipate a strong resistance and will short) before it breaks the daily 200EMA. After all Covid cases are peaking and the economy will be open soon and even if it doesn't we have the fed with unlimited PE.

Optimism is good but (1500-1600) can't be ignoredStocks markets, risk assets, Cryptos are rallying (maybe recovering is a better term) as markets participants try to price in a possible slowdown in the COVID-19 pandemic.
But, even if the Pandemic miraculously disappeared today, the massive economic shock won't disappear anytime soon.
Major indices all over the world have already plummeted into Bear Territories and the recent rally is simply a correction. In fact, if you look at previous bear markets, you will find plenty of temporary Bullish rallies within the larger Bearish move.
So, I would advise everyone not to get carried away by this. This, of course, doesn't mean that you shouldn't buy good value stocks. In fact, I have already bought some stocks last month and I plan on investing in good value stocks over the next 12-20 months and hold them till the end of the next Bull market.
In the next few months, we will be dealing with bad economic data, a bigger than 2008 recession(probably), job cuts.
So, such rallies as the one we are seeing now will be sold aggressively and markets will plummet into fresh lows. Until a 50%-55% drop has happened, we can't start thinking about bottom formation. And in my opinion, we are at least 18-36 months away from that.

Beware of this Bullish Scenario in SPXA second flat correction would be indicative of a 1212 structure...


SPX Idea4H timeframe (shorter timeframe) looks bearish with the development of a rising wedge, while weekly chart looks bullish with the development of a broadening wedge. Weird pair however on the weekly chart, couldn't find all the data.

$SPX The Up and Down movesPlease Like if you find this helpful.
I believe the bull market is dead but the market can still be traded. Overall, we could be in a massive ABC correction. I believe the economy was on shaky grounds before COVID which is why I called for a market correction in January. With COVID we are definitely going into a market crash and a global recession.
Technically - I think we are headed lower in the overall market but some ups in the near future. I think GILD readout is coming soon and if positive could push the whole market up. However that will be short lived once the true impact of COVID is known.
The Corporate debt crisis, Consumer debt crisis from those who no longer have jobs and banks that wont be getting money from mortgages and car notes.
Please do your due diligence as this is just my opinion and not an investment advice.

SP500 LONG WEEKLYDear Gamblers,
Seems that this index is going to take a deep breath and show us some strength. Personally i will trade this with stop loss really far away (due to volatility) so here is the strategy i am going to follow:
STRATEGY:
Open long IF today closing price is higher than 2500.
Target around 2900.
Stop 2150.
At 2900 i will start to add on shorts as i think this is merely a corrective move rather than a new bullish cycle.
Reasons: The recession has still not yet been discounted on the price and it will, believe me. Do not invest now, is not yet the time.
Have fun out there,
Kind regards,
BeniGo.
***I am not your financial advisor neither I intend to be, please do your own research before risking your money***


#S&P500 - Target Hit with 12 points difference #spx500 And now?The 6h chart shows the strong reaction of the S&P500 at the 2.259 level.
In today's low, the S&P500 reached this level by 12 points exactly and then turned north again.
Currently, the question arises, is this fast movement since Feb. 19, 2020 until March 18. 2020 an ABC formation or an impulse as 12345, so that after the upward-pointing 4 a further sell-off follows.
For shorties, however, this means in any case to slowly secure profits and to buy back their positions, because in the former case as ABC, a hard technical V formation could send the prices back up as fast as they were beaten down.
So the idea now is to go from short to long or the bear cap and put the bull cap back on.
What do you think about the idea?
Greetings from Hamburg
Stefan Bode

SPX500: Bull Rally May ResumeHi Traders,
Until the drop we had on February 20th, price was making a strong case for continuation towards 4000. This may still happen, as this current drop has completed a WXY expanding flat (i.e. wave 4 on the higher degree).
I'm therefore looking for price to confirm long setups as it is expected that the bull rally may resume.
Trade with care!
Regards
Wave Theorist


SPX 500 CORONA'DThe SPX index is painting what looks to be a bearish retest of the previous trendline. Looking to short this area heavily unless the corona situation changes for the better. Possible bottom targets shown on the chart. Setting bids for target 1 and 2, and conserving capital for a possible deep capitulation wick.
