SPX500 with potential Peek-Sell!Hey tradomaniacs,
SPX500 has tested the current upper trendline and could continue its way down as recent attempt to break has got rejected with a fakeout.
As always I`m very cautious here due to the current volatility and uncertainy of the market.
Generally we can assume that rising rates are putting stocks under pressure which is why I`m currently staying on the bearish side.
A breakout could of course cause another correction to the upside, but as long as this level holds we have a potential peek-sell here in case of another rally sell-off.
What do you think?
Spx500sell

SPX500 likely to FALL!Hey tradomaniacs,
recent action in the orderbook has shown a stop-hunt right above the key-resistance-level as one aggressive buyer has pushed price up into a roof of limit-orders whose got reloaded.
So far I expect the market to fall as the entire sentiment is pretty bearish.. only the key-support-zone (Weekly) is the reason for a run up as it is so significant to hold in order to to prevent a new and strong sell-off.
However, market-depth clearly showing signs of a another move down within the range, but be carefull with volatility!
What do you think?

Spx500 Short SignalGoing short on Spx as it’s extremely bearish on almost every timeframe. Going for a 3R trade. Goodluck and have proper risk management if you take this as well!

S&P 500 See, according to the existing page, our external harmonic bat pattern enters the fall from 4632 to 3875
*******
Fibonacci says we may have a 50% return, maybe up to 38 Fibonacci and sometimes 23 Fionachi will go back.
*******
We now see 4 strong downward contexts
******
But this 200 pp rise does not mean that stocks are rising
*******
With this situation, the news that indicates inflation in the world and traders are going all the way to gold.
********
I hope you are not fooled by HFT institutions in transactions
***********
We are the market fuel, so let 4500 be completed and the market trend be determined

SPX500 likely to FALL!Hey tradomaniacs,
its been a very slow day due to holidays almost everywher except the USA which could give us atleast one great opportunity now.
SPX500 just re-tested the key-resistance-area after the recent breakout and is giving us a nice chance to sell.
Market-Depth is currently showing iceberg-orders absorbing stop-runs above the resistance which makes it likely to see a move to the downside very soon.
As always I`m very carefully during holidays as liquidity is lower than usual making it harder to predict moves and volatility.
What do you think?

SPX500 likely to fall!Hey tradomaniacs,
the recent fakeout above the key-resistance is a strong indication of a falling market.
Previous fractal has shown two fakeouts and liquidity-grabbing into both directions showing trapped volume in that zone.
This can cause big players to cause fakemomentum to attract more buyers in order to absorb liquidity.
A potential S/H/S-Pattern would be another confirmation for my assumption.
Let`s see what happens!

S&P INDEXHello traders. I expect the price to correct at least 50% of its previous uptrend after the end of the pullback. Be profitable

SPX500 Short SetupS&P500 Short Setup
🔵 Entry Level: $4577.3
🟢 Take Profit: $4532.0 (1.31R)
⛔ Stop Loss: $4612.0
Reasoning:
1) We formed a double top and while the Risk-Reward-Ratio is not very favorable (just 1.3) the setup does provide for quick scalping.
2) With that being said, considering the spread on the platform you are trading (or commission) and the weekend fees (if the target doesn't get hit which is very likely) this trade wouldn't make too much sense, but I decided to share my thoughts just in case.

SPX500 SELL IDEAHey tradomaniacs,
welcome to another free trading-setup. After a successfull LONG I`m planning to short this baby for a pullback or to follow the current trend!
SPX500: Daytrade-Preparation
Market-Sell: 4357.00
Stop-Loss: 4370.00
Point of Risk-Reduction: 4341.00
Take-Profit: 4283.50
Stop-Loss: 130 pips (13 points)
Risk: 0,5% -1%
Risk-Reward: 6,0
LEAVE A LIKE AND A COMMENT - I appreciate every support! =)
Peace and good trades
Irasor
Wanna see more? Don`t forget to follow me

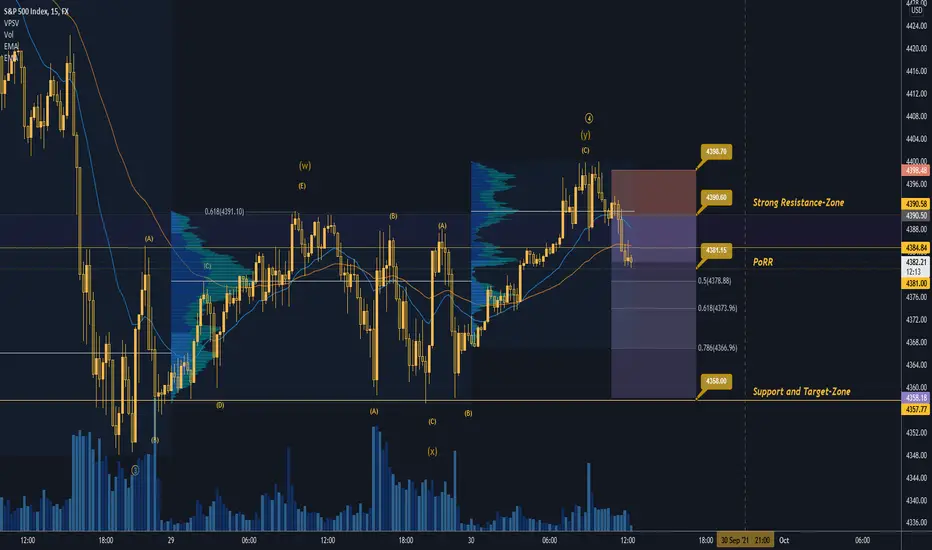
SPX500 SELL IDEAHey tradomaniacs,
welcome to another free trading-setup.
Notice: Volatility during US-Openign very likely. Rather stay out then with tight Stop-Loss!
SPX500: Daytrade-Preparation
Market-Sell: 4390.60
Stop-Loss: 4398.70
Point of Risk-Reduction: 4381.15
Take-Profit: 4358.00
Stop-Loss: 81 pips (8,1 points)
Risk: 0,5% -1%
Risk-Reward: 4,0
LEAVE A LIKE AND A COMMENT - I appreciate every support! =)
Peace and good trades
Irasor
Wanna see more? Don`t forget to follow me
SPX WARNING Fibonacci Circle top and Wave 5 topHi its been a while,
i've been very busy with The OWL and cryptos. I want to show you this chart cos i think we are approching a market top soon, the consequence of a hit of this 3.618 fib would end in my opinion a Supercycle.. which can bring a depression and a Deflation plase. Also this bearish divergence we created since May 1998 is no doubt.

SP500 - SHORT; Look for a Short Entry, right here!Like the title says...
... and the Nasdaq100
... and the NDX/US30 (Nadaq/Dow)
... and the Dow/Gold from this post;

PULLBACKS AND CORRECTIONS 2009 TO DATESWell, the chart speaks for it self. i Might have missed one or two :-).

Shooting Star forming W chartHi everyone,
It is too early to confirm it but if this candle close like this next friday on the W chart in Shooting Star or Gravestone we will have something to worry about.
Best to you !

S&P 500 Short SetupS&P 500 Short Setup
Entry: $3,864.4
TP & RR: $3,750.7 (2.22)
Stop Loss: $3,915.7
REASONS FOR THE TRADE
Not much to discuss here, aside from the fact that we are looking to open a short position at an established resistance level. This is one of those trades that it's just too obvious, so I believe a lot of traders will be stacking orders there. When/If our position gets filled, we will be monitoring it and if volume continues to increase or we pierce that level convincingly, we may close the trade prematurely and potentially open a long trade.

S&P 500 Ascending Channel - Short SetupSPX500 Short Trade
Entry: $3,866.6
TP & RR: $3,840.5 (1.13)
Stop Loss: $3,889.7
REASONS FOR THE TRADE
Straight off the bat, you notice two things here - ascending channel and opening a position against the trend with what I consider a bad Risk:Reward Ratio of just over 1. However, I believe that price can form a double top with bearish divergence, retrace back to the lower trendline and then continue up. Of course, we will be looking to open a long order somewhere at the lower trendline.
Stop Loss is set pretty high in case there's a fakeout. However, we will close the position if there's a convincing close above the recent high.

SP500 - SHORT; SELL it here!With the credit spreads looking like they're about to blow out, equities don't stand much of a chance here, either. Look for at least a >-11% dive here.
.... or ... SELL the Nasdaq100 ...
... as it doesn't look much different, either. A little difference without much distinction.
Here is an other clue;

S&P 500 Exhaustion - Sell OrderSPX500 Short Position
Entry: $3,865.0
TP & RR: $3,828.3 (1.95)
Stop Loss: $3,883.8
REASONS FOR THE TRADE
Clear divergence in the Market Flow indicator and we are reaching a trendline, which I believe will act as resistance. SL is set well above it, so we give the trade some space to breathe and hopefully develop as we expect. Target is set at the previously established resistance, which should now act as support.

SPX500/S&P500 ( DONT MISS THIS)here is SPX500 a.k.a S&P500 , we can see that price is moving respecting a bullish channel in 30 min, Then price has already tested the support of the channel, from here we are looking for buying in order for the price to test the upper boundary of the channel ( BUY AFTER RETEST)

S&P 500 FUTURES 1D-TIMEFRAME ANALYSIS✨S&P 500 FUTURES 1D-TIMEFRAME ANALYSIS✨
Hello ladies and gentlemen
This is my new idea for the S&P 500
My idea is that the index will go lower
broke down the 4 hours support sells offs start
I hope my idea is clear
Support me by like and share
Stay Safe💯
Good luck💰

SPXUSD SELL TP_2.798_18.92%_651.20pips_SL_3.490_1.42%_48.90pipsSPXUSD SELL TP_2.798_18.92%_651.20pips_SL_3.490_1.42%_48.90pips

S&P 500 4H-TIMEFRAME ANALYSIS 💡S&P 500 4H-TIMEFRAME ANALYSIS 💡
Hello ladies and gentlemen
This is my new idea for the S&P 500
My idea is that SPX will continue to downtrend
Targets
3200
3070
I hope my idea is clear
Support me by like and share
Good luck 💰💯

S&P 500 4H-TIMEFRAME ANALYSIS 💡S&P 500 4H-TIMEFRAME ANALYSIS 💡
Hello ladies and gentlemen
This is my new idea for the S&P 500
My idea is that SPX will continue to downtrend
I hope my idea is clear
Support me by like and share
Good luck💰💯
