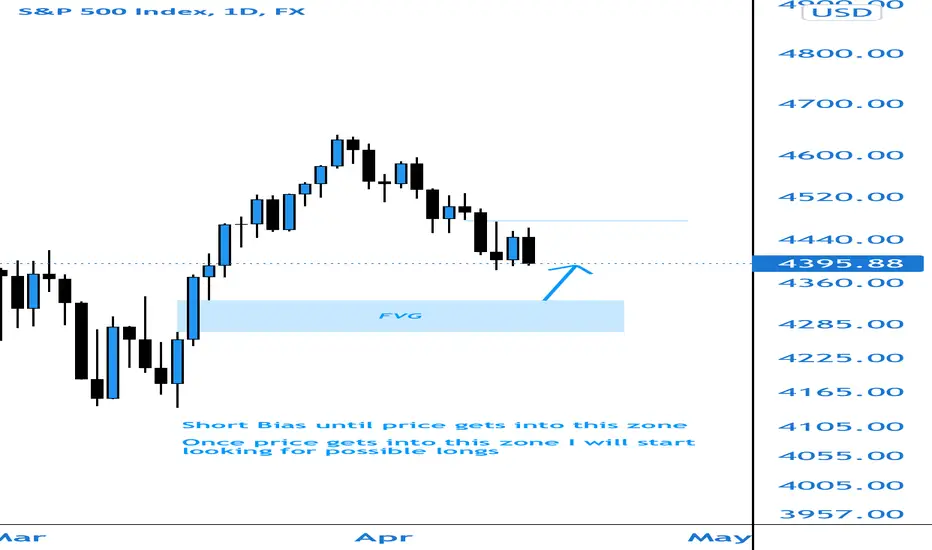
SPX for the upcoming weeksThis might not be the best info you'll ever get, but I think there will be start of and downtrend (again :D) from the red box and target is the green box. From the green box I'll be bullish for the upcoming weeks. (Fundamentally it doesn't make sense right now, but we'll see what's coming.)
I really hope that we could see atleast a new high, but im realistic. With the fundamental site right now I don't know what the possible target could be. (Could be atleast the red box again or even higher..)
I'll make an update asap. ;) Hope this will be useful to someone atleast.
Spx500short

S&P500 - Quick Chart AnalysisFor what it's worth, I'm dropping a very basic analysis of the current price action for S&P500. It seems that the price is resting on the middle trend line of the descending channel.
The risk-takers might want to open a long order at the current level of $4,150 with a target at $4,400 and a stop loss below the recent lowest low, which is $4,060.
I personally will be trading with the trend and have an order set up at $4,400 to short the index. The stop loss is slightly above that level.

SXP500 Index! - There's little hope here.SXP500 Index! Today we are here to talk about the SXP500 index.
Today: The index is trading at 4155. In the last trading session, we saw a sharp drop down that we expected earlier, as well as a return movement, here is a link to the idea.
What's on the market now:
There is a lot of volatility in the market right now. Associated with an attempt to buy the bottom from inexperienced players.
What are we waiting for today:
Today we are waiting for the continuation of the correction and the market movement to the area above 4190. However, the probability of the price movement to the level of 4050 - 4000 remains.
What I recommend:
If you want to open short:
Go short on pullbacks above 41 70- 41 90, limit your losses.
If you want to buy:
Long positions are possible from the level of 4015-3995. Limit your losses to the last low.
If you want to ask a question about an idea:
If you would like to get more info, contact me in the comments below.
And please don't forget to like. This greatly motivates me to share my trading ideas and market knowledge.
Also take a look at my profile where you will find the full history of trading every day on the SPX 500. Contact me in 1 or 2 days for further trading advice.
Don't forget to subscribe to my channel.
I post SPX 500 analytics every day, so check back tomorrow!
Like it and subscribe, thanks!
See you next time.

Spx500 Short SignalTaking a short from here if the liquidity from these equal highs gets taken. Goodluck and remember to use proper risk management!!
SXP500 Index! - What, are you taking a walk on the wild side?Today we are here to talk about the SXP500 index.
Today: The index is trading at 41 31. Last trading session we saw a sharp drop to 4100 which we expected earlier, here is a link to the idea.
What's on the market now:
Because of all the negative forecasts for the production of GDP and the presence of strong inflation. The US global market goes to the 3850 zone. And yesterday the market made a sharp fall.
What are we waiting for today:
Today we are waiting for the market to continue moving towards the 4035 zone. However, there is still a possibility of the price moving to the level of 4170. Associated with an attempt to buy the bottom from inexperienced players.
What I recommend:
If you want to open short:
Go short on pullbacks above 4170, limit your losses.
If you want to buy:
Long positions are possible from the level of 4050-4035. Limit your losses to the last low.
If you want to ask a question about an idea:
If you would like to get more info, contact me in the comments below.
And please don't forget to like. This greatly motivates me to share my trading ideas and market knowledge.
Also take a look at my profile where you will find the full history of trading every day on the SPX 500. Contact me in 1 or 2 days for further trading advice.
Don't forget to subscribe to my channel.
I post SPX 500 analytics every day, so check back tomorrow!
Like it and subscribe, thanks!
See you next time.

SP500 in sitting on support, breakdown is imminentIn my previous analysis regarding SP500, I said that I expect a drop under the 4k figure and things are getting closer and closer to that moment.
Looking at the price action for the past 4 months, we can see that after a very bad start of the year, stocks have tried to recover, but sellers capped gains in the 4.5-4.6k zone.
A new attempt of recovery started in late March, but again, sellers took control in the same 4.5-4.6k zone.
Going further into last week, we can see that after reaching support again, SP500 rebounded on We and Th, just to sell off hard on Friday.
All this price development, for me at least, is very bearish and I expect a break of support.
In the medium term, my target remains 3.5k, September and October's 2020 highs, and also Fibo 50% for the start of "pandemic" rise, and only SP500 back above 4.6k is bullish in my book.
Of course, also my strategy remains the same: Sell Rallies

SXP500 Index: Stumbled and fell.Today we are here to talk about the SXP500 index.
Today: The index is trading at 4287. In the last trading session, we saw a sharp increase to the 4315 zone which I expected earlier here is a link to the idea.
What's on the market now:
Today the market will be in the phase of fixing the profit received yesterday. Globally, the market moves to the 3780 zone. And yesterday it formed a local peak at the price of 4308.
What are we waiting for today:
We are waiting for a movement to the level of 4220 and a further attempt to rise to 43 35.
What I recommend:
If you want to open short:
It is possible to open short positions only on rollbacks 4300 – 43 35, while limiting risks.
If you want to buy:
Longs are prohibited. Possible sharp movement to the zone 41 00
If you want to ask a question about an idea:
If you would like to get more info, contact me in the comments below.
And please don't forget to like. This greatly motivates me to share my trading ideas and market knowledge.
Also take a look at my profile where you will find the full history of trading every day on the SPX 500. Contact me in 1 or 2 days for further trading advice.
Don't forget to subscribe to my channel.
I post SPX 500 analytics every day, so check back tomorrow!
See you next time!

SPX500 with potential Peek-Sell!Hey tradomaniacs,
SPX500 has tested the current upper trendline and could continue its way down as recent attempt to break has got rejected with a fakeout.
As always I`m very cautious here due to the current volatility and uncertainy of the market.
Generally we can assume that rising rates are putting stocks under pressure which is why I`m currently staying on the bearish side.
A breakout could of course cause another correction to the upside, but as long as this level holds we have a potential peek-sell here in case of another rally sell-off.
What do you think?

Spx500 Short SignalWe have almost every timeframe in sync to the downside. I feel like we will push up into here then sell off very hard and continue down into the 4100 level. Goodluck!

SPX500 likely to FALL!Hey tradomaniacs,
recent action in the orderbook has shown a stop-hunt right above the key-resistance-level as one aggressive buyer has pushed price up into a roof of limit-orders whose got reloaded.
So far I expect the market to fall as the entire sentiment is pretty bearish.. only the key-support-zone (Weekly) is the reason for a run up as it is so significant to hold in order to to prevent a new and strong sell-off.
However, market-depth clearly showing signs of a another move down within the range, but be carefull with volatility!
What do you think?

Spx500 Short SignalGoing short on Spx as it’s extremely bearish on almost every timeframe. Going for a 3R trade. Goodluck and have proper risk management if you take this as well!

S&P 500H&S target 3500
Black dashed line, ciould provide support for a week or so, RSI is near overesold.
However the weakness in May shoudl be used to sell and book profits/losses to enter at 3500 levels.

SPXNot financial advice.
The essence of investing & trading is the intelligent and patient preying on the greed, fear, impatience, addiction and ignorance of the majority. It's definitionally Darwinian.

SXP500 Index! - Are you ready to sell it?Today we are here to talk about the SXP500 index.
Today: The index is trading at 4296. Last trading session we saw a sharp rise after a correction to the 4220 zone that we expected earlier, here is a link to the idea.
What's on the market now:
Globally, the market moves to the 3780 zone. And yesterday it formed a local bottom at the price of 4200.
What are we waiting for today:
Today we are waiting for the price to stabilize and the market to move to the level of 4315. However, there is still a possibility of the price moving to the level of 4100.
What I recommend:
If you want to open short:
Open short positions above the level of 4315, limit your losses.
If you want to buy:
Long positions are possible from the 4220 level. Limit your losses to the last low.
If you would like to ask a question about this an idea:
If you would like to get more info, contact me in the comments below.
And please don't forget to like. This greatly motivates me to share my trading ideas and market knowledge.
Also take a look at my profile where you will find the full history of trading every day on the SPX 500. Contact me in 1 or 2 days for further trading advice.
Don't forget to subscribe to my channel
I post SPX 500 analytics every day, so check back tomorrow!
See you next time!

SPX (S&P 500 - 4262) vs BTC (Bitcoin 36/37K)We can see here that the SPX and BTC are highly correlated...
We can see BTC (Black line) moving ahead on the drop.
We can see the SPX dropping to 4262 short-term... We have clear and strong bearish signals to support his call.
We also have a GAP that is about to be filled on this drop.
What does this means for BTC (Bitcoin)?
We can say $36/$37,000 on the next drop.
Within 10 days more or less.
(Likely to happen fast though...)
Namaste.

SPX Short ZoneWe previously looked short on core key resistance and MA's. As we RE approach these levels our bias remains.
Awaiting Market sentiment input with news today and tomorrow. Trade Lightly.. SPREAD out!

SXP500 Index: Down one step.Today we are here to talk about the SXP500 index.
Today:
The index is trading at 4459. In the last trading session, we saw the price rise to the level of 44 85, which I mentioned earlier here is a link to the idea.
What's on the market now:
The market is in lateral movement. Yesterday it formed a local peak at the price of 44 85.
What are we waiting for today:
Today we are waiting for the market to stabilize and move to the level of 44 15. However, there is still a possibility of the price moving to the level of 45 35.
What I recommend:
If you want to open short:
It's too late to open short positions. This should have been done yesterday at 44 85 and above.
If you want to buy:
Long positions are possible below 44 15. Limit your losses to the last low.
If you want to ask a question about an idea:
If you would like to get more info, please do not hesitate to contact me in the comments below.
And please don't forget to like. This greatly motivates me to share my trading ideas and market knowledge.
Also take a look at my profile where you will find the full history of trading every day on the SPX 500. Contact me in 1 or 2 days for further trading advice.
Don't forget to subscribe to my channel.
I post SPX 500 analytics every day, so check back tomorrow!
See you next time!

Spx500 Short SignalPrice is showing signs of shifting down. Took this short looking to gain 3R risking 10 points targeting 30. I expect price to take out yesterday’s low atleast but we shall see.
I am not a financial advisor so trade at your own risk and always follow your risk management plan!

SXP500 Index: Waterfall.Today we are here to talk about the SXP500 index.
Today: The index is trading at 43 86. And at the moment the correction in the market continues.
What's on the market now:
The market is in a declining movement and the global market may fall to the level of 44 30 - 42 50
What are we waiting for today:
Today we are waiting for the exit from the correction and the market movement towards 4430 - 4310
What I recommend:
If you want to open short:
I recommend going short from 44 80, limit your risks
If you want to buy:
It is better to open long positions from the level below 43 30.
Please don't forget to like. This greatly motivates me to share my trading ideas and market knowledge.
Also take a look at my profile where you will find the full history of trading every day on the SPX 500. Contact me in 1 or 2 days for further trading advice.
I hope these tips were helpful to you, let me know in the comments below. don't forget to subscribe to my channel.
I post SPX 500 analytics every day, so check back tomorrow!
See you next time!
Bye!

S&P 500 See, according to the existing page, our external harmonic bat pattern enters the fall from 4632 to 3875
*******
Fibonacci says we may have a 50% return, maybe up to 38 Fibonacci and sometimes 23 Fionachi will go back.
*******
We now see 4 strong downward contexts
******
But this 200 pp rise does not mean that stocks are rising
*******
With this situation, the news that indicates inflation in the world and traders are going all the way to gold.
********
I hope you are not fooled by HFT institutions in transactions
***********
We are the market fuel, so let 4500 be completed and the market trend be determined

SPX500 likely to FALL!Hey tradomaniacs,
its been a very slow day due to holidays almost everywher except the USA which could give us atleast one great opportunity now.
SPX500 just re-tested the key-resistance-area after the recent breakout and is giving us a nice chance to sell.
Market-Depth is currently showing iceberg-orders absorbing stop-runs above the resistance which makes it likely to see a move to the downside very soon.
As always I`m very carefully during holidays as liquidity is lower than usual making it harder to predict moves and volatility.
What do you think?

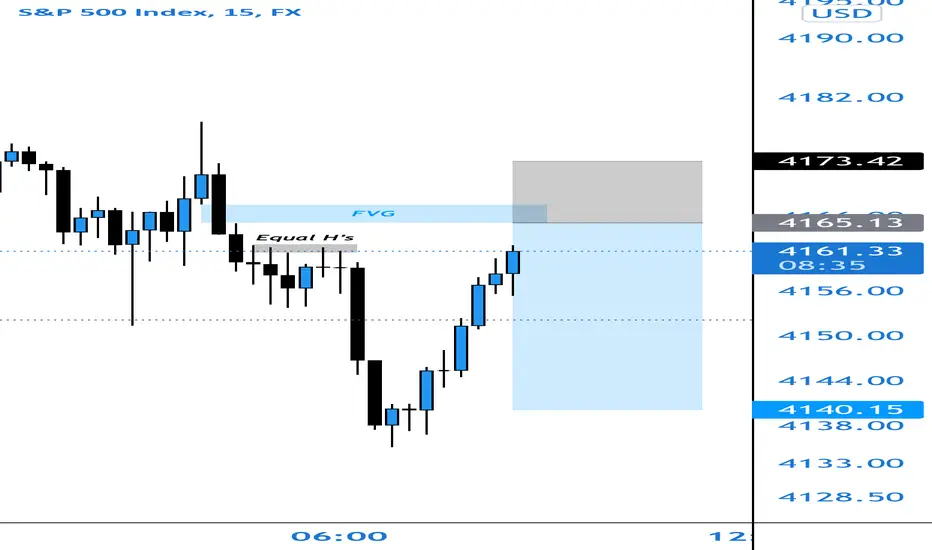
Spx500 Weekly OutlookShould start this week with 2 or 3 bearish days until we get into the FVG. From here we can look to take longs as a reaction from it being filled. Not sure if it will switch bullish but should get a good push up from there at the very least.
Goodluck this week and feel free to leave your opinion below!
SPX heading to 4660 rangeExpecting for the price to hit this price range shown on the chart and a little retrace..
Bigger time frame shows, it will go LONG for a while...
It is still a bullish pattern on Weekly time frame.. Still has not crossed the bearish mark...
Expecting Monday to be a GREEN DAY and GREEN WEEK ..overall..
_____________________________________________________________________________________________
Ecclesiastes 5:10 ESV
He who loves money will not be satisfied with money, nor he who loves wealth with his income; this also is vanity.
Hebrews 13:16
Do not neglect to do good and to share what you have, for such sacrifices are pleasing to God.
