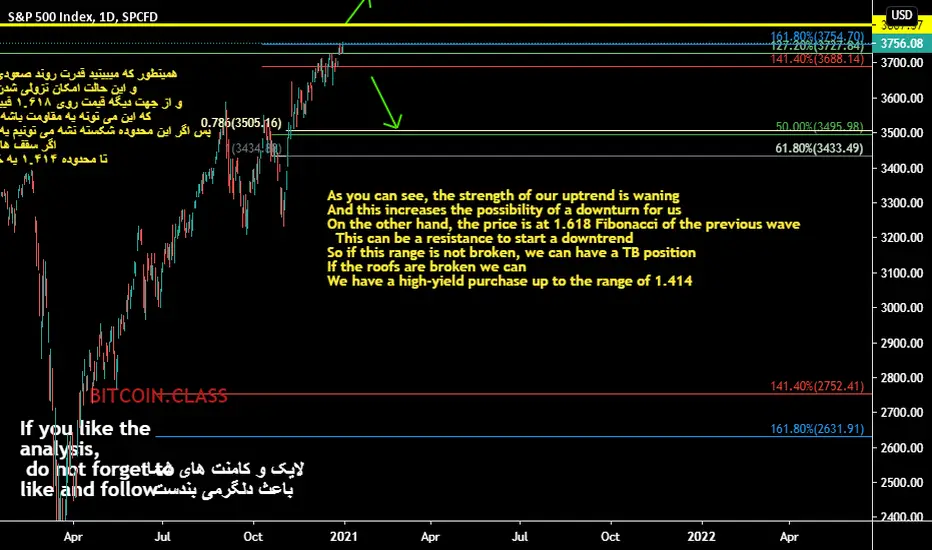
S&P500 will go down soonAs we can see, it is a clear wolfe waves pattern and strong divergence confirmation on all indicators.
Its day-candle chart and a first target is 3100 point zone
Spx500short

SPX 500 nosedive in the new year The stock market has been gunning for all-time highs despite the horrible economic news going around. Based on stimulus hopes and mass euphoria of the market reaching highs, with help from the fed, investors have just been buying at the highs and pushing it higher. However, I think all of that is quickly coming to an end. The market has been pushing higher with no real fundamentals to back it up and there is a lot of negative news looming over these markets. The new Covid-19 strain is quickly spreading throughout the U.S. now so there may be fear of new lockdowns, and Trump signed an executive order for the NYSE to delist some of the biggest Chinese telecom companies in the market. All of this news may trigger some major fears among investors to start taking massive profits and the market will definitely see a huge selloff because of that. Price action also tells the story of the nosedive. As you can see, the S&P has been moving in an ascending channel with a false breakout below on December 21st, which already indicates selling pressure. The market also closed the new year at the zone of resistance formed around 3758 and 3763. The market is showing significant rejection at that level, especially on the 1 hour time frame. You can also see a double top formation and this is further indication of a reversal. Many have been pointing to a glaring bearish RSI divergence forming and they are spot on with that analysis. The market should be seeing a huge correction and if it breaks past the strong support zone around 3641 and 3645 we could see the market bleed all the way to the 3500 levels. I'm currently in a sell position and I'll be targeting 3608. There are a lot of gaps to fill in this market and I believe they will be filled in the coming week.

S&P500 possible moves the indice can make coming into the new week.
lets watch the pair for a while, i will give an update on the same on Monday.

What are your ideas?
TVC:SPX
If you liked the analysis, follow me so that you can be informed of the analysis in the shortest possible time.
Support me with your likes and comments
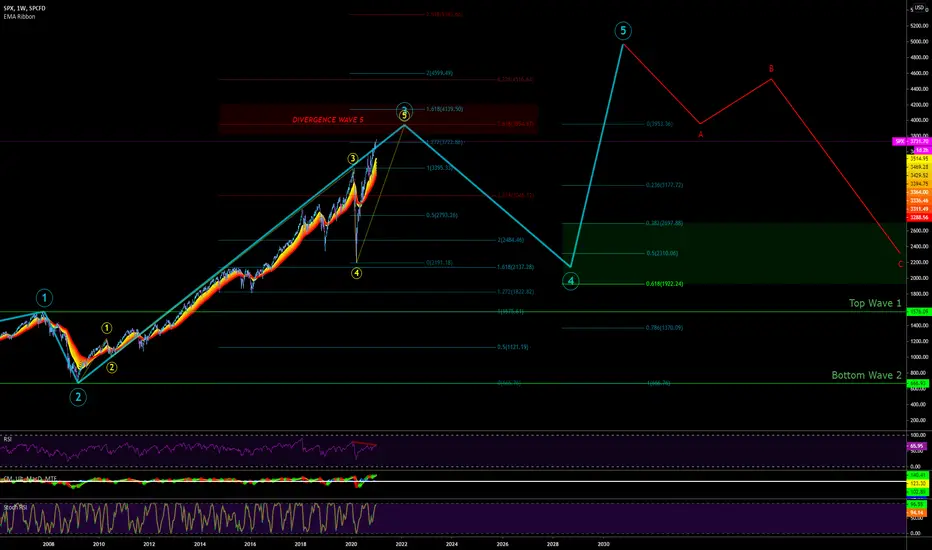
SPX WARNING! BE CAREFUL, END OF WAVE 3 IN APPROACH?Hi evreyone,
With a clear divergence on this last wave since january 2020, i believe investors must be careful with this main wave 5 inside the super cycle wave 3. If you ask me if it's the time to enter? My answer will be... "Bottom of wave 2 was the time to enter or bottom of main 4" which was the last march retracement.. but not now. On this chart you will see that many more entry points will be available on the retracement of Cycle Wave 4. For sure we can reach higher than 361.8% and make an extension... but i'm pretty sure that SPX will face big time resistance around 4000.00 and usualy 3.618% is the last exit for many patient investors. Also there is a clear bearish Divergence which is confirming Main W5. Long trader are now looking to exit slowly for cycle wave 4, HFT Bots will follow.
If Main Wave 5 Stop at 3.168% = 39 here are some entry points
0.398.87 = 2698.87
0.5 = 2310.86
0.618 = 1922.86 Golden Fib
You will find a lot of buyers between 0.5 and 0.618.
For sure those entry numbers refers only to a retracement that would start from the 3.618% a little less than 4k. The arrival of the Joe Biden
will be a great pretext, just be careful.
Defensive sectors would be appropriate right now like HEALTH. Health care tend to generate stable profit throughout all phases
of the economic cycle. Consumer Staples, Health Care, Utilities, Telecom services.
-If you take a look on the daily chart the daily EMA Ribbon is complety reversed which give more place to volatility and
retracements. I will post the EMA RIBBON under. For me this Look pretty scary at the moment, i would not be a buyer.
A gap like this usually can last around 65days to 80 days, this bring us between to the 6th and 21 of january.
Super Cycle wave 5 tend to loose strenght... but this wave can bring us around 5000 and more.
Have a wonderful christmas, best to you !

SPY Awfully similar patterns I am just drawing lines and scribbles here. Don't pay attention. Oh hey look FUBO is running....the next ROKU!
Wedge, megaphone, the W thingy with an extension. Am I just seeing things again or is this just some voodoo shit???
Every bear I know is dead, covered with blood and urine, laying in the dumpster somewhere. Nobody wants to short this thing anymore, Jerry got us!

BIG CRASH COMING!!! $3900 THEN BOOMSmall companies are going to fail due to this pandemic sweeping out the rug and causing a crash of biblical proportions... Looking to get short soon investers BE VERY CAREFUL!!!

SPX500 BreakdownUS SPX500 has formed a rising wedge and it has been retested, which shows a clear downside path. The retest of the wedge trendline has been rejected with a bearish engulfing candlestick pattern. Unless the US decides to print more money and flow them into the stock market, the price is going down. However, even if they do, the fall is hard to stop.

SPX500USD doesn't look good from this view - GAMBLEWatching 3700+ for failure before entry
Dangerously close to the end of a bad year. The timing could paint a nasty double top with a lower high, starting 2021 off with a soft foundation built on injections from the fed and pharma (aside from the "bad omen" that is a double top).

S&P 500 FUTURES 1D-TIMEFRAME ANALYSIS✨S&P 500 FUTURES 1D-TIMEFRAME ANALYSIS✨
Hello ladies and gentlemen
This is my new idea for the S&P 500
My idea is that the index will go lower
broke down the 4 hours support sells offs start
I hope my idea is clear
Support me by like and share
Stay Safe💯
Good luck💰

S&P at Yearly Resistance; Out of the Monthly BB With screaming bearish divergence
I've zoomed into the 3d chart to help get the best picture of the divergence and price action, balancing the pros and cons of using either the 1D or 1W charts. The price action is clearly out of the green monthly bollinger band and a chart lower down in the post will show how much SPX doesn't like that condition. The purple line is the resistance for megaphone that a lot of people have been watching since the price action bottomed late March. The megaphone should tighten either into a diamond or some other pattern but lots of people have been blown out shorting or FOMOing in due to all the gains they see.
The MACD is showing bearish divergence on the MACD proper, but also the histogram. Not a great place to be
The RSI is also showing a lot of bearish divergence with the arrow shaft being used to show a clear resistance line on the RSI.
Target Setting
The chart below is a little cleaner to see the big picture so lets take gander. The most common reaction to the price being out of the monthly bollinger band is a return of price action to the weekly baseline. That is only some 6-7% away at this point which would be a very minor drop. I would expect the RSI would be bouncing in the shaded area I added which is between 49-53. I don't think we will see that.
A more realistic move would be to either the lower limit of the weely bollinger band or the baseline of the monthy bollinger band, which are roughly at the same place (just like they were in the March dump. A long term chart shows how the price action acts when it has popped out of the monthly bollinger band. This isn't crypto, we don't start a parabolic bull market when the price action finnal forces its way out of the monthly bollinger band.
With SPX at this long term resistance and in a position where it cold lose a lot of its value I am getting risk averse.

US Stock Market - Great Short Selling Opportunity - SPX : S&P500I have absolutely no problem with short selling the market and this is probably one of the best short selling opportunities I've seen in a long time.
Please don't forget to FOLLOW, LIKE, and COMMENT ...
If you like my analysis:)
Trade Safe - Trade Well
Regards,
Michael Harding 😎 Chief Technical Strategist @ LEFTURN Inc.
RISK DISCLAIMER
Information and opinions contained with this post are for educational purposes and do not constitute trading recommendations. Trading Forex on margin carries a high level of risk and may not be suitable for all investors. Before deciding to invest in Forex you should consider your knowledge, investment objectives, and your risk appetite. Only trade/invest with funds you can afford to lose.

When is this cluster fuck going to dump? Are we there yet? My ANALytical skillset is telling me $400 on this bitch before we dump but my ego is telling me to short this party bus now and take the girls home. You can have the driver (his name is Jerry) but I am taking Ivanka with me. Dont fight the FED they said.

S&P 500 Current P/E Ratio: 37.44 - Average Ratio: 14.83Will price per earnings continue to soar?? 🤔
Please don't forget to FOLLOW, LIKE, and COMMENT ...
If you like my analysis:)
Trade Safe - Trade Well
Regards,
Michael Harding 😎 Chief Technical Strategist @ LEFTURN Inc.
RISK DISCLAIMER
Information and opinions contained with this post are for educational purposes and do not constitute trading recommendations. Trading Forex on margin carries a high level of risk and may not be suitable for all investors. Before deciding to invest in Forex you should consider your knowledge, investment objectives, and your risk appetite. Only trade/invest with funds you can afford to lose.

SPX500USD UPDATEFOLLOWING OUR PREVIOUS IDEA OF A SUBWAVE 4 TO WAVE 5, WE SEEM TO BE ENDING THE BULLRUN AND ENTER ANOTHER CORRECTIE PHASE, WITH DISTRIBUTION (MANIPULATION OF HIGHS) BUILDING UP AND A ENDING DIAGONAL OF THE SUB WAVE 5. THE DECLINE START OR CONTINUE FROM THE NEW YEAR. TRADE SAFE AND HAPPY COMING HOLIDAYS

A Planned Formation - WedgeSPX is clearly extending above levels of speculation and lacks reality.
evaluating crisis based on impact, it is clear COVID is the dominator.
The price does not accurately represent the current state of the economy, not just in the US but around the world, it is clear we are in times of turmoil.

S&P 500 Shorting Opportunity Short-TermS&P500 forming rising wedge like pattern near multiple resistance. So, I believe it might head downward near short-term. However, if it breaks upside, the complete setup will invalidate.

#sandp S & P Futures looked primed for a nice short #spxsS and P future looking overbought and demonstrating notable RSI to price action bearish divergence on the Daily Chart. Looks like a great short opportunity here. Refer to the chart for Point of control and other support resistance areas. I rely on volume profile clusters to establish supports and resistances in my charting style. Good luck!

SPX500 - Bigger short coming soon?!Hey tradomaniacs,
CAN SPX500 break the All-Time-High?
Looking at the structure you can clearly see another fakeout above the ALL-TIME-HIGH from November.
The current performance of the stockmarket, especially NASDAQ100 which should benefit the most from Corona as it lists the FANG-Stocks, is very weak compared to what the currency-market is pricing in.
Inrceasing corona-figures could cause more pressure as vaccine-news do almost have no impact at all anymore.
As always we should look at potential stimulus-news which would probably destroy this idea but.... who is stell left to BUY when every positive scenario is priced in?
If SPX500 continues the current breakout of the Trendchannel we finally might see some great PULLBACKS in the FOREX-Market.
LEAVE A LIKE AND A COMMENT - I appreciate every support! =)
Peace and good trades
Irasor
Wanna see more? Don`t forget to follow me.
Any questions? PM me. :-)

Someone is going to get squeezed hereWhether you are a bull or a bear - thats your personal internal problem to deal with. Market likes to punish the crowded side. Figured out where the crowd is and hop over the fence or get squeezed. #sp #sp500

S&P 500 about to crash? Broadening bearish top.S&P 500 needs to start moving above the green trendline soon... or else.
Financially things in the #USA are looking grim, so we could soon be witnessing a disaster.
Notice: Dips are getting bigger after every rejection.
#SPX is forming a bearish broadening top that tends to break DOWN.
Let me kow what you think.

SPX500 is going to be in favor of bulls s&p500 in 4h time frame is bull related and the cup formation is getting completed while the classic indicators are also confirm its bullish trend
we have to wait for trend to cross the plotted resistance
